Grunnleggende statistikk
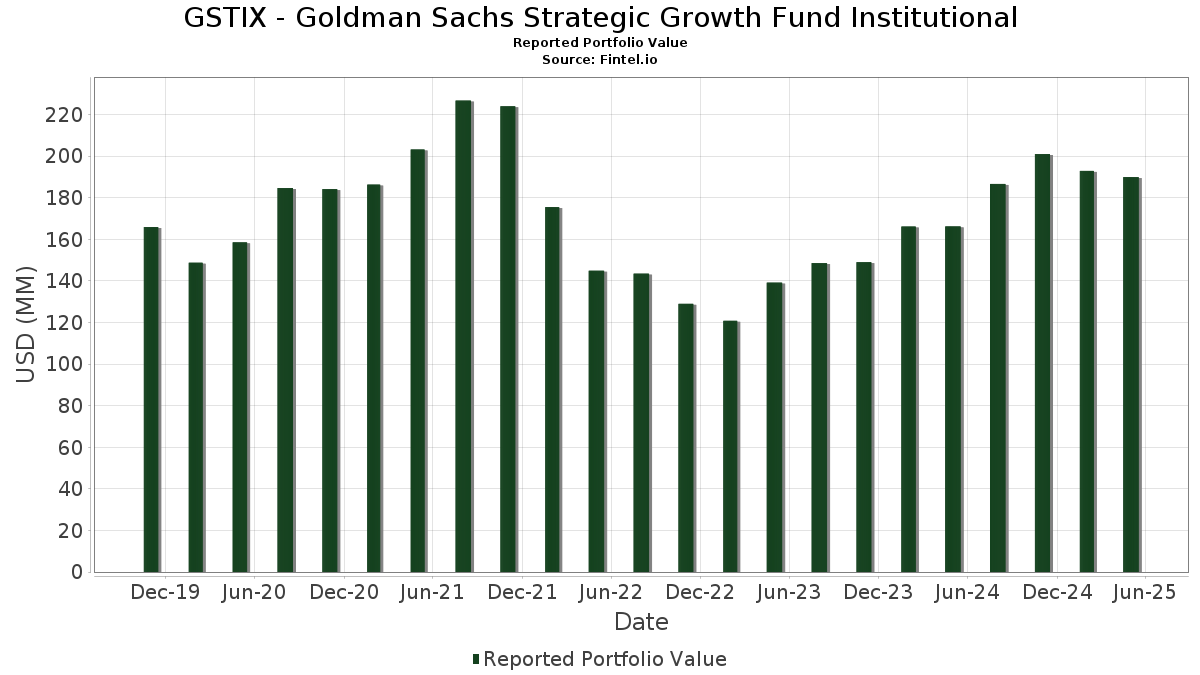
| Porteføljeverdi | $ 189 949 034 |
| Nåværende posisjoner | 55 |
Siste beholdninger, prestasjoner, forvaltet kapital (fra 13F, 13D)
GSTIX - Goldman Sachs Strategic Growth Fund Institutional har oppgitt 55 totale beholdninger i sine siste SEC-arkiveringer. Siste porteføljeverdi er beregnet til 189 949 034 USD. Faktisk forvaltet kapital (AUM) er denne verdien pluss kontanter (som ikke er oppgitt). GSTIX - Goldman Sachs Strategic Growth Fund Institutionals største beholdninger er Microsoft Corporation (US:MSFT) , Apple Inc. (US:AAPL) , NVIDIA Corporation (US:NVDA) , Amazon.com, Inc. (US:AMZN) , and Meta Platforms, Inc. (US:META) . GSTIX - Goldman Sachs Strategic Growth Fund Institutionals nye posisjoner inkluderer Costco Wholesale Corporation (US:COST) , Bank of America Corporation (US:BAC) , .
De største økningene dette kvartalet
Vi bruker endringen i porteføljeallokeringen fordi dette er det mest meningsfulle målet. Endringer kan skyldes handler eller endringer i aksjekursene.
| Verdipapirer | Aksjer (MM) |
Verdi (MM$) |
Portefølje % | ΔPortefølje % |
|---|---|---|---|---|
| 0,00 | 4,06 | 2,1324 | 2,1324 | |
| 0,05 | 23,02 | 12,0919 | 1,4256 | |
| 0,03 | 1,51 | 0,7908 | 0,7908 | |
| 0,01 | 3,49 | 1,8319 | 0,5209 | |
| 0,00 | 5,52 | 2,8984 | 0,5202 | |
| 0,00 | 2,32 | 1,2185 | 0,4415 | |
| 0,01 | 3,72 | 1,9527 | 0,3183 | |
| 0,02 | 3,61 | 1,8965 | 0,2473 | |
| 0,01 | 3,05 | 1,6021 | 0,2340 | |
| 0,00 | 1,80 | 0,9477 | 0,1564 |
De største reduksjonene dette kvartalet
Vi bruker endringen i porteføljeallokeringen fordi dette er det mest meningsfulle målet. Endringer kan skyldes handler eller endringer i aksjekurser.
| Verdipapirer | Aksjer (MM) |
Verdi (MM$) |
Portefølje % | ΔPortefølje % |
|---|---|---|---|---|
| 0,10 | 20,49 | 10,7633 | −2,5873 | |
| 0,45 | 0,45 | 0,2382 | −0,7155 | |
| 0,02 | 1,24 | 0,6503 | −0,5225 | |
| 0,01 | 5,33 | 2,7997 | −0,4607 | |
| 0,02 | 9,75 | 5,1214 | −0,4155 | |
| 0,07 | 13,59 | 7,1389 | −0,3266 | |
| 0,01 | 2,28 | 1,1965 | −0,1596 | |
| 0,01 | 0,75 | 0,3926 | −0,1519 | |
| 0,01 | 1,28 | 0,6708 | −0,1334 | |
| 0,01 | 1,05 | 0,5508 | −0,1185 |
13F- og Fondsarkiveringer
Dette skjemaet ble sendt inn den 2025-07-22 for rapporteringsperioden 2025-05-31. Klikk på lenkeikonet for å se hele transaksjonshistorikken.
Oppgradere for å låse opp premiedata og eksportere til Excel![]() .
.
| Verdipapirer | Type | Gjennomsnittlig aksjekurs | Aksjer (MM) |
ΔAksjer (%) |
ΔAksjer (%) |
Verdi ($MM) |
Portefølje (%) |
ΔPortefølje (%) |
|
|---|---|---|---|---|---|---|---|---|---|
| MSFT / Microsoft Corporation | 0,05 | −3,77 | 23,02 | 11,59 | 12,0919 | 1,4256 | |||
| AAPL / Apple Inc. | 0,10 | −4,45 | 20,49 | −20,64 | 10,7633 | −2,5873 | |||
| NVDA / NVIDIA Corporation | 0,14 | −7,54 | 18,73 | 0,01 | 9,8361 | 0,1554 | |||
| AMZN / Amazon.com, Inc. | 0,07 | −2,53 | 13,59 | −5,87 | 7,1389 | −0,3266 | |||
| META / Meta Platforms, Inc. | 0,02 | −6,04 | 9,75 | −8,96 | 5,1214 | −0,4155 | |||
| AVGO / Broadcom Inc. | 0,03 | −17,88 | 7,35 | −0,31 | 3,8627 | 0,0483 | |||
| MA / Mastercard Incorporated | 0,01 | −5,63 | 6,43 | −4,10 | 3,3791 | −0,0895 | |||
| GOOGL / Alphabet Inc. | 0,03 | −2,53 | 5,56 | −1,70 | 2,9187 | −0,0039 | |||
| NFLX / Netflix, Inc. | 0,00 | −2,56 | 5,52 | 19,98 | 2,8984 | 0,5202 | |||
| LLY / Eli Lilly and Company | 0,01 | 5,49 | 5,33 | −15,48 | 2,7997 | −0,4607 | |||
| COST / Costco Wholesale Corporation | 0,00 | 4,06 | 2,1324 | 2,1324 | |||||
| APP / AppLovin Corporation | 0,01 | −2,52 | 3,72 | 17,59 | 1,9527 | 0,3183 | |||
| SNOW / Snowflake Inc. | 0,02 | −2,53 | 3,61 | 13,20 | 1,8965 | 0,2473 | |||
| GOOG / Alphabet Inc. | 0,02 | −2,53 | 3,50 | −2,18 | 1,8396 | −0,0114 | |||
| GEV / GE Vernova Inc. | 0,01 | −2,52 | 3,49 | 37,55 | 1,8319 | 0,5209 | |||
| LNG / Cheniere Energy, Inc. | 0,01 | −2,53 | 3,05 | 1,09 | 1,6031 | 0,0418 | |||
| TSLA / Tesla, Inc. | 0,01 | −2,52 | 3,05 | 15,27 | 1,6021 | 0,2340 | |||
| KLAC / KLA Corporation | 0,00 | 44,58 | 2,32 | 54,39 | 1,2185 | 0,4415 | |||
| BSX / Boston Scientific Corporation | 0,02 | −2,53 | 2,32 | −1,11 | 1,2165 | 0,0051 | |||
| SPOT / Spotify Technology S.A. | 0,00 | −2,55 | 2,31 | 6,65 | 1,2133 | 0,0930 | |||
| ISRG / Intuitive Surgical, Inc. | 0,00 | −2,56 | 2,29 | −6,10 | 1,2042 | −0,0581 | |||
| CRM / Salesforce, Inc. | 0,01 | −2,52 | 2,28 | −13,16 | 1,1965 | −0,1596 | |||
| SHW / The Sherwin-Williams Company | 0,01 | −2,53 | 2,10 | −3,45 | 1,1017 | −0,0217 | |||
| ROK / Rockwell Automation, Inc. | 0,01 | −2,53 | 2,04 | 7,08 | 1,0730 | 0,0869 | |||
| CRWD / CrowdStrike Holdings, Inc. | 0,00 | −2,55 | 1,80 | 17,91 | 0,9477 | 0,1564 | |||
| DDOG / Datadog, Inc. | 0,01 | 14,11 | 1,71 | 15,44 | 0,8996 | 0,1324 | |||
| ABBV / AbbVie Inc. | 0,01 | −2,52 | 1,66 | −13,24 | 0,8744 | −0,1173 | |||
| ETN / Eaton Corporation plc | 0,01 | −2,51 | 1,64 | 6,43 | 0,8606 | 0,0646 | |||
| DASH / DoorDash, Inc. | 0,01 | −2,51 | 1,51 | 2,51 | 0,7945 | 0,0315 | |||
| BAC / Bank of America Corporation | 0,03 | 1,51 | 0,7908 | 0,7908 | |||||
| ODFL / Old Dominion Freight Line, Inc. | 0,01 | −2,53 | 1,37 | −11,55 | 0,7206 | −0,0813 | |||
| ALNY / Alnylam Pharmaceuticals, Inc. | 0,00 | −2,51 | 1,36 | 20,32 | 0,7159 | 0,1303 | |||
| MLM / Martin Marietta Materials, Inc. | 0,00 | −2,57 | 1,31 | 10,39 | 0,6868 | 0,0745 | |||
| TEAM / Atlassian Corporation | 0,01 | 12,41 | 1,28 | −17,88 | 0,6708 | −0,1334 | |||
| DT / Dynatrace, Inc. | 0,02 | −2,53 | 1,26 | −7,99 | 0,6597 | −0,0465 | |||
| MCD / McDonald's Corporation | 0,00 | −2,51 | 1,25 | −0,79 | 0,6589 | 0,0053 | |||
| MRVL / Marvell Technology, Inc. | 0,02 | −16,74 | 1,24 | −45,41 | 0,6503 | −0,5225 | |||
| LOW / Lowe's Companies, Inc. | 0,01 | −2,51 | 1,15 | −11,49 | 0,6031 | −0,0677 | |||
| ARGX / argenx SE - Depositary Receipt (Common Stock) | 0,00 | −2,57 | 1,11 | −10,59 | 0,5811 | −0,0587 | |||
| AME / AMETEK, Inc. | 0,01 | −2,52 | 1,10 | −7,96 | 0,5774 | −0,0401 | |||
| ABT / Abbott Laboratories | 0,01 | −2,53 | 1,05 | −5,66 | 0,5519 | −0,0239 | |||
| TXN / Texas Instruments Incorporated | 0,01 | −14,44 | 1,05 | −22,20 | 0,5508 | −0,1185 | |||
| AZN / AstraZeneca PLC - Depositary Receipt (Common Stock) | 0,01 | −2,53 | 0,98 | −6,82 | 0,5169 | −0,0294 | |||
| WCN / Waste Connections, Inc. | 0,00 | −2,51 | 0,96 | 1,27 | 0,5033 | 0,0140 | |||
| SPGI / S&P Global Inc. | 0,00 | −2,58 | 0,93 | −6,46 | 0,4873 | −0,0251 | |||
| ROST / Ross Stores, Inc. | 0,01 | −2,51 | 0,91 | −2,68 | 0,4768 | −0,0054 | |||
| NBIX / Neurocrine Biosciences, Inc. | 0,01 | −2,52 | 0,87 | 1,05 | 0,4550 | 0,0116 | |||
| IOT / Samsara Inc. | 0,02 | −2,53 | 0,86 | −4,87 | 0,4515 | −0,0156 | |||
| HUBS / HubSpot, Inc. | 0,00 | −2,67 | 0,78 | −20,68 | 0,4071 | −0,0982 | |||
| LEN / Lennar Corporation | 0,01 | −2,52 | 0,76 | −13,65 | 0,3992 | −0,0554 | |||
| MU / Micron Technology, Inc. | 0,01 | −29,65 | 0,75 | −29,06 | 0,3926 | −0,1519 | |||
| CAVA / CAVA Group, Inc. | 0,01 | −2,53 | 0,68 | −16,75 | 0,3555 | −0,0643 | |||
| APD / Air Products and Chemicals, Inc. | 0,00 | −2,48 | 0,66 | −14,01 | 0,3456 | −0,0498 | |||
| US38141W2733 / Goldman Sachs Financial Square Funds - Government Fund | 0,45 | −75,41 | 0,45 | −75,43 | 0,2382 | −0,7155 | |||
| MRP / Millrose Properties, Inc. | 0,00 | −2,50 | 0,10 | 19,28 | 0,0524 | 0,0090 |