Grunnleggende statistikk
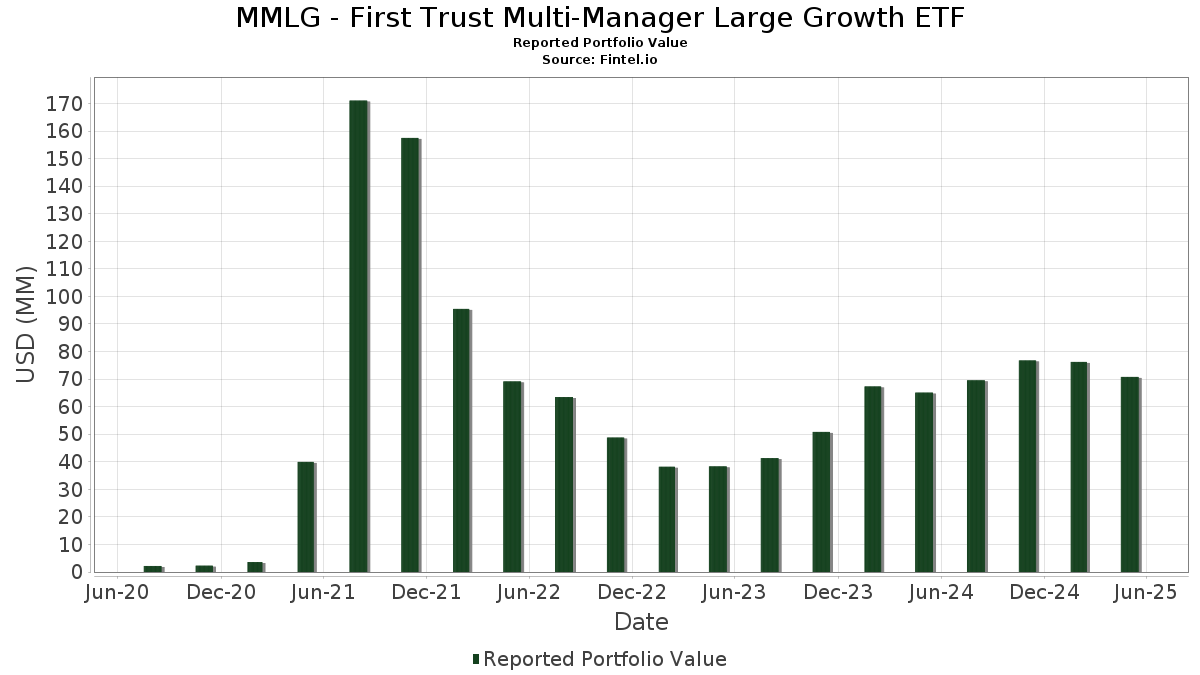
| Porteføljeverdi | $ 70 787 203 |
| Nåværende posisjoner | 78 |
Siste beholdninger, prestasjoner, forvaltet kapital (fra 13F, 13D)
MMLG - First Trust Multi-Manager Large Growth ETF har oppgitt 78 totale beholdninger i sine siste SEC-arkiveringer. Siste porteføljeverdi er beregnet til 70 787 203 USD. Faktisk forvaltet kapital (AUM) er denne verdien pluss kontanter (som ikke er oppgitt). MMLG - First Trust Multi-Manager Large Growth ETFs største beholdninger er NVIDIA Corporation (US:NVDA) , Microsoft Corporation (US:MSFT) , Amazon.com, Inc. (US:AMZN) , Meta Platforms, Inc. (US:META) , and Netflix, Inc. (US:NFLX) . MMLG - First Trust Multi-Manager Large Growth ETFs nye posisjoner inkluderer Arthur J. Gallagher & Co. (US:AJG) , Hilton Worldwide Holdings Inc. (US:HLT) , American Tower Corporation (US:AMT) , BJ's Wholesale Club Holdings, Inc. (US:BJ) , and Linde plc (IT:1LINUS) .
De største økningene dette kvartalet
Vi bruker endringen i porteføljeallokeringen fordi dette er det mest meningsfulle målet. Endringer kan skyldes handler eller endringer i aksjekursene.
| Verdipapirer | Aksjer (MM) |
Verdi (MM$) |
Portefølje % | ΔPortefølje % |
|---|---|---|---|---|
| 0,05 | 6,77 | 9,5656 | 2,2957 | |
| 0,01 | 5,36 | 7,5791 | 2,1293 | |
| 0,00 | 0,94 | 1,3335 | 1,3335 | |
| 0,00 | 3,03 | 4,2838 | 1,1811 | |
| 0,00 | 0,75 | 1,0624 | 1,0624 | |
| 0,00 | 1,48 | 2,0963 | 0,7601 | |
| 0,01 | 2,82 | 3,9904 | 0,6889 | |
| 2,05 | 2,05 | 2,8986 | 0,6187 | |
| 0,01 | 1,09 | 1,5454 | 0,5395 | |
| 0,00 | 0,36 | 0,5046 | 0,5046 |
De største reduksjonene dette kvartalet
Vi bruker endringen i porteføljeallokeringen fordi dette er det mest meningsfulle målet. Endringer kan skyldes handler eller endringer i aksjekurser.
| Verdipapirer | Aksjer (MM) |
Verdi (MM$) |
Portefølje % | ΔPortefølje % |
|---|---|---|---|---|
| 0,01 | 2,40 | 3,3870 | −1,9058 | |
| 0,00 | 0,90 | 1,2743 | −1,7803 | |
| 0,01 | 1,02 | 1,4399 | −1,2018 | |
| 0,01 | 0,64 | 0,9002 | −0,9483 | |
| 0,00 | 0,92 | 1,3051 | −0,5688 | |
| 0,01 | 0,53 | 0,7459 | −0,5006 | |
| 0,00 | 1,05 | 1,4828 | −0,4995 | |
| 0,01 | 1,11 | 1,5660 | −0,3608 | |
| 0,01 | 1,25 | 1,7668 | −0,2922 | |
| 0,00 | 0,71 | 0,9973 | −0,2773 |
13F- og Fondsarkiveringer
Dette skjemaet ble sendt inn den 2025-07-25 for rapporteringsperioden 2025-05-31. Klikk på lenkeikonet for å se hele transaksjonshistorikken.
Oppgradere for å låse opp premiedata og eksportere til Excel![]() .
.
| Verdipapirer | Type | Gjennomsnittlig aksjekurs | Aksjer (MM) |
ΔAksjer (%) |
ΔAksjer (%) |
Verdi ($MM) |
Portefølje (%) |
ΔPortefølje (%) |
|
|---|---|---|---|---|---|---|---|---|---|
| NVDA / NVIDIA Corporation | 0,05 | 12,96 | 6,77 | 22,19 | 9,5656 | 2,2957 | |||
| MSFT / Microsoft Corporation | 0,01 | 11,38 | 5,36 | 29,17 | 7,5791 | 2,1293 | |||
| AMZN / Amazon.com, Inc. | 0,02 | −6,22 | 4,15 | −9,44 | 5,8583 | −0,1491 | |||
| META / Meta Platforms, Inc. | 0,01 | −7,87 | 3,24 | −10,73 | 4,5851 | −0,1846 | |||
| NFLX / Netflix, Inc. | 0,00 | 4,15 | 3,03 | 28,21 | 4,2838 | 1,1811 | |||
| AVGO / Broadcom Inc. | 0,01 | −7,52 | 2,82 | 12,25 | 3,9904 | 0,6889 | |||
| AAPL / Apple Inc. | 0,01 | −28,44 | 2,40 | −40,58 | 3,3870 | −1,9058 | |||
| NOW / ServiceNow, Inc. | 0,00 | −17,76 | 2,34 | −10,57 | 3,3020 | −0,1268 | |||
| SPOT / Spotify Technology S.A. | 0,00 | −5,84 | 2,33 | 2,97 | 3,2870 | 0,3234 | |||
| US61747C5821 / Morgan Stanley Institutional Liquidity Funds - Treasury Portfolio | 2,05 | 18,07 | 2,05 | 18,08 | 2,8986 | 0,6187 | |||
| SE / Sea Limited - Depositary Receipt (Common Stock) | 0,01 | −15,81 | 1,66 | 6,09 | 2,3393 | 0,2915 | |||
| ICE / Intercontinental Exchange, Inc. | 0,01 | 14,69 | 1,55 | 19,00 | 2,1874 | 0,4810 | |||
| GOOGL / Alphabet Inc. | 0,01 | −8,94 | 1,51 | −8,15 | 2,1357 | −0,0239 | |||
| V / Visa Inc. | 0,00 | 44,71 | 1,48 | 45,68 | 2,0963 | 0,7601 | |||
| IOT / Samsara Inc. | 0,03 | 6,42 | 1,43 | 3,85 | 2,0236 | 0,2143 | |||
| DXCM / DexCom, Inc. | 0,01 | −17,92 | 1,25 | −20,28 | 1,7668 | −0,2922 | |||
| DASH / DoorDash, Inc. | 0,01 | −22,26 | 1,23 | −18,24 | 1,7429 | −0,2374 | |||
| NET / Cloudflare, Inc. | 0,01 | −33,89 | 1,11 | −24,52 | 1,5660 | −0,3608 | |||
| RBLX / Roblox Corporation | 0,01 | 4,39 | 1,09 | 42,69 | 1,5454 | 0,5395 | |||
| MA / Mastercard Incorporated | 0,00 | −18,70 | 1,06 | −17,39 | 1,5037 | −0,1868 | |||
| APP / AppLovin Corporation | 0,00 | −42,42 | 1,05 | −30,53 | 1,4828 | −0,4995 | |||
| SHOP / Shopify Inc. | 0,01 | −47,12 | 1,02 | −49,40 | 1,4399 | −1,2018 | |||
| NU / Nu Holdings Ltd. | 0,08 | −16,37 | 0,96 | −6,54 | 1,3528 | 0,0082 | |||
| AJG / Arthur J. Gallagher & Co. | 0,00 | 0,94 | 1,3335 | 1,3335 | |||||
| LLY / Eli Lilly and Company | 0,00 | −19,28 | 0,92 | −35,32 | 1,3051 | −0,5688 | |||
| TEAM / Atlassian Corporation | 0,00 | −46,96 | 0,90 | −61,28 | 1,2743 | −1,7803 | |||
| DDOG / Datadog, Inc. | 0,01 | −24,07 | 0,89 | −23,24 | 1,2615 | −0,2641 | |||
| CVNA / Carvana Co. | 0,00 | 0,75 | 1,0624 | 1,0624 | |||||
| TSLA / Tesla, Inc. | 0,00 | −38,55 | 0,71 | −27,39 | 0,9973 | −0,2773 | |||
| AXON / Axon Enterprise, Inc. | 0,00 | −16,51 | 0,68 | 18,71 | 0,9596 | 0,2079 | |||
| TSM / Taiwan Semiconductor Manufacturing Company Limited - Depositary Receipt (Common Stock) | 0,00 | −16,56 | 0,65 | −10,67 | 0,9237 | −0,0364 | |||
| UBER / Uber Technologies, Inc. | 0,01 | −59,15 | 0,64 | −54,76 | 0,9002 | −0,9483 | |||
| INTU / Intuit Inc. | 0,00 | −17,32 | 0,54 | 1,50 | 0,7677 | 0,0652 | |||
| XYZ / Block, Inc. | 0,01 | −41,23 | 0,53 | −44,47 | 0,7459 | −0,5006 | |||
| CRM / Salesforce, Inc. | 0,00 | −19,37 | 0,47 | −28,18 | 0,6634 | −0,1942 | |||
| ORLY / O'Reilly Automotive, Inc. | 0,00 | −19,06 | 0,45 | −19,31 | 0,6319 | −0,0964 | |||
| KLAC / KLA Corporation | 0,00 | −26,14 | 0,44 | −21,15 | 0,6225 | −0,1106 | |||
| VEEV / Veeva Systems Inc. | 0,00 | −30,63 | 0,40 | −13,30 | 0,5712 | −0,0416 | |||
| RARE / Ultragenyx Pharmaceutical Inc. | 0,01 | −16,41 | 0,40 | −33,61 | 0,5639 | −0,2262 | |||
| CMG / Chipotle Mexican Grill, Inc. | 0,01 | −17,79 | 0,37 | −23,86 | 0,5197 | −0,1130 | |||
| PANW / Palo Alto Networks, Inc. | 0,00 | 2,61 | 0,36 | 3,43 | 0,5128 | 0,0535 | |||
| WMT / Walmart Inc. | 0,00 | 0,36 | 0,5046 | 0,5046 | |||||
| QCOM / QUALCOMM Incorporated | 0,00 | −16,84 | 0,36 | −23,16 | 0,5017 | −0,1047 | |||
| CDNS / Cadence Design Systems, Inc. | 0,00 | −12,11 | 0,35 | 0,58 | 0,4945 | 0,0385 | |||
| FWONK / Formula One Group | 0,00 | −19,35 | 0,34 | −19,25 | 0,4871 | −0,0733 | |||
| SHW / The Sherwin-Williams Company | 0,00 | −24,67 | 0,34 | −25,38 | 0,4863 | −0,1190 | |||
| LYV / Live Nation Entertainment, Inc. | 0,00 | −19,25 | 0,33 | −22,62 | 0,4595 | −0,0927 | |||
| BSX / Boston Scientific Corporation | 0,00 | −16,21 | 0,32 | −14,96 | 0,4583 | −0,0426 | |||
| APH / Amphenol Corporation | 0,00 | 14,56 | 0,32 | 54,85 | 0,4510 | 0,1802 | |||
| HLT / Hilton Worldwide Holdings Inc. | 0,00 | 0,31 | 0,4396 | 0,4396 | |||||
| AXP / American Express Company | 0,00 | −19,48 | 0,31 | −21,28 | 0,4347 | −0,0784 | |||
| MNST / Monster Beverage Corporation | 0,00 | −6,38 | 0,30 | 9,35 | 0,4308 | 0,0656 | |||
| VG / Venture Global, Inc. | 0,02 | −16,56 | 0,28 | −35,96 | 0,3904 | −0,1763 | |||
| EQIX / Equinix, Inc. | 0,00 | −19,32 | 0,27 | −20,81 | 0,3881 | −0,0666 | |||
| ANET / Arista Networks Inc | 0,00 | −20,41 | 0,27 | −25,90 | 0,3810 | −0,0965 | |||
| IR / Ingersoll Rand Inc. | 0,00 | −15,99 | 0,27 | −19,03 | 0,3796 | −0,0561 | |||
| VRTX / Vertex Pharmaceuticals Incorporated | 0,00 | −17,30 | 0,26 | −23,96 | 0,3642 | −0,0797 | |||
| IBKR / Interactive Brokers Group, Inc. | 0,00 | 52,31 | 0,25 | 56,60 | 0,3520 | 0,1428 | |||
| GEV / GE Vernova Inc. | 0,00 | −10,09 | 0,23 | 26,82 | 0,3215 | 0,0862 | |||
| ARES / Ares Management Corporation | 0,00 | −33,90 | 0,23 | −36,06 | 0,3211 | −0,1448 | |||
| DKNG / DraftKings Inc. | 0,01 | −5,57 | 0,23 | −22,95 | 0,3190 | −0,0645 | |||
| AMT / American Tower Corporation | 0,00 | 0,22 | 0,3176 | 0,3176 | |||||
| PTC / PTC Inc. | 0,00 | −20,49 | 0,22 | −18,49 | 0,3064 | −0,0415 | |||
| PLTR / Palantir Technologies Inc. | 0,00 | 4,07 | 0,21 | 61,83 | 0,2998 | 0,1274 | |||
| KKR / KKR & Co. Inc. | 0,00 | −19,43 | 0,21 | −28,08 | 0,2981 | −0,0855 | |||
| EW / Edwards Lifesciences Corporation | 0,00 | −20,21 | 0,21 | −12,86 | 0,2968 | −0,0195 | |||
| WFC / Wells Fargo & Company | 0,00 | 2,69 | 0,20 | −1,97 | 0,2822 | 0,0149 | |||
| RSG / Republic Services, Inc. | 0,00 | −57,70 | 0,19 | −47,75 | 0,2636 | −0,2495 | |||
| BJ / BJ's Wholesale Club Holdings, Inc. | 0,00 | 0,18 | 0,2558 | 0,2558 | |||||
| IT / Gartner, Inc. | 0,00 | −49,20 | 0,18 | −55,58 | 0,2535 | −0,2756 | |||
| COHR / Coherent Corp. | 0,00 | −18,88 | 0,18 | −18,72 | 0,2526 | −0,0349 | |||
| HUBS / HubSpot, Inc. | 0,00 | −14,16 | 0,17 | −30,20 | 0,2426 | −0,0795 | |||
| UNH / UnitedHealth Group Incorporated | 0,00 | −16,77 | 0,16 | −47,19 | 0,2266 | −0,1711 | |||
| 1LINUS / Linde plc | 0,00 | 0,15 | 0,2055 | 0,2055 | |||||
| FTAI / FTAI Aviation Ltd. | 0,00 | −19,18 | 0,14 | −26,49 | 0,1925 | −0,0505 | |||
| EMR / Emerson Electric Co. | 0,00 | −21,13 | 0,12 | −22,82 | 0,1631 | −0,0325 | |||
| BLDR / Builders FirstSource, Inc. | 0,00 | −35,95 | 0,11 | −50,44 | 0,1602 | −0,1396 | |||
| FANG / Diamondback Energy, Inc. | 0,00 | −19,26 | 0,08 | −31,93 | 0,1156 | −0,0415 | |||
| VRT / Vertiv Holdings Co | 0,00 | −100,00 | 0,00 | −100,00 | −0,2502 |