Grunnleggende statistikk
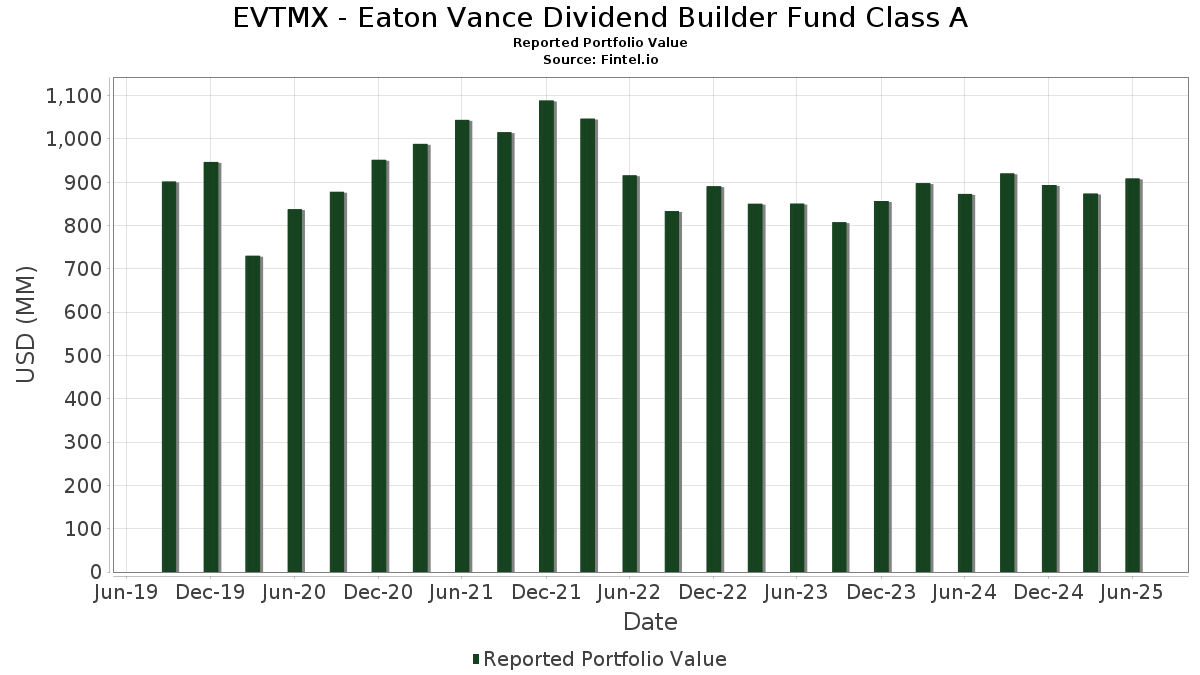
| Porteføljeverdi | $ 908 515 079 |
| Nåværende posisjoner | 57 |
Siste beholdninger, prestasjoner, forvaltet kapital (fra 13F, 13D)
EVTMX - Eaton Vance Dividend Builder Fund Class A har oppgitt 57 totale beholdninger i sine siste SEC-arkiveringer. Siste porteføljeverdi er beregnet til 908 515 079 USD. Faktisk forvaltet kapital (AUM) er denne verdien pluss kontanter (som ikke er oppgitt). EVTMX - Eaton Vance Dividend Builder Fund Class As største beholdninger er Microsoft Corporation (US:MSFT) , Broadcom Inc. (US:AVGO) , JPMorgan Chase & Co. (US:JPM) , Chevron Corporation (US:CVX) , and Johnson & Johnson (US:JNJ) . EVTMX - Eaton Vance Dividend Builder Fund Class As nye posisjoner inkluderer The Southern Company (US:SO) , Quest Diagnostics Incorporated (IT:1QDX) , Iron Mountain Incorporated (US:IRM) , Zoetis Inc. (US:ZTS) , and .
De største økningene dette kvartalet
Vi bruker endringen i porteføljeallokeringen fordi dette er det mest meningsfulle målet. Endringer kan skyldes handler eller endringer i aksjekursene.
| Verdipapirer | Aksjer (MM) |
Verdi (MM$) |
Portefølje % | ΔPortefølje % |
|---|---|---|---|---|
| 0,18 | 16,99 | 1,8702 | 1,8702 | |
| 0,07 | 13,17 | 1,4495 | 1,4495 | |
| 0,13 | 36,30 | 3,9965 | 1,3570 | |
| 0,11 | 11,56 | 1,2726 | 1,2726 | |
| 0,01 | 10,63 | 1,1701 | 1,1701 | |
| 0,06 | 9,33 | 1,0267 | 1,0267 | |
| 0,03 | 8,61 | 0,9476 | 0,9476 | |
| 0,09 | 42,86 | 4,7184 | 0,8303 | |
| 0,05 | 18,38 | 2,0240 | 0,8133 | |
| 0,08 | 18,30 | 2,0145 | 0,6332 |
De største reduksjonene dette kvartalet
Vi bruker endringen i porteføljeallokeringen fordi dette er det mest meningsfulle målet. Endringer kan skyldes handler eller endringer i aksjekurser.
| Verdipapirer | Aksjer (MM) |
Verdi (MM$) |
Portefølje % | ΔPortefølje % |
|---|---|---|---|---|
| 0,07 | 8,81 | 0,9698 | −1,1278 | |
| 6,77 | 6,77 | 0,7454 | −0,9987 | |
| 0,08 | 14,89 | 1,6388 | −0,9110 | |
| 0,05 | 11,06 | 1,2174 | −0,7433 | |
| 0,05 | 15,85 | 1,7447 | −0,5579 | |
| 0,59 | 11,27 | 1,2405 | −0,5268 | |
| 0,06 | 6,91 | 0,7604 | −0,5199 | |
| 0,10 | 11,84 | 1,3040 | −0,4820 | |
| 0,30 | 14,18 | 1,5616 | −0,4754 | |
| 0,02 | 11,86 | 1,3061 | −0,3518 |
13F- og Fondsarkiveringer
Dette skjemaet ble sendt inn den 2025-08-25 for rapporteringsperioden 2025-06-30. Klikk på lenkeikonet for å se hele transaksjonshistorikken.
Oppgradere for å låse opp premiedata og eksportere til Excel![]() .
.
| Verdipapirer | Type | Gjennomsnittlig aksjekurs | Aksjer (MM) |
ΔAksjer (%) |
ΔAksjer (%) |
Verdi ($MM) |
Portefølje (%) |
ΔPortefølje (%) |
|
|---|---|---|---|---|---|---|---|---|---|
| MSFT / Microsoft Corporation | 0,09 | −4,75 | 42,86 | 26,21 | 4,7184 | 0,8303 | |||
| AVGO / Broadcom Inc. | 0,13 | −4,36 | 36,30 | 57,46 | 3,9965 | 1,3570 | |||
| JPM / JPMorgan Chase & Co. | 0,11 | 0,00 | 31,57 | 18,19 | 3,4756 | 0,4173 | |||
| CVX / Chevron Corporation | 0,18 | 13,82 | 25,36 | −2,58 | 2,7917 | −0,1885 | |||
| JNJ / Johnson & Johnson | 0,15 | 2,95 | 23,48 | −5,18 | 2,5846 | −0,2501 | |||
| KO / The Coca-Cola Company | 0,32 | −5,68 | 22,91 | −6,83 | 2,5220 | −0,2930 | |||
| PG / The Procter & Gamble Company | 0,13 | 0,00 | 20,73 | −6,51 | 2,2818 | −0,2565 | |||
| MMM / 3M Company | 0,13 | −4,50 | 20,03 | −1,00 | 2,2056 | −0,1113 | |||
| ICE / Intercontinental Exchange, Inc. | 0,11 | 8,20 | 19,85 | 15,08 | 2,1854 | 0,2105 | |||
| EOG / EOG Resources, Inc. | 0,16 | 0,00 | 19,66 | −6,73 | 2,1647 | −0,2490 | |||
| WMT / Walmart Inc. | 0,20 | 0,00 | 19,53 | 11,38 | 2,1496 | 0,1425 | |||
| ADP / Automatic Data Processing, Inc. | 0,06 | 0,00 | 18,94 | 0,94 | 2,0846 | −0,0632 | |||
| HD / The Home Depot, Inc. | 0,05 | 8,40 | 18,92 | 8,45 | 2,0827 | 0,0855 | |||
| LRCX / Lam Research Corporation | 0,19 | 0,00 | 18,57 | 33,89 | 2,0446 | 0,4565 | |||
| ETN / Eaton Corporation plc | 0,05 | 32,39 | 18,38 | 73,86 | 2,0240 | 0,8133 | |||
| ORCL / Oracle Corporation | 0,08 | −3,01 | 18,30 | 51,67 | 2,0145 | 0,6332 | |||
| SRE / Sempra | 0,24 | 16,00 | 18,13 | 23,16 | 1,9961 | 0,3106 | |||
| FIS / Fidelity National Information Services, Inc. | 0,22 | 0,00 | 18,02 | 9,02 | 1,9833 | 0,0912 | |||
| ABT / Abbott Laboratories | 0,13 | 0,00 | 17,89 | 2,53 | 1,9689 | −0,0281 | |||
| CME / CME Group Inc. | 0,06 | 18,37 | 17,58 | 22,97 | 1,9358 | 0,2988 | |||
| SO / The Southern Company | 0,18 | 16,99 | 1,8702 | 1,8702 | |||||
| APH / Amphenol Corporation | 0,16 | −9,97 | 16,06 | 35,55 | 1,7676 | 0,4115 | |||
| FNF / Fidelity National Financial, Inc. | 0,29 | 4,80 | 16,02 | −9,73 | 1,7638 | −0,2680 | |||
| UNH / UnitedHealth Group Incorporated | 0,05 | 32,29 | 15,85 | −21,20 | 1,7447 | −0,5579 | |||
| LHX / L3Harris Technologies, Inc. | 0,06 | 5,13 | 15,43 | 25,99 | 1,6983 | 0,2964 | |||
| BLK / BlackRock, Inc. | 0,01 | 0,00 | 15,32 | 10,86 | 1,6864 | 0,1044 | |||
| BR / Broadridge Financial Solutions, Inc. | 0,06 | 12,30 | 15,31 | 12,56 | 1,6855 | 0,1283 | |||
| ABBV / AbbVie Inc. | 0,08 | −24,55 | 14,89 | −33,16 | 1,6388 | −0,9110 | |||
| ADI / Analog Devices, Inc. | 0,06 | 0,00 | 14,83 | 18,02 | 1,6324 | 0,1940 | |||
| CMCSA / Comcast Corporation | 0,41 | 22,86 | 14,48 | 18,83 | 1,5944 | 0,1990 | |||
| QCOM / QUALCOMM Incorporated | 0,09 | 0,00 | 14,48 | 3,67 | 1,5937 | −0,0049 | |||
| BKNG / Booking Holdings Inc. | 0,00 | 0,00 | 14,47 | 25,67 | 1,5933 | 0,2747 | |||
| ALL / The Allstate Corporation | 0,07 | 0,00 | 14,45 | −2,78 | 1,5912 | −0,1110 | |||
| TXN / Texas Instruments Incorporated | 0,07 | 27,24 | 14,45 | 47,01 | 1,5908 | 0,4654 | |||
| IP / International Paper Company | 0,30 | −9,18 | 14,18 | −20,28 | 1,5616 | −0,4754 | |||
| AJG / Arthur J. Gallagher & Co. | 0,04 | 0,00 | 13,67 | −7,27 | 1,5048 | −0,1830 | |||
| TFC / Truist Financial Corporation | 0,32 | 0,00 | 13,60 | 4,48 | 1,4974 | 0,0068 | |||
| 1QDX / Quest Diagnostics Incorporated | 0,07 | 13,17 | 1,4495 | 1,4495 | |||||
| BAH / Booz Allen Hamilton Holding Corporation | 0,12 | 50,73 | 12,93 | 50,08 | 1,4238 | 0,4372 | |||
| WM / Waste Management, Inc. | 0,06 | 10,84 | 12,63 | 9,55 | 1,3905 | 0,0705 | |||
| CARR / Carrier Global Corporation | 0,17 | 8,78 | 12,24 | 25,58 | 1,3472 | 0,2315 | |||
| SPGI / S&P Global Inc. | 0,02 | −21,05 | 11,86 | −18,07 | 1,3061 | −0,3518 | |||
| LAMR / Lamar Advertising Company | 0,10 | −28,81 | 11,84 | −24,07 | 1,3040 | −0,4820 | |||
| AME / AMETEK, Inc. | 0,06 | 18,53 | 11,69 | 24,61 | 1,2869 | 0,2128 | |||
| IRM / Iron Mountain Incorporated | 0,11 | 11,56 | 1,2726 | 1,2726 | |||||
| OWL / Blue Owl Capital Inc. | 0,59 | −23,85 | 11,27 | −27,00 | 1,2405 | −0,5268 | |||
| AAPL / Apple Inc. | 0,05 | −30,09 | 11,06 | −35,43 | 1,2174 | −0,7433 | |||
| META / Meta Platforms, Inc. | 0,01 | 10,63 | 1,1701 | 1,1701 | |||||
| EQT / EQT Corporation | 0,18 | 0,00 | 10,60 | 9,15 | 1,1666 | 0,0551 | |||
| FAST / Fastenal Company | 0,23 | 55,46 | 9,50 | −15,80 | 1,0459 | −0,2460 | |||
| ZTS / Zoetis Inc. | 0,06 | 9,33 | 1,0267 | 1,0267 | |||||
| AFG / American Financial Group, Inc. | 0,07 | −49,96 | 8,81 | −51,92 | 0,9698 | −1,1278 | |||
| ACN / Accenture plc | 0,03 | 8,61 | 0,9476 | 0,9476 | |||||
| BBWI / Bath & Body Works, Inc. | 0,28 | 42,14 | 8,54 | 40,45 | 0,9400 | 0,2440 | |||
| NYT / The New York Times Company | 0,13 | 0,00 | 7,08 | 12,86 | 0,7796 | 0,0612 | |||
| GILD / Gilead Sciences, Inc. | 0,06 | −37,58 | 6,91 | −38,23 | 0,7604 | −0,5199 | |||
| US61747C7074 / Morgan Stanley Institutional Liquidity Funds Government Portfolio, Institutional Class | 6,77 | −55,55 | 6,77 | −55,55 | 0,7454 | −0,9987 |