Grunnleggende statistikk
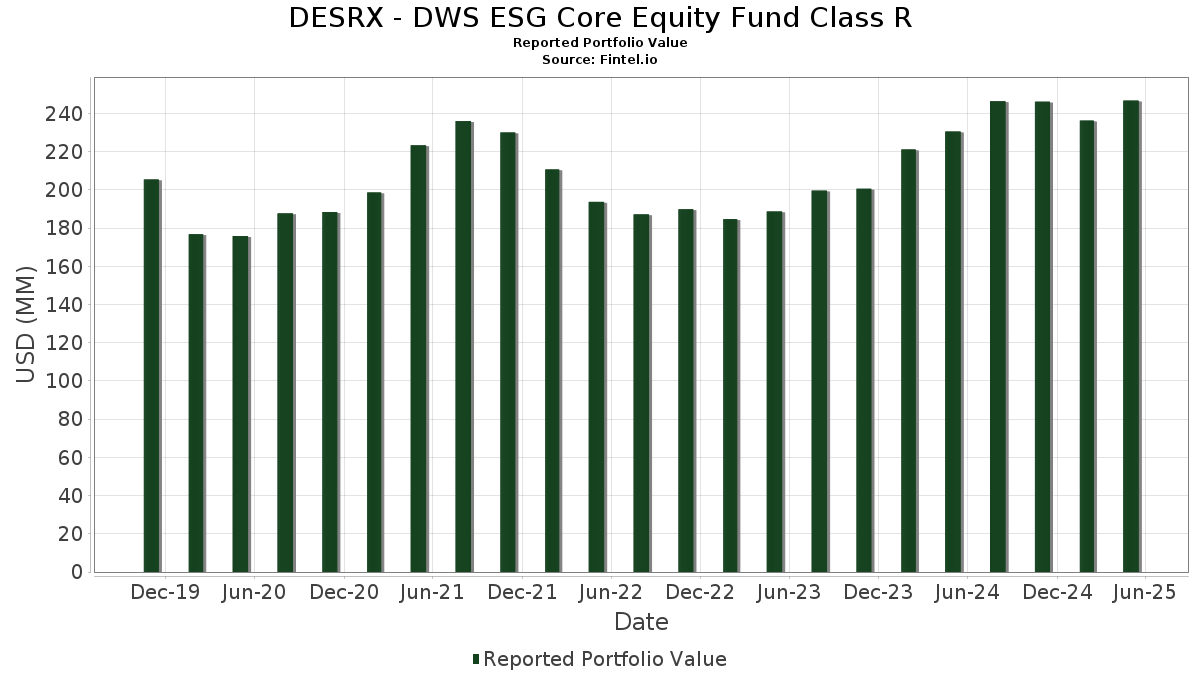
| Porteføljeverdi | $ 246 811 444 |
| Nåværende posisjoner | 89 |
Siste beholdninger, prestasjoner, forvaltet kapital (fra 13F, 13D)
DESRX - DWS ESG Core Equity Fund Class R har oppgitt 89 totale beholdninger i sine siste SEC-arkiveringer. Siste porteføljeverdi er beregnet til 246 811 444 USD. Faktisk forvaltet kapital (AUM) er denne verdien pluss kontanter (som ikke er oppgitt). DESRX - DWS ESG Core Equity Fund Class Rs største beholdninger er Microsoft Corporation (US:MSFT) , Apple Inc. (US:AAPL) , Alphabet Inc. (US:GOOGL) , DWS Central Cash Management Government Fund (US:US25160K3068) , and NVIDIA Corporation (US:NVDA) . DESRX - DWS ESG Core Equity Fund Class Rs nye posisjoner inkluderer Veeva Systems Inc. (US:VEEV) , Cboe Global Markets, Inc. (US:CBOE) , .
De største økningene dette kvartalet
Vi bruker endringen i porteføljeallokeringen fordi dette er det mest meningsfulle målet. Endringer kan skyldes handler eller endringer i aksjekursene.
| Verdipapirer | Aksjer (MM) |
Verdi (MM$) |
Portefølje % | ΔPortefølje % |
|---|---|---|---|---|
| 14,70 | 14,70 | 5,9656 | 5,6397 | |
| 0,00 | 1,35 | 0,5464 | 0,5464 | |
| 0,05 | 22,75 | 9,2334 | 0,5164 | |
| 0,01 | 1,18 | 0,4776 | 0,4776 | |
| 0,02 | 6,11 | 2,4815 | 0,3762 | |
| 0,02 | 3,51 | 1,4266 | 0,3006 | |
| 0,02 | 3,85 | 1,5649 | 0,2966 | |
| 0,01 | 4,34 | 1,7599 | 0,1427 | |
| 0,01 | 1,85 | 0,7523 | 0,1276 | |
| 0,02 | 0,94 | 0,3819 | 0,0691 |
De største reduksjonene dette kvartalet
Vi bruker endringen i porteføljeallokeringen fordi dette er det mest meningsfulle målet. Endringer kan skyldes handler eller endringer i aksjekurser.
| Verdipapirer | Aksjer (MM) |
Verdi (MM$) |
Portefølje % | ΔPortefølje % |
|---|---|---|---|---|
| 0,09 | 18,86 | 7,6549 | −2,0897 | |
| 0,56 | 0,56 | 0,2253 | −1,3738 | |
| 0,02 | 2,35 | 0,9527 | −0,5842 | |
| 0,02 | 1,06 | 0,4322 | −0,4381 | |
| 0,01 | 1,60 | 0,6485 | −0,3265 | |
| 0,09 | 15,30 | 6,2112 | −0,2996 | |
| 0,10 | 12,89 | 5,2310 | −0,2526 | |
| 0,08 | 0,20 | 0,0811 | −0,2472 | |
| 0,01 | 1,20 | 0,4891 | −0,2279 | |
| 0,02 | 3,11 | 1,2630 | −0,2233 |
13F- og Fondsarkiveringer
Dette skjemaet ble sendt inn den 2025-07-24 for rapporteringsperioden 2025-05-31. Klikk på lenkeikonet for å se hele transaksjonshistorikken.
Oppgradere for å låse opp premiedata og eksportere til Excel![]() .
.
| Verdipapirer | Type | Gjennomsnittlig aksjekurs | Aksjer (MM) |
ΔAksjer (%) |
ΔAksjer (%) |
Verdi ($MM) |
Portefølje (%) |
ΔPortefølje (%) |
|
|---|---|---|---|---|---|---|---|---|---|
| MSFT / Microsoft Corporation | 0,05 | −3,43 | 22,75 | 11,99 | 9,2334 | 0,5164 | |||
| AAPL / Apple Inc. | 0,09 | 0,00 | 18,86 | −16,95 | 7,6549 | −2,0897 | |||
| GOOGL / Alphabet Inc. | 0,09 | 0,00 | 15,30 | 0,86 | 6,2112 | −0,2996 | |||
| US25160K3068 / DWS Central Cash Management Government Fund | 14,70 | 1 835,04 | 14,70 | 1 836,10 | 5,9656 | 5,6397 | |||
| NVDA / NVIDIA Corporation | 0,10 | −6,77 | 12,89 | 0,85 | 5,2310 | −0,2526 | |||
| GE / General Electric Company | 0,02 | 4,89 | 6,11 | 24,61 | 2,4815 | 0,3762 | |||
| CI / The Cigna Group | 0,02 | 4,89 | 5,54 | 7,54 | 2,2481 | 0,0379 | |||
| BAC / Bank of America Corporation | 0,13 | 4,89 | 5,52 | 0,40 | 2,2406 | −0,1187 | |||
| AMGN / Amgen Inc. | 0,02 | 4,89 | 4,53 | −1,89 | 1,8380 | −0,1424 | |||
| TSLA / Tesla, Inc. | 0,01 | −2,71 | 4,34 | 15,05 | 1,7599 | 0,1427 | |||
| AXP / American Express Company | 0,01 | 4,88 | 4,32 | 2,49 | 1,7533 | −0,0555 | |||
| GS / The Goldman Sachs Group, Inc. | 0,01 | 4,89 | 4,07 | 1,22 | 1,6531 | −0,0738 | |||
| HWM / Howmet Aerospace Inc. | 0,02 | 4,89 | 3,85 | 30,42 | 1,5649 | 0,2966 | |||
| CRM / Salesforce, Inc. | 0,01 | 4,89 | 3,71 | −6,54 | 1,5079 | −0,1981 | |||
| C / Citigroup Inc. | 0,05 | 4,89 | 3,64 | −1,19 | 1,4784 | −0,1034 | |||
| AMZN / Amazon.com, Inc. | 0,02 | 38,69 | 3,51 | 33,97 | 1,4266 | 0,3006 | |||
| AWK / American Water Works Company, Inc. | 0,02 | 4,89 | 3,43 | 10,30 | 1,3917 | 0,0576 | |||
| JPM / JPMorgan Chase & Co. | 0,01 | 4,89 | 3,19 | 4,62 | 1,2968 | −0,0135 | |||
| PEP / PepsiCo, Inc. | 0,02 | 4,89 | 3,11 | −10,16 | 1,2630 | −0,2233 | |||
| DIS / The Walt Disney Company | 0,03 | 4,89 | 3,07 | 4,21 | 1,2468 | −0,0184 | |||
| IRM / Iron Mountain Incorporated | 0,03 | 4,89 | 2,96 | 11,14 | 1,2036 | 0,0585 | |||
| VRSK / Verisk Analytics, Inc. | 0,01 | 4,89 | 2,95 | 11,00 | 1,1961 | 0,0566 | |||
| CSCO / Cisco Systems, Inc. | 0,05 | 4,89 | 2,93 | 3,13 | 1,1892 | −0,0298 | |||
| RSG / Republic Services, Inc. | 0,01 | −14,89 | 2,81 | −7,61 | 1,1394 | −0,1644 | |||
| PHM / PulteGroup, Inc. | 0,03 | 4,89 | 2,59 | −0,46 | 1,0501 | −0,0650 | |||
| H / Hyatt Hotels Corporation | 0,02 | 4,89 | 2,44 | −1,73 | 0,9893 | −0,0752 | |||
| TW / Tradeweb Markets Inc. | 0,02 | 4,89 | 2,43 | 11,91 | 0,9880 | 0,0547 | |||
| KKR / KKR & Co. Inc. | 0,02 | −26,84 | 2,35 | −34,47 | 0,9527 | −0,5842 | |||
| HLT / Hilton Worldwide Holdings Inc. | 0,01 | 4,89 | 2,32 | −1,65 | 0,9413 | −0,0706 | |||
| VRTX / Vertex Pharmaceuticals Incorporated | 0,01 | 4,90 | 2,29 | −3,33 | 0,9305 | −0,0874 | |||
| LOW / Lowe's Companies, Inc. | 0,01 | 4,89 | 2,18 | −4,80 | 0,8861 | −0,0977 | |||
| MU / Micron Technology, Inc. | 0,02 | 4,89 | 2,18 | 5,83 | 0,8852 | 0,0008 | |||
| TJX / The TJX Companies, Inc. | 0,02 | 4,89 | 2,08 | 6,68 | 0,8424 | 0,0076 | |||
| DD / DuPont de Nemours, Inc. | 0,03 | 4,89 | 2,06 | −14,34 | 0,8345 | −0,1951 | |||
| HIG / The Hartford Insurance Group, Inc. | 0,02 | 4,88 | 2,01 | 15,10 | 0,8171 | 0,0668 | |||
| MSCI / MSCI Inc. | 0,00 | 4,88 | 2,01 | 0,20 | 0,8170 | −0,0452 | |||
| AMP / Ameriprise Financial, Inc. | 0,00 | 4,90 | 1,94 | −0,56 | 0,7880 | −0,0500 | |||
| WCC / WESCO International, Inc. | 0,01 | 4,89 | 1,86 | −2,42 | 0,7545 | −0,0630 | |||
| AVGO / Broadcom Inc. | 0,01 | 4,89 | 1,85 | 27,35 | 0,7523 | 0,1276 | |||
| FTI / TechnipFMC plc | 0,06 | 4,89 | 1,76 | 10,96 | 0,7157 | 0,0339 | |||
| AMD / Advanced Micro Devices, Inc. | 0,02 | 4,89 | 1,71 | 16,32 | 0,6949 | 0,0632 | |||
| BALL / Ball Corporation | 0,03 | 4,89 | 1,71 | 6,68 | 0,6940 | 0,0061 | |||
| DLR / Digital Realty Trust, Inc. | 0,01 | 4,89 | 1,69 | 15,09 | 0,6873 | 0,0559 | |||
| ORCL / Oracle Corporation | 0,01 | 4,88 | 1,68 | 4,54 | 0,6826 | −0,0077 | |||
| OC / Owens Corning | 0,01 | 4,88 | 1,63 | −8,80 | 0,6610 | −0,1052 | |||
| HCA / HCA Healthcare, Inc. | 0,00 | −31,09 | 1,62 | −14,22 | 0,6568 | −0,1525 | |||
| SLB / Schlumberger Limited | 0,05 | 4,89 | 1,60 | −16,78 | 0,6485 | −0,1755 | |||
| ABBV / AbbVie Inc. | 0,01 | −21,03 | 1,60 | −29,68 | 0,6485 | −0,3265 | |||
| PYPL / PayPal Holdings, Inc. | 0,02 | 4,89 | 1,53 | 3,73 | 0,6210 | −0,0118 | |||
| LNG / Cheniere Energy, Inc. | 0,01 | 4,89 | 1,48 | 8,80 | 0,6026 | 0,0168 | |||
| BBY / Best Buy Co., Inc. | 0,02 | 4,89 | 1,46 | −22,71 | 0,5919 | −0,2174 | |||
| PFGC / Performance Food Group Company | 0,02 | 4,89 | 1,45 | 10,30 | 0,5873 | 0,0246 | |||
| TPR / Tapestry, Inc. | 0,02 | 4,89 | 1,45 | −3,54 | 0,5871 | −0,0564 | |||
| COST / Costco Wholesale Corporation | 0,00 | 4,92 | 1,42 | 4,03 | 0,5764 | −0,0091 | |||
| ATO / Atmos Energy Corporation | 0,01 | 4,89 | 1,42 | 6,69 | 0,5763 | 0,0050 | |||
| CINF / Cincinnati Financial Corporation | 0,01 | 4,89 | 1,41 | 7,06 | 0,5730 | 0,0070 | |||
| VEEV / Veeva Systems Inc. | 0,00 | 1,35 | 0,5464 | 0,5464 | |||||
| MRK / Merck & Co., Inc. | 0,02 | 4,88 | 1,30 | −12,65 | 0,5271 | −0,1108 | |||
| MA / Mastercard Incorporated | 0,00 | 4,87 | 1,30 | 6,57 | 0,5270 | 0,0042 | |||
| META / Meta Platforms, Inc. | 0,00 | −69,87 | 1,24 | 19,85 | 0,5026 | −0,0527 | |||
| HUM / Humana Inc. | 0,01 | 4,89 | 1,22 | −9,60 | 0,4971 | −0,0841 | |||
| MTCH / Match Group, Inc. | 0,04 | 4,89 | 1,22 | −0,97 | 0,4963 | −0,0335 | |||
| TGT / Target Corporation | 0,01 | 4,89 | 1,22 | −20,68 | 0,4956 | −0,1646 | |||
| LRCX / Lam Research Corporation | 0,01 | −31,49 | 1,20 | −27,90 | 0,4891 | −0,2279 | |||
| UPS / United Parcel Service, Inc. | 0,01 | 4,89 | 1,20 | −14,07 | 0,4860 | −0,1118 | |||
| CBOE / Cboe Global Markets, Inc. | 0,01 | 1,18 | 0,4776 | 0,4776 | |||||
| WMT / Walmart Inc. | 0,01 | 85,78 | 1,13 | 17,76 | 0,4577 | −0,0191 | |||
| DE / Deere & Company | 0,00 | 4,91 | 1,13 | 10,51 | 0,4569 | 0,0196 | |||
| BMY / Bristol-Myers Squibb Company | 0,02 | 4,89 | 1,10 | −15,10 | 0,4453 | −0,1090 | |||
| ZM / Zoom Communications Inc. | 0,01 | 4,89 | 1,09 | 15,65 | 0,4412 | 0,0378 | |||
| CNC / Centene Corporation | 0,02 | −45,90 | 1,06 | −47,51 | 0,4322 | −0,4381 | |||
| LEA / Lear Corporation | 0,01 | 4,88 | 1,06 | 0,95 | 0,4296 | −0,0205 | |||
| BKR / Baker Hughes Company | 0,03 | 4,89 | 1,04 | −12,85 | 0,4241 | −0,0904 | |||
| KDP / Keurig Dr Pepper Inc. | 0,03 | 4,89 | 1,00 | 5,39 | 0,4053 | −0,0014 | |||
| REGN / Regeneron Pharmaceuticals, Inc. | 0,00 | 4,89 | 1,00 | −26,40 | 0,4052 | −0,1769 | |||
| TAP / Molson Coors Beverage Company | 0,02 | 4,89 | 0,97 | −8,29 | 0,3951 | −0,0604 | |||
| NEM / Newmont Corporation | 0,02 | 4,89 | 0,94 | 29,12 | 0,3819 | 0,0691 | |||
| HOLX / Hologic, Inc. | 0,01 | 0,00 | 0,86 | −1,94 | 0,3485 | −0,0272 | |||
| EL / The Estée Lauder Companies Inc. | 0,01 | 4,89 | 0,83 | −2,35 | 0,3380 | −0,0280 | |||
| BIIB / Biogen Inc. | 0,01 | 4,89 | 0,80 | −3,15 | 0,3247 | −0,0296 | |||
| SWKS / Skyworks Solutions, Inc. | 0,01 | 4,88 | 0,76 | 8,57 | 0,3087 | 0,0082 | |||
| BC / Brunswick Corporation | 0,01 | 4,89 | 0,64 | −12,74 | 0,2615 | −0,0554 | |||
| RNG / RingCentral, Inc. | 0,02 | 4,89 | 0,56 | −4,43 | 0,2280 | −0,0242 | |||
| US1475396701 / DWS Gov&Agency Sec Portfolio DWS Gov Cash Inst Shs | 0,56 | −85,10 | 0,56 | −85,10 | 0,2253 | −1,3738 | |||
| MPW / Medical Properties Trust, Inc. | 0,07 | 4,89 | 0,32 | −18,73 | 0,1303 | −0,0393 | |||
| NFE / New Fortress Energy Inc. | 0,08 | 4,89 | 0,20 | −73,99 | 0,0811 | −0,2472 | |||
| CHPT / ChargePoint Holdings, Inc. | 0,06 | 4,89 | 0,04 | 8,57 | 0,0158 | 0,0006 | |||
| S+P500 EMINI OPTN JUN25P 5300 / DE (000000000) | 0,01 | 0,0025 | 0,0025 | ||||||
| S+P500 EMINI OPTN JUN25P 5100 / DE (000000000) | 0,00 | 0,0014 | 0,0014 |