Grunnleggende statistikk
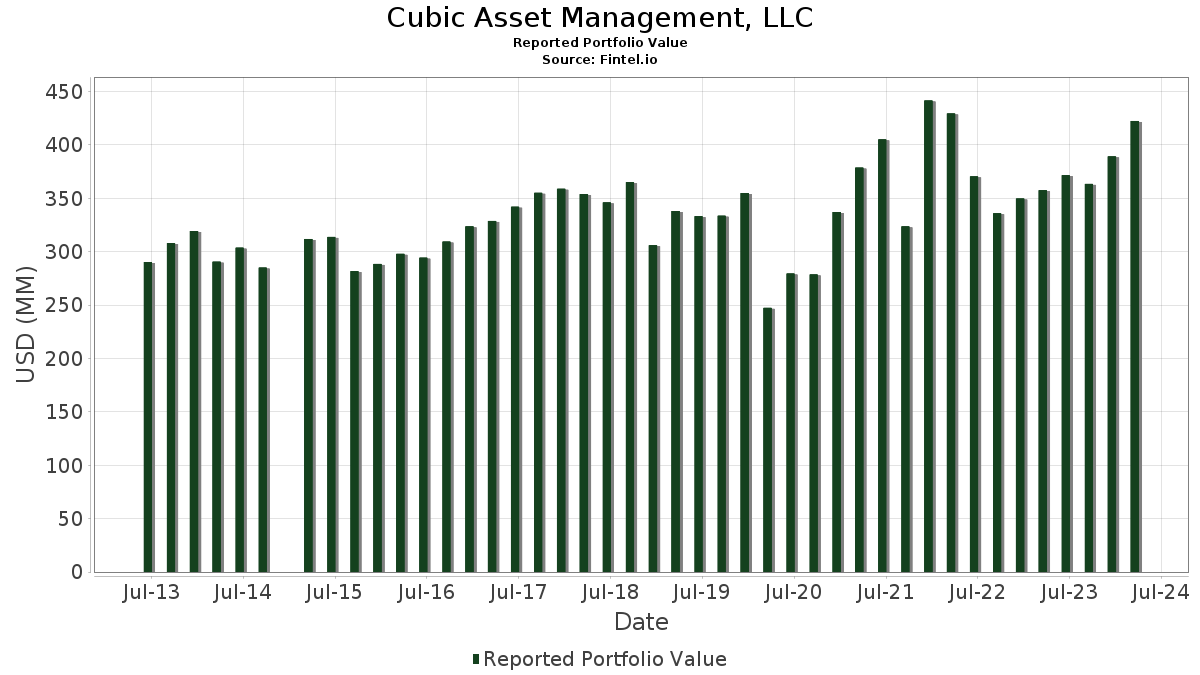
| Porteføljeverdi | $ 422 443 842 |
| Nåværende posisjoner | 202 |
Siste beholdninger, prestasjoner, forvaltet kapital (fra 13F, 13D)
Cubic Asset Management, LLC har oppgitt 202 totale beholdninger i sine siste SEC-arkiveringer. Siste porteføljeverdi er beregnet til 422 443 842 USD. Faktisk forvaltet kapital (AUM) er denne verdien pluss kontanter (som ikke er oppgitt). Cubic Asset Management, LLCs største beholdninger er Microsoft Corporation (US:MSFT) , Meta Platforms, Inc. (US:META) , Alphabet Inc. (US:GOOG) , The PNC Financial Services Group, Inc. (US:PNC) , and Berkshire Hathaway Inc. (US:BRK.B) . Cubic Asset Management, LLCs nye posisjoner inkluderer Lincoln National Corporation (US:LNC) , LSI Industries Inc. (US:LYTS) , Canadian Pacific Kansas City Limited (US:CP) , .
De største økningene dette kvartalet
Vi bruker endringen i porteføljeallokeringen fordi dette er det mest meningsfulle målet. Endringer kan skyldes handler eller endringer i aksjekursene.
| Verdipapirer | Aksjer (MM) |
Verdi (MM$) |
Portefølje % | ΔPortefølje % |
|---|---|---|---|---|
| 0,04 | 17,29 | 4,0921 | 0,8479 | |
| 0,10 | 3,31 | 0,7841 | 0,7841 | |
| 0,00 | 3,81 | 0,9026 | 0,3657 | |
| 0,06 | 10,19 | 2,4112 | 0,2954 | |
| 0,04 | 5,30 | 1,2534 | 0,2452 | |
| 0,03 | 10,89 | 2,5770 | 0,2027 | |
| 0,03 | 5,58 | 1,3201 | 0,1941 | |
| 0,11 | 6,64 | 1,5720 | 0,1782 | |
| 0,04 | 8,07 | 1,9098 | 0,1720 | |
| 0,06 | 25,37 | 6,0052 | 0,1701 |
De største reduksjonene dette kvartalet
Vi bruker endringen i porteføljeallokeringen fordi dette er det mest meningsfulle målet. Endringer kan skyldes handler eller endringer i aksjekurser.
| Verdipapirer | Aksjer (MM) |
Verdi (MM$) |
Portefølje % | ΔPortefølje % |
|---|---|---|---|---|
| 0,12 | 5,26 | 1,2447 | −0,3230 | |
| 0,01 | 5,88 | 1,3916 | −0,2593 | |
| 0,07 | 1,40 | 0,3315 | −0,1671 | |
| 0,02 | 4,96 | 1,1729 | −0,1546 | |
| 0,09 | 7,93 | 1,8778 | −0,1271 | |
| 0,01 | 2,24 | 0,5300 | −0,1159 | |
| 0,08 | 12,78 | 3,0242 | −0,1077 | |
| 0,04 | 5,70 | 1,3501 | −0,1020 | |
| 0,16 | 4,40 | 1,0406 | −0,0968 | |
| 0,04 | 3,50 | 0,8278 | −0,0967 |
13F- og Fondsarkiveringer
Dette skjemaet ble sendt inn den 2024-04-24 for rapporteringsperioden 2024-03-31. Klikk på lenkeikonet for å se hele transaksjonshistorikken.
Oppgradere for å låse opp premiedata og eksportere til Excel![]() .
.
| Verdipapirer | Type | Gjennomsnittlig aksjekurs | Aksjer (MM) |
ΔAksjer (%) |
ΔAksjer (%) |
Verdi ($MM) |
Portefølje (%) |
ΔPortefølje (%) |
|
|---|---|---|---|---|---|---|---|---|---|
| MSFT / Microsoft Corporation | 0,06 | −0,16 | 25,37 | 11,70 | 6,0052 | 0,1701 | |||
| META / Meta Platforms, Inc. | 0,04 | −0,21 | 17,29 | 36,90 | 4,0921 | 0,8479 | |||
| GOOG / Alphabet Inc. | 0,09 | −0,57 | 13,94 | 7,42 | 3,2996 | −0,0340 | |||
| PNC / The PNC Financial Services Group, Inc. | 0,08 | 0,43 | 12,78 | 4,80 | 3,0242 | −0,1077 | |||
| BRK.B / Berkshire Hathaway Inc. | 0,03 | −0,09 | 10,89 | 17,80 | 2,5770 | 0,2027 | |||
| ALL / The Allstate Corporation | 0,06 | 0,07 | 10,19 | 23,68 | 2,4112 | 0,2954 | |||
| AXP / American Express Company | 0,04 | −1,86 | 8,07 | 19,28 | 1,9098 | 0,1720 | |||
| AFL / Aflac Incorporated | 0,09 | −2,33 | 7,93 | 1,65 | 1,8778 | −0,1271 | |||
| FDX / FedEx Corporation | 0,03 | 0,39 | 7,81 | 14,98 | 1,8496 | 0,1037 | |||
| LOW / Lowe's Companies, Inc. | 0,03 | 0,00 | 7,57 | 14,47 | 1,7922 | 0,0928 | |||
| LKQ / LKQ Corporation | 0,14 | 3,47 | 7,56 | 15,62 | 1,7888 | 0,1098 | |||
| ABBV / AbbVie Inc. | 0,04 | −0,18 | 7,23 | 17,30 | 1,7108 | 0,1278 | |||
| GS / The Goldman Sachs Group, Inc. | 0,02 | 0,00 | 7,13 | 8,27 | 1,6887 | −0,0041 | |||
| AMZN / Amazon.com, Inc. | 0,04 | 0,01 | 7,09 | 18,73 | 1,6795 | 0,1442 | |||
| OMC / Omnicom Group Inc. | 0,07 | 0,76 | 7,01 | 12,71 | 1,6603 | 0,0613 | |||
| MA / Mastercard Incorporated | 0,01 | 0,00 | 6,71 | 12,91 | 1,5883 | 0,0615 | |||
| C / Citigroup Inc. | 0,11 | −0,43 | 6,64 | 22,42 | 1,5720 | 0,1782 | |||
| CVS / CVS Health Corporation | 0,08 | 1,08 | 6,22 | 2,12 | 1,4734 | −0,0928 | |||
| UNH / UnitedHealth Group Incorporated | 0,01 | −2,64 | 5,88 | −8,51 | 1,3916 | −0,2593 | |||
| JNJ / Johnson & Johnson | 0,04 | −0,01 | 5,70 | 0,90 | 1,3501 | −0,1020 | |||
| DAL / Delta Air Lines, Inc. | 0,12 | 0,36 | 5,66 | 19,43 | 1,3401 | 0,1221 | |||
| AMAT / Applied Materials, Inc. | 0,03 | 0,00 | 5,58 | 27,25 | 1,3201 | 0,1941 | |||
| GPC / Genuine Parts Company | 0,04 | −0,36 | 5,55 | 11,47 | 1,3133 | 0,0344 | |||
| DIS / The Walt Disney Company | 0,04 | −0,44 | 5,30 | 34,94 | 1,2534 | 0,2452 | |||
| INTC / Intel Corporation | 0,12 | −1,97 | 5,26 | −13,82 | 1,2447 | −0,3230 | |||
| GPI / Group 1 Automotive, Inc. | 0,02 | 0,00 | 4,96 | −4,10 | 1,1729 | −0,1546 | |||
| CI / The Cigna Group | 0,01 | 2,58 | 4,67 | 24,41 | 1,1066 | 0,1413 | |||
| PFE / Pfizer Inc. | 0,16 | 3,02 | 4,40 | −0,72 | 1,0406 | −0,0968 | |||
| ADI / Analog Devices, Inc. | 0,02 | −0,35 | 4,22 | −0,73 | 0,9980 | −0,0932 | |||
| CSCO / Cisco Systems, Inc. | 0,08 | 4,04 | 3,86 | 2,79 | 0,9148 | −0,0512 | |||
| NVDA / NVIDIA Corporation | 0,00 | 0,00 | 3,81 | 82,53 | 0,9026 | 0,3657 | |||
| KMB / Kimberly-Clark Corporation | 0,03 | 2,53 | 3,70 | 9,14 | 0,8759 | 0,0049 | |||
| GNRC / Generac Holdings Inc. | 0,03 | 4,39 | 3,59 | 1,87 | 0,8495 | −0,0555 | |||
| V / Visa Inc. | 0,01 | 0,17 | 3,57 | 7,39 | 0,8458 | −0,0091 | |||
| SPY / SPDR S&P 500 ETF | 0,01 | 0,15 | 3,56 | 10,22 | 0,8428 | 0,0128 | |||
| TTD / The Trade Desk, Inc. | 0,04 | −20,00 | 3,50 | −2,83 | 0,8278 | −0,0967 | |||
| LNC / Lincoln National Corporation | 0,10 | 3,31 | 0,7841 | 0,7841 | |||||
| MRK / Merck & Co., Inc. | 0,03 | −0,20 | 3,31 | 20,80 | 0,7838 | 0,0795 | |||
| RTX / RTX Corporation | 0,03 | 2,10 | 3,21 | 18,32 | 0,7601 | 0,0630 | |||
| TEL / TE Connectivity plc | 0,02 | −0,47 | 3,20 | 2,89 | 0,7576 | −0,0416 | |||
| CMCSA / Comcast Corporation | 0,07 | −0,12 | 3,11 | −1,27 | 0,7363 | −0,0730 | |||
| ARCC / Ares Capital Corporation | 0,15 | 0,03 | 3,10 | 3,99 | 0,7349 | −0,0322 | |||
| DOW / Dow Inc. | 0,05 | 0,22 | 3,01 | 5,87 | 0,7126 | −0,0179 | |||
| MHO / M/I Homes, Inc. | 0,02 | 0,00 | 3,00 | −1,02 | 0,7099 | −0,0688 | |||
| SU / Suncor Energy Inc. | 0,07 | −0,62 | 2,65 | 14,52 | 0,6274 | 0,0326 | |||
| NEE.PRN / NextEra Energy Capital Holdings, Inc. - Corporate Bond/Note | 0,04 | 5,53 | 2,63 | 11,01 | 0,6232 | 0,0141 | |||
| VZ / Verizon Communications Inc. | 0,06 | −0,65 | 2,63 | 10,57 | 0,6216 | 0,0115 | |||
| BK / The Bank of New York Mellon Corporation | 0,04 | −0,06 | 2,55 | 10,65 | 0,6025 | 0,0115 | |||
| SNA / Snap-on Incorporated | 0,01 | −0,02 | 2,50 | 2,54 | 0,5928 | −0,0347 | |||
| BMY / Bristol-Myers Squibb Company | 0,05 | 2,36 | 2,48 | 8,16 | 0,5868 | −0,0019 | |||
| IP / International Paper Company | 0,06 | 0,00 | 2,42 | 7,94 | 0,5731 | −0,0032 | |||
| ABT / Abbott Laboratories | 0,02 | −0,16 | 2,41 | 3,07 | 0,5716 | −0,0301 | |||
| DVN / Devon Energy Corporation | 0,05 | 16,46 | 2,40 | 29,02 | 0,5686 | 0,0902 | |||
| NVS / Novartis AG - Depositary Receipt (Common Stock) | 0,02 | −0,84 | 2,27 | −5,02 | 0,5379 | −0,0767 | |||
| AAPL / Apple Inc. | 0,01 | 0,00 | 2,24 | −10,90 | 0,5300 | −0,1159 | |||
| IRM / Iron Mountain Incorporated | 0,03 | 0,00 | 2,21 | 14,59 | 0,5226 | 0,0277 | |||
| USB / U.S. Bancorp | 0,05 | 1,05 | 2,17 | 4,39 | 0,5128 | −0,0205 | |||
| COHR / Coherent Corp. | 0,04 | −1,07 | 2,12 | 37,79 | 0,5024 | 0,1066 | |||
| ITT / ITT Inc. | 0,02 | −3,60 | 2,11 | 9,88 | 0,5004 | 0,0062 | |||
| MDT / Medtronic plc | 0,02 | −1,15 | 2,01 | 4,59 | 0,4747 | −0,0180 | |||
| EFA / iShares Trust - iShares MSCI EAFE ETF | 0,02 | 0,06 | 1,95 | 6,05 | 0,4607 | −0,0108 | |||
| XOM / Exxon Mobil Corporation | 0,02 | −0,06 | 1,90 | 16,20 | 0,4501 | 0,0297 | |||
| AVT / Avnet, Inc. | 0,04 | 0,00 | 1,88 | −1,62 | 0,4449 | −0,0460 | |||
| TJX / The TJX Companies, Inc. | 0,02 | 0,00 | 1,85 | 8,08 | 0,4371 | −0,0017 | |||
| AME / AMETEK, Inc. | 0,01 | 0,00 | 1,81 | 10,91 | 0,4286 | 0,0092 | |||
| T / AT&T Inc. | 0,10 | −2,34 | 1,77 | 2,44 | 0,4182 | −0,0249 | |||
| DY / Dycom Industries, Inc. | 0,01 | −0,17 | 1,70 | 24,51 | 0,4030 | 0,0517 | |||
| DHI / D.R. Horton, Inc. | 0,01 | 0,00 | 1,65 | 8,29 | 0,3895 | −0,0010 | |||
| PGR / The Progressive Corporation | 0,01 | 0,00 | 1,62 | 29,93 | 0,3823 | 0,0627 | |||
| LCII / LCI Industries | 0,01 | 0,00 | 1,59 | −2,10 | 0,3753 | −0,0408 | |||
| GILD / Gilead Sciences, Inc. | 0,02 | 1,78 | 1,53 | −7,95 | 0,3618 | −0,0649 | |||
| CR / Crane Company | 0,01 | −0,69 | 1,46 | 13,56 | 0,3451 | 0,0154 | |||
| GJR / Strats Trust For Procter & Gambel Security - Preferred Security | 0,01 | 0,00 | 1,44 | 10,74 | 0,3417 | 0,0067 | |||
| TRV / The Travelers Companies, Inc. | 0,01 | 0,00 | 1,44 | 20,77 | 0,3402 | 0,0346 | |||
| LLY / Eli Lilly and Company | 0,00 | 0,00 | 1,42 | 33,49 | 0,3370 | 0,0629 | |||
| MSI / Motorola Solutions, Inc. | 0,00 | −3,97 | 1,42 | 8,85 | 0,3351 | 0,0010 | |||
| LEG / Leggett & Platt, Incorporated | 0,07 | −1,38 | 1,40 | −27,84 | 0,3315 | −0,1671 | |||
| UFPI / UFP Industries, Inc. | 0,01 | −7,37 | 1,39 | −9,26 | 0,3295 | −0,0645 | |||
| ORCL / Oracle Corporation | 0,01 | 0,00 | 1,38 | 19,10 | 0,3278 | 0,0292 | |||
| VRTX / Vertex Pharmaceuticals Incorporated | 0,00 | 0,00 | 1,34 | 2,69 | 0,3166 | −0,0179 | |||
| JPM / JPMorgan Chase & Co. | 0,01 | 0,47 | 1,32 | 18,26 | 0,3115 | 0,0257 | |||
| MET / MetLife, Inc. | 0,02 | 0,00 | 1,27 | 12,11 | 0,3002 | 0,0095 | |||
| COP / ConocoPhillips | 0,01 | 0,00 | 1,22 | 9,69 | 0,2896 | 0,0030 | |||
| CAH / Cardinal Health, Inc. | 0,01 | 0,00 | 1,22 | 10,96 | 0,2878 | 0,0064 | |||
| LSTR / Landstar System, Inc. | 0,01 | 0,00 | 1,21 | −0,49 | 0,2870 | −0,0259 | |||
| SPB / Spectrum Brands Holdings, Inc. | 0,01 | 0,00 | 1,20 | 11,56 | 0,2836 | 0,0077 | |||
| AON / Aon plc | 0,00 | −3,19 | 1,17 | 11,06 | 0,2759 | 0,0062 | |||
| BAC / Bank of America Corporation | 0,03 | 4,07 | 1,10 | 17,20 | 0,2615 | 0,0194 | |||
| TMHC / Taylor Morrison Home Corporation | 0,02 | −3,29 | 1,08 | 12,66 | 0,2551 | 0,0094 | |||
| GNTX / Gentex Corporation | 0,03 | 0,00 | 1,07 | 10,58 | 0,2526 | 0,0047 | |||
| MOD / Modine Manufacturing Company | 0,01 | −21,28 | 1,06 | 25,56 | 0,2501 | 0,0338 | |||
| LEN / Lennar Corporation | 0,01 | 0,00 | 1,05 | 15,40 | 0,2483 | 0,0148 | |||
| WHR / Whirlpool Corporation | 0,01 | 0,00 | 1,04 | −1,79 | 0,2464 | −0,0258 | |||
| MCD / McDonald's Corporation | 0,00 | 0,00 | 0,99 | −4,89 | 0,2349 | −0,0332 | |||
| GIS / General Mills, Inc. | 0,01 | 0,00 | 0,99 | 7,49 | 0,2344 | −0,0024 | |||
| SLB / Schlumberger Limited | 0,02 | 0,60 | 0,96 | 5,95 | 0,2276 | −0,0055 | |||
| AIZ / Assurant, Inc. | 0,01 | 0,00 | 0,96 | 11,76 | 0,2273 | 0,0065 | |||
| JCI / Johnson Controls International plc | 0,01 | 0,00 | 0,95 | 13,33 | 0,2254 | 0,0095 | |||
| BAX / Baxter International Inc. | 0,02 | −2,44 | 0,94 | 7,92 | 0,2226 | −0,0014 | |||
| PXD / Pioneer Natural Resources Company | 0,00 | 0,00 | 0,93 | 16,79 | 0,2190 | 0,0154 | |||
| MLR / Miller Industries, Inc. | 0,02 | 0,00 | 0,90 | 18,52 | 0,2121 | 0,0178 | |||
| JEF / Jefferies Financial Group Inc. | 0,02 | −0,37 | 0,89 | 8,71 | 0,2100 | 0,0004 | |||
| MAN / ManpowerGroup Inc. | 0,01 | 0,00 | 0,86 | −2,29 | 0,2025 | −0,0225 | |||
| AGX / Argan, Inc. | 0,02 | 0,00 | 0,85 | 7,98 | 0,2018 | −0,0010 | |||
| EOG / EOG Resources, Inc. | 0,01 | 0,00 | 0,84 | 5,66 | 0,1990 | −0,0053 | |||
| BFH / Bread Financial Holdings, Inc. | 0,02 | 0,00 | 0,83 | 13,13 | 0,1958 | 0,0078 | |||
| IWN / iShares Trust - iShares Russell 2000 Value ETF | 0,01 | 0,10 | 0,82 | 2,38 | 0,1934 | −0,0117 | |||
| THC / Tenet Healthcare Corporation | 0,01 | 0,00 | 0,79 | 39,19 | 0,1875 | 0,0412 | |||
| MFIC / MidCap Financial Investment Corporation | 0,05 | 0,00 | 0,78 | 9,90 | 0,1840 | 0,0024 | |||
| SXT / Sensient Technologies Corporation | 0,01 | 0,00 | 0,74 | 4,84 | 0,1743 | −0,0062 | |||
| SYK / Stryker Corporation | 0,00 | 0,00 | 0,72 | 19,57 | 0,1708 | 0,0157 | |||
| IWS / iShares Trust - iShares Russell Mid-Cap Value ETF | 0,01 | 0,00 | 0,71 | 7,87 | 0,1688 | −0,0012 | |||
| LH / Labcorp Holdings Inc. | 0,00 | 5,91 | 0,71 | 1,71 | 0,1687 | −0,0112 | |||
| RSP / Invesco Exchange-Traded Fund Trust - Invesco S&P 500 Equal Weight ETF | 0,00 | 9,42 | 0,71 | 17,41 | 0,1677 | 0,0127 | |||
| GOOGL / Alphabet Inc. | 0,00 | 0,00 | 0,71 | 8,12 | 0,1672 | −0,0008 | |||
| ZBH / Zimmer Biomet Holdings, Inc. | 0,01 | 0,00 | 0,70 | 8,47 | 0,1668 | −0,0001 | |||
| LYTS / LSI Industries Inc. | 0,05 | 0,70 | 0,1660 | 0,1660 | |||||
| MKSI / MKS Inc. | 0,01 | 0,00 | 0,67 | 29,23 | 0,1593 | 0,0256 | |||
| CXT / Crane NXT, Co. | 0,01 | −1,36 | 0,67 | 7,35 | 0,1593 | −0,0017 | |||
| STAG / STAG Industrial, Inc. | 0,02 | 13,91 | 0,67 | 11,52 | 0,1583 | 0,0043 | |||
| CVX / Chevron Corporation | 0,00 | 0,91 | 0,65 | 6,79 | 0,1528 | −0,0026 | |||
| ED / Consolidated Edison, Inc. | 0,01 | 0,00 | 0,64 | −0,16 | 0,1504 | −0,0131 | |||
| PEP / PepsiCo, Inc. | 0,00 | 0,00 | 0,63 | 2,94 | 0,1496 | −0,0080 | |||
| BRK.A / Berkshire Hathaway Inc. | 0,00 | 0,00 | 0,63 | 16,05 | 0,1490 | 0,0096 | |||
| CAG / Conagra Brands, Inc. | 0,02 | 0,00 | 0,63 | 3,48 | 0,1480 | −0,0073 | |||
| HON / Honeywell International Inc. | 0,00 | 1,00 | 0,62 | −1,11 | 0,1474 | −0,0144 | |||
| KO / The Coca-Cola Company | 0,01 | −0,59 | 0,62 | 3,17 | 0,1466 | −0,0076 | |||
| TIP / iShares Trust - iShares TIPS Bond ETF | 0,01 | 1,86 | 0,61 | 1,66 | 0,1448 | −0,0096 | |||
| MS / Morgan Stanley | 0,01 | 0,00 | 0,59 | 0,85 | 0,1403 | −0,0105 | |||
| UFPT / UFP Technologies, Inc. | 0,00 | −43,85 | 0,58 | −17,71 | 0,1376 | −0,0438 | |||
| OMF / OneMain Holdings, Inc. | 0,01 | 0,00 | 0,58 | 3,95 | 0,1371 | −0,0062 | |||
| PINC / Premier, Inc. | 0,03 | 29,12 | 0,57 | 27,52 | 0,1351 | 0,0202 | |||
| SAFT / Safety Insurance Group, Inc. | 0,01 | 0,00 | 0,57 | 8,21 | 0,1343 | −0,0005 | |||
| CRM / Salesforce, Inc. | 0,00 | −5,21 | 0,55 | 8,51 | 0,1298 | −0,0000 | |||
| BP / BP p.l.c. - Depositary Receipt (Common Stock) | 0,01 | 0,00 | 0,55 | 6,45 | 0,1292 | −0,0025 | |||
| ASB / Associated Banc-Corp | 0,03 | 0,00 | 0,54 | 0,56 | 0,1284 | −0,0102 | |||
| GM / General Motors Company | 0,01 | 0,00 | 0,54 | 26,23 | 0,1277 | 0,0179 | |||
| AGG / iShares Trust - iShares Core U.S. Aggregate Bond ETF | 0,01 | 26,89 | 0,53 | 25,35 | 0,1266 | 0,0169 | |||
| ASIX / AdvanSix Inc. | 0,02 | 0,00 | 0,50 | −4,57 | 0,1188 | −0,0163 | |||
| LANC / Lancaster Colony Corporation | 0,00 | 0,00 | 0,49 | 24,81 | 0,1156 | 0,0151 | |||
| CRMT / America's Car-Mart, Inc. | 0,01 | 0,00 | 0,49 | −15,77 | 0,1152 | −0,0331 | |||
| FHI / Federated Hermes, Inc. | 0,01 | 0,00 | 0,48 | 6,65 | 0,1140 | −0,0020 | |||
| SCHP / Schwab Strategic Trust - Schwab U.S. TIPS ETF | 0,01 | −0,40 | 0,47 | −0,42 | 0,1111 | −0,0101 | |||
| CLF / Cleveland-Cliffs Inc. | 0,02 | 0,00 | 0,46 | 11,35 | 0,1093 | 0,0028 | |||
| SMP / Standard Motor Products, Inc. | 0,01 | 0,00 | 0,44 | −15,65 | 0,1047 | −0,0301 | |||
| NOMD / Nomad Foods Limited | 0,02 | 0,00 | 0,43 | 15,47 | 0,1025 | 0,0061 | |||
| VXUS / Vanguard STAR Funds - Vanguard Total International Stock ETF | 0,01 | 0,00 | 0,43 | 3,87 | 0,1018 | −0,0044 | |||
| EUSA / iShares, Inc. - iShares MSCI USA Equal Weighted ETF | 0,00 | 96,67 | 0,43 | 112,38 | 0,1017 | 0,0496 | |||
| AQN / Algonquin Power & Utilities Corp. | 0,07 | −3,61 | 0,42 | −3,70 | 0,0988 | −0,0125 | |||
| SHEL / Shell plc - Depositary Receipt (Common Stock) | 0,01 | 0,00 | 0,41 | 1,97 | 0,0981 | −0,0064 | |||
| BC / Brunswick Corporation | 0,00 | 0,00 | 0,40 | −0,25 | 0,0956 | −0,0084 | |||
| BDX / Becton, Dickinson and Company | 0,00 | 0,00 | 0,40 | 1,51 | 0,0955 | −0,0066 | |||
| MRNA / Moderna, Inc. | 0,00 | −5,10 | 0,40 | 1,54 | 0,0940 | −0,0063 | |||
| NGVT / Ingevity Corporation | 0,01 | 0,00 | 0,39 | 1,03 | 0,0930 | −0,0069 | |||
| FITB / Fifth Third Bancorp | 0,01 | 0,00 | 0,39 | 7,69 | 0,0930 | −0,0006 | |||
| KN / Knowles Corporation | 0,02 | 0,00 | 0,39 | −10,14 | 0,0924 | −0,0192 | |||
| AMG / Affiliated Managers Group, Inc. | 0,00 | 0,00 | 0,39 | 10,80 | 0,0923 | 0,0017 | |||
| CNI / Canadian National Railway Company | 0,00 | 0,00 | 0,38 | 4,99 | 0,0898 | −0,0032 | |||
| CP / Canadian Pacific Kansas City Limited | 0,00 | 0,37 | 0,0000 | ||||||
| CAT / Caterpillar Inc. | 0,00 | 0,00 | 0,37 | 24,07 | 0,0867 | 0,0108 | |||
| SCHB / Schwab Strategic Trust - Schwab U.S. Broad Market ETF | 0,01 | 0,37 | 0,37 | 10,24 | 0,0867 | 0,0012 | |||
| FNF / Fidelity National Financial, Inc. | 0,01 | 17,49 | 0,36 | 22,45 | 0,0853 | 0,0096 | |||
| ADP / Automatic Data Processing, Inc. | 0,00 | 0,00 | 0,36 | 7,23 | 0,0845 | −0,0011 | |||
| AVGO / Broadcom Inc. | 0,00 | 0,00 | 0,36 | 18,67 | 0,0844 | 0,0073 | |||
| VMI / Valmont Industries, Inc. | 0,00 | 79,86 | 0,35 | 76,12 | 0,0840 | 0,0321 | |||
| MHK / Mohawk Industries, Inc. | 0,00 | 0,00 | 0,35 | 26,64 | 0,0823 | 0,0117 | |||
| APOG / Apogee Enterprises, Inc. | 0,01 | 0,00 | 0,34 | 10,61 | 0,0816 | 0,0017 | |||
| IWV / iShares Trust - iShares Russell 3000 ETF | 0,00 | 0,00 | 0,34 | 9,58 | 0,0813 | 0,0008 | |||
| CLX / The Clorox Company | 0,00 | 0,00 | 0,34 | 7,37 | 0,0794 | −0,0009 | |||
| HUN / Huntsman Corporation | 0,01 | 0,00 | 0,33 | 3,44 | 0,0786 | −0,0038 | |||
| DLX / Deluxe Corporation | 0,02 | 0,00 | 0,33 | −4,09 | 0,0778 | −0,0102 | |||
| SFM / Sprouts Farmers Market, Inc. | 0,01 | −14,26 | 0,32 | 14,95 | 0,0766 | 0,0043 | |||
| HI / Hillenbrand, Inc. | 0,01 | 0,00 | 0,32 | 5,30 | 0,0754 | −0,0025 | |||
| DOV / Dover Corporation | 0,00 | 0,00 | 0,31 | 15,30 | 0,0732 | 0,0042 | |||
| BHLB / Berkshire Hills Bancorp, Inc. | 0,01 | 0,00 | 0,31 | −7,78 | 0,0731 | −0,0128 | |||
| HELE / Helen of Troy Limited | 0,00 | 0,00 | 0,30 | −4,76 | 0,0712 | −0,0098 | |||
| ACU / Acme United Corporation | 0,01 | −40,70 | 0,28 | −35,05 | 0,0660 | −0,0442 | |||
| OTTR / Otter Tail Corporation | 0,00 | 0,00 | 0,28 | 1,46 | 0,0660 | −0,0044 | |||
| AMGN / Amgen Inc. | 0,00 | 0,00 | 0,28 | −1,07 | 0,0656 | −0,0065 | |||
| CRI / Carter's, Inc. | 0,00 | 0,00 | 0,26 | 13,30 | 0,0625 | 0,0025 | |||
| FBIN / Fortune Brands Innovations, Inc. | 0,00 | 0,00 | 0,26 | 11,35 | 0,0604 | 0,0014 | |||
| PK / Park Hotels & Resorts Inc. | 0,01 | 0,00 | 0,25 | 14,61 | 0,0595 | 0,0030 | |||
| VYX / NCR Voyix Corporation | 0,02 | 0,00 | 0,25 | −25,37 | 0,0593 | −0,0269 | |||
| PAYX / Paychex, Inc. | 0,00 | 0,00 | 0,25 | 2,94 | 0,0581 | −0,0031 | |||
| MO / Altria Group, Inc. | 0,01 | 0,00 | 0,23 | 8,33 | 0,0554 | −0,0002 | |||
| PKG / Packaging Corporation of America | 0,00 | 0,23 | 0,0539 | 0,0539 | |||||
| BKFOF / Brookfield Corporation - Preferred Stock | 0,01 | 0,00 | 0,23 | 4,63 | 0,0535 | −0,0021 | |||
| NDAQ / Nasdaq, Inc. | 0,00 | 0,00 | 0,22 | 8,82 | 0,0527 | −0,0000 | |||
| DUK / Duke Energy Corporation | 0,00 | 0,00 | 0,22 | −0,46 | 0,0518 | −0,0046 | |||
| DAR / Darling Ingredients Inc. | 0,00 | 0,00 | 0,22 | −6,84 | 0,0517 | −0,0084 | |||
| HSII / Heidrick & Struggles International, Inc. | 0,01 | 0,21 | 0,0506 | 0,0506 | |||||
| KMI / Kinder Morgan, Inc. | 0,01 | −6,18 | 0,21 | −2,31 | 0,0501 | −0,0056 | |||
| PDCO / Patterson Companies, Inc. | 0,01 | 0,00 | 0,20 | −2,91 | 0,0475 | −0,0055 | |||
| TBNK / Territorial Bancorp Inc. | 0,02 | 0,00 | 0,18 | −27,94 | 0,0423 | −0,0212 | |||
| PARA / Paramount Global | 0,01 | −0,24 | 0,17 | −20,37 | 0,0408 | −0,0150 | |||
| SBRA / Sabra Health Care REIT, Inc. | 0,01 | 0,00 | 0,16 | 3,92 | 0,0377 | −0,0018 | |||
| WBD / Warner Bros. Discovery, Inc. | 0,02 | −9,73 | 0,13 | −31,05 | 0,0312 | −0,0177 | |||
| RQI / Cohen & Steers Quality Income Realty Fund, Inc. | 0,01 | 0,00 | 0,13 | −0,78 | 0,0303 | −0,0030 | |||
| PNNT / PennantPark Investment Corporation | 0,01 | 0,00 | 0,08 | 0,00 | 0,0179 | −0,0016 | |||
| NBIO / Nascent Biotech, Inc. | 0,10 | 0,00 | 0,02 | −16,67 | 0,0037 | −0,0009 | |||
| NYMXF / Nymox Pharmaceutical Corporation | 0,01 | 0,00 | 0,00 | −20,00 | 0,0009 | −0,0006 | |||
| ZEV / Lightning eMotors Inc | 0,01 | 0,00 | 0,00 | −100,00 | 0,0001 | −0,0007 | |||
| BA / The Boeing Company | 0,00 | −100,00 | 0,00 | 0,0000 | |||||
| IBM / International Business Machines Corporation | 0,00 | −100,00 | 0,00 | 0,0000 | |||||
| HAYN / Haynes International, Inc. | 0,00 | −100,00 | 0,00 | 0,0000 | |||||
| NYCB / Flagstar Financial, Inc. | 0,00 | −100,00 | 0,00 | 0,0000 | |||||
| NATL / NCR Atleos Corporation | 0,00 | −100,00 | 0,00 | 0,0000 | |||||
| QCOM / QUALCOMM Incorporated | 0,00 | −100,00 | 0,00 | 0,0000 |