Grunnleggende statistikk
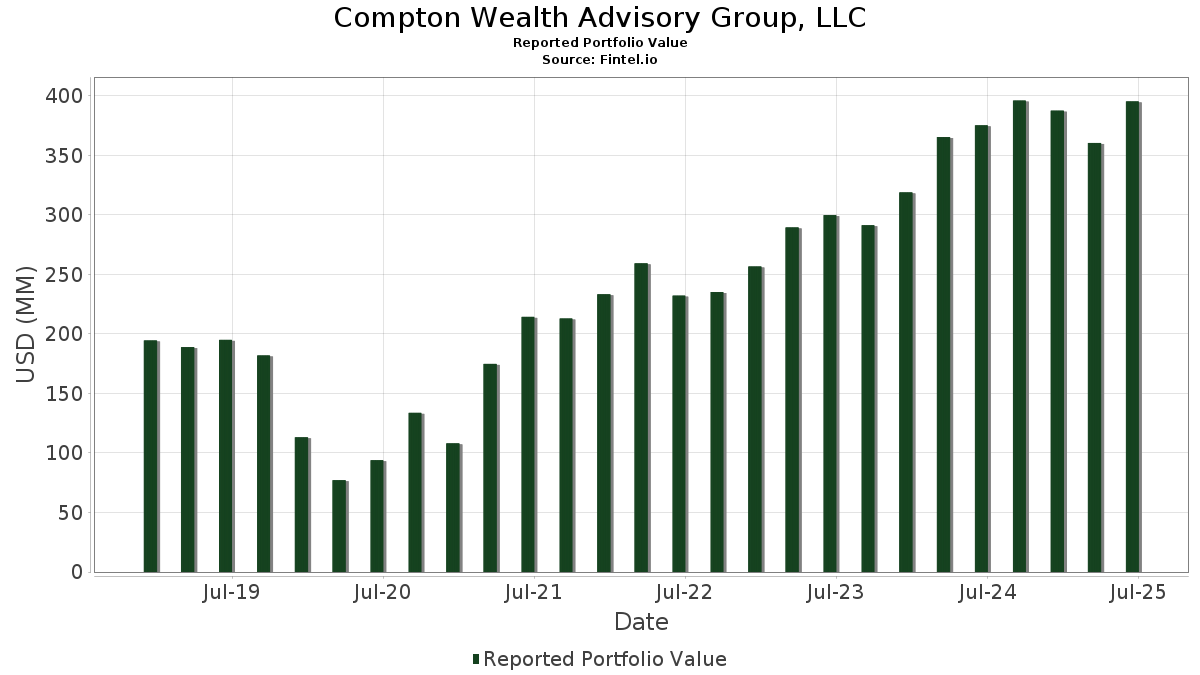
| Porteføljeverdi | $ 395 299 262 |
| Nåværende posisjoner | 81 |
Siste beholdninger, prestasjoner, forvaltet kapital (fra 13F, 13D)
Compton Wealth Advisory Group, LLC har oppgitt 81 totale beholdninger i sine siste SEC-arkiveringer. Siste porteføljeverdi er beregnet til 395 299 262 USD. Faktisk forvaltet kapital (AUM) er denne verdien pluss kontanter (som ikke er oppgitt). Compton Wealth Advisory Group, LLCs største beholdninger er Vanguard International Equity Index Funds - Vanguard FTSE All-World ex-US ETF (US:VEU) , iShares Trust - iShares Russell Top 200 Growth ETF (US:IWY) , Vanguard Specialized Funds - Vanguard Dividend Appreciation ETF (US:VIG) , iShares Trust - iShares Russell Top 200 Value ETF (US:IWX) , and Vanguard Index Funds - Vanguard Value ETF (US:VTV) .
De største økningene dette kvartalet
Vi bruker endringen i porteføljeallokeringen fordi dette er det mest meningsfulle målet. Endringer kan skyldes handler eller endringer i aksjekursene.
| Verdipapirer | Aksjer (MM) |
Verdi (MM$) |
Portefølje % | ΔPortefølje % |
|---|---|---|---|---|
| 0,03 | 9,58 | 2,4224 | 0,7707 | |
| 0,02 | 11,68 | 2,9560 | 0,5223 | |
| 0,10 | 17,76 | 4,4916 | 0,4227 | |
| 0,12 | 29,89 | 7,5621 | 0,3627 | |
| 0,10 | 7,70 | 1,9488 | 0,3244 | |
| 0,02 | 3,52 | 0,8893 | 0,2655 | |
| 0,76 | 51,07 | 12,9202 | 0,2464 | |
| 0,05 | 13,34 | 3,3756 | 0,2262 | |
| 0,01 | 5,33 | 1,3472 | 0,2008 | |
| 0,03 | 8,34 | 2,1101 | 0,1557 |
De største reduksjonene dette kvartalet
Vi bruker endringen i porteføljeallokeringen fordi dette er det mest meningsfulle målet. Endringer kan skyldes handler eller endringer i aksjekurser.
| Verdipapirer | Aksjer (MM) |
Verdi (MM$) |
Portefølje % | ΔPortefølje % |
|---|---|---|---|---|
| 0,06 | 13,16 | 3,3300 | −0,5951 | |
| 0,01 | 2,62 | 0,6633 | −0,5668 | |
| 0,25 | 20,86 | 5,2758 | −0,3446 | |
| 0,01 | 5,87 | 1,4855 | −0,2491 | |
| 0,11 | 19,29 | 4,8797 | −0,2330 | |
| 0,16 | 9,51 | 2,4049 | −0,1970 | |
| 0,02 | 3,85 | 0,9737 | −0,1956 | |
| 0,12 | 25,40 | 6,4250 | −0,1904 | |
| 0,09 | 14,41 | 3,6448 | −0,1516 | |
| 0,01 | 1,54 | 0,3903 | −0,1436 |
13F- og Fondsarkiveringer
Dette skjemaet ble sendt inn den 2025-07-10 for rapporteringsperioden 2025-06-30. Klikk på lenkeikonet for å se hele transaksjonshistorikken.
Oppgradere for å låse opp premiedata og eksportere til Excel![]() .
.
| Verdipapirer | Type | Gjennomsnittlig aksjekurs | Aksjer (MM) |
ΔAksjer (%) |
ΔAksjer (%) |
Verdi ($MM) |
Portefølje (%) |
ΔPortefølje (%) |
|
|---|---|---|---|---|---|---|---|---|---|
| VEU / Vanguard International Equity Index Funds - Vanguard FTSE All-World ex-US ETF | 0,76 | 0,90 | 51,07 | 11,82 | 12,9202 | 0,2464 | |||
| IWY / iShares Trust - iShares Russell Top 200 Growth ETF | 0,12 | −1,41 | 29,89 | 15,21 | 7,5621 | 0,3627 | |||
| VIG / Vanguard Specialized Funds - Vanguard Dividend Appreciation ETF | 0,12 | 0,97 | 25,40 | 6,53 | 6,4250 | −0,1904 | |||
| IWX / iShares Trust - iShares Russell Top 200 Value ETF | 0,25 | 0,50 | 20,86 | 2,96 | 5,2758 | −0,3446 | |||
| VTV / Vanguard Index Funds - Vanguard Value ETF | 0,11 | 2,32 | 19,29 | 4,68 | 4,8797 | −0,2330 | |||
| VB / Vanguard Index Funds - Vanguard Small-Cap ETF | 0,08 | 6,09 | 18,34 | 13,37 | 4,6388 | 0,1509 | |||
| RSP / Invesco Exchange-Traded Fund Trust - Invesco S&P 500 Equal Weight ETF | 0,10 | 15,41 | 17,76 | 21,09 | 4,4916 | 0,4227 | |||
| VOE / Vanguard Index Funds - Vanguard Mid-Cap Value ETF | 0,09 | 2,79 | 14,41 | 5,30 | 3,6448 | −0,1516 | |||
| VOT / Vanguard Index Funds - Vanguard Mid-Cap Growth ETF | 0,05 | 1,13 | 13,34 | 17,56 | 3,3756 | 0,2262 | |||
| AAPL / Apple Inc. | 0,06 | 0,75 | 13,16 | −6,94 | 3,3300 | −0,5951 | |||
| MSFT / Microsoft Corporation | 0,02 | 0,54 | 11,68 | 33,23 | 2,9560 | 0,5223 | |||
| AVGO / Broadcom Inc. | 0,03 | −2,29 | 9,58 | 60,87 | 2,4224 | 0,7707 | |||
| VGSH / Vanguard Scottsdale Funds - Vanguard Short-Term Treasury ETF | 0,16 | 1,23 | 9,51 | 1,38 | 2,4049 | −0,1970 | |||
| JPM / JPMorgan Chase & Co. | 0,03 | 0,20 | 8,34 | 18,43 | 2,1101 | 0,1557 | |||
| AMZN / Amazon.com, Inc. | 0,04 | 1,51 | 8,32 | 17,05 | 2,1047 | 0,1324 | |||
| VCRB / Vanguard Core Bond Fund | 0,10 | 31,33 | 7,70 | 31,59 | 1,9488 | 0,3244 | |||
| GOOGL / Alphabet Inc. | 0,04 | 1,09 | 7,66 | 15,20 | 1,9383 | 0,0928 | |||
| VEA / Vanguard Tax-Managed Funds - Vanguard FTSE Developed Markets ETF | 0,13 | 0,00 | 7,43 | 12,16 | 1,8788 | 0,0414 | |||
| IVW / iShares Trust - iShares S&P 500 Growth ETF | 0,06 | −13,54 | 6,23 | 2,55 | 1,5767 | −0,1097 | |||
| BRK.B / Berkshire Hathaway Inc. | 0,01 | 2,98 | 5,87 | −6,08 | 1,4855 | −0,2491 | |||
| VUG / Vanguard Index Funds - Vanguard Growth ETF | 0,01 | 9,03 | 5,33 | 28,90 | 1,3472 | 0,2008 | |||
| V / Visa Inc. | 0,01 | 0,02 | 3,91 | 1,32 | 0,9883 | −0,0815 | |||
| COST / Costco Wholesale Corporation | 0,00 | 1,21 | 3,89 | 5,94 | 0,9834 | −0,0348 | |||
| TMUS / T-Mobile US, Inc. | 0,02 | 2,24 | 3,85 | −8,66 | 0,9737 | −0,1956 | |||
| VWO / Vanguard International Equity Index Funds - Vanguard FTSE Emerging Markets ETF | 0,08 | −0,80 | 3,79 | 8,42 | 0,9576 | −0,0113 | |||
| ORCL / Oracle Corporation | 0,02 | 0,00 | 3,52 | 56,36 | 0,8893 | 0,2655 | |||
| DLTR / Dollar Tree, Inc. | 0,03 | 0,43 | 3,42 | 32,48 | 0,8659 | 0,1491 | |||
| WMT / Walmart Inc. | 0,03 | 3,15 | 3,15 | 14,89 | 0,7965 | 0,0360 | |||
| HD / The Home Depot, Inc. | 0,01 | −7,45 | 2,77 | −7,42 | 0,7003 | −0,1293 | |||
| BAC / Bank of America Corporation | 0,06 | −3,48 | 2,73 | 9,45 | 0,6914 | −0,0015 | |||
| UNH / UnitedHealth Group Incorporated | 0,01 | −0,70 | 2,62 | −40,88 | 0,6633 | −0,5668 | |||
| CAT / Caterpillar Inc. | 0,01 | 1,44 | 2,54 | 19,45 | 0,6416 | 0,0522 | |||
| CRM / Salesforce, Inc. | 0,01 | 5,20 | 2,38 | 6,88 | 0,6015 | −0,0157 | |||
| RFG / Invesco Exchange-Traded Fund Trust - Invesco S&P MidCap 400 Pure Growth ETF | 0,05 | 0,00 | 2,32 | 11,24 | 0,5858 | 0,0081 | |||
| ABBV / AbbVie Inc. | 0,01 | 1,04 | 2,15 | −10,47 | 0,5431 | −0,1224 | |||
| CSCO / Cisco Systems, Inc. | 0,03 | −0,13 | 2,10 | 12,33 | 0,5303 | 0,0123 | |||
| MS / Morgan Stanley | 0,01 | 5,28 | 1,99 | 27,11 | 0,5031 | 0,0689 | |||
| IWL / iShares Trust - iShares Russell Top 200 ETF | 0,01 | −19,66 | 1,97 | −10,52 | 0,4996 | −0,1125 | |||
| CVX / Chevron Corporation | 0,01 | −0,33 | 1,93 | −14,67 | 0,4886 | −0,1396 | |||
| ADBE / Adobe Inc. | 0,00 | −4,46 | 1,73 | −3,67 | 0,4379 | −0,0605 | |||
| VBR / Vanguard Index Funds - Vanguard Small-Cap Value ETF | 0,01 | 1,36 | 1,67 | 6,11 | 0,4216 | −0,0142 | |||
| MA / Mastercard Incorporated | 0,00 | 0,22 | 1,57 | 2,75 | 0,3970 | −0,0270 | |||
| PEP / PepsiCo, Inc. | 0,01 | −8,94 | 1,54 | −19,81 | 0,3903 | −0,1436 | |||
| VBK / Vanguard Index Funds - Vanguard Small-Cap Growth ETF | 0,01 | 0,00 | 1,49 | 9,97 | 0,3768 | 0,0011 | |||
| LMT / Lockheed Martin Corporation | 0,00 | −17,24 | 1,47 | −14,23 | 0,3723 | −0,1037 | |||
| IWR / iShares Trust - iShares Russell Mid-Cap ETF | 0,02 | 0,36 | 1,46 | 8,50 | 0,3681 | −0,0040 | |||
| VOO / Vanguard Index Funds - Vanguard S&P 500 ETF | 0,00 | 41,48 | 1,45 | 56,40 | 0,3676 | 0,1098 | |||
| GOOG / Alphabet Inc. | 0,01 | 0,00 | 1,36 | 13,57 | 0,3431 | 0,0117 | |||
| PG / The Procter & Gamble Company | 0,01 | −5,68 | 1,35 | −11,86 | 0,3405 | −0,0831 | |||
| JNJ / Johnson & Johnson | 0,01 | 0,12 | 1,15 | −7,77 | 0,2913 | −0,0552 | |||
| LLY / Eli Lilly and Company | 0,00 | 16,70 | 1,07 | 10,11 | 0,2702 | 0,0011 | |||
| MRK / Merck & Co., Inc. | 0,01 | −14,80 | 1,02 | −24,85 | 0,2587 | −0,1189 | |||
| IWF / iShares Trust - iShares Russell 1000 Growth ETF | 0,00 | 0,00 | 1,00 | 17,59 | 0,2521 | 0,0169 | |||
| ABT / Abbott Laboratories | 0,01 | −21,96 | 0,88 | −20,02 | 0,2215 | −0,0821 | |||
| IVV / iShares Trust - iShares Core S&P 500 ETF | 0,00 | 0,00 | 0,80 | 10,51 | 0,2022 | 0,0015 | |||
| IJK / iShares Trust - iShares S&P Mid-Cap 400 Growth ETF | 0,01 | −4,02 | 0,73 | 4,90 | 0,1842 | −0,0085 | |||
| TMO / Thermo Fisher Scientific Inc. | 0,00 | −12,93 | 0,72 | −29,07 | 0,1810 | −0,0988 | |||
| ORLY / O'Reilly Automotive, Inc. | 0,01 | 1 400,00 | 0,70 | −5,68 | 0,1765 | −0,0286 | |||
| ITW / Illinois Tool Works Inc. | 0,00 | 0,00 | 0,69 | −0,29 | 0,1739 | −0,0174 | |||
| FTXP / Foothills Exploration, Inc. | 0,00 | 0,00 | 0,65 | 31,91 | 0,1643 | 0,0275 | |||
| SBUX / Starbucks Corporation | 0,01 | −24,09 | 0,64 | −29,13 | 0,1607 | −0,0879 | |||
| NEE / NextEra Energy, Inc. | 0,01 | 0,00 | 0,63 | −2,17 | 0,1598 | −0,0192 | |||
| AMGN / Amgen Inc. | 0,00 | 0,00 | 0,63 | −10,30 | 0,1586 | −0,0355 | |||
| GPI / Group 1 Automotive, Inc. | 0,00 | 0,00 | 0,57 | 14,52 | 0,1437 | 0,0058 | |||
| AN / AutoNation, Inc. | 0,00 | 0,00 | 0,55 | 22,70 | 0,1382 | 0,0146 | |||
| KO / The Coca-Cola Company | 0,01 | 3,43 | 0,54 | 2,27 | 0,1369 | −0,0101 | |||
| MANH / Manhattan Associates, Inc. | 0,00 | 0,00 | 0,49 | 14,08 | 0,1230 | 0,0048 | |||
| MMM / 3M Company | 0,00 | 0,48 | 0,1226 | 0,1226 | |||||
| WM / Waste Management, Inc. | 0,00 | 0,00 | 0,46 | −1,08 | 0,1155 | −0,0127 | |||
| TXN / Texas Instruments Incorporated | 0,00 | 0,46 | 0,36 | 16,08 | 0,0913 | 0,0050 | |||
| AJG / Arthur J. Gallagher & Co. | 0,00 | 0,00 | 0,36 | −7,07 | 0,0898 | −0,0164 | |||
| DFUS / Dimensional ETF Trust - Dimensional U.S. Equity Market ETF | 0,01 | 0,00 | 0,35 | 10,90 | 0,0876 | 0,0009 | |||
| TOWN / TowneBank | 0,01 | 0,00 | 0,34 | 0,00 | 0,0865 | −0,0084 | |||
| IAU / iShares Gold Trust | 0,01 | 0,00 | 0,31 | 5,72 | 0,0795 | −0,0029 | |||
| IJT / iShares Trust - iShares S&P Small-Cap 600 Growth ETF | 0,00 | 22,22 | 0,30 | 31,00 | 0,0759 | 0,0122 | |||
| UBS / UBS Group AG | 0,01 | 0,00 | 0,30 | 10,45 | 0,0751 | 0,0005 | |||
| NVDA / NVIDIA Corporation | 0,00 | −12,37 | 0,28 | 27,93 | 0,0719 | 0,0102 | |||
| DHR / Danaher Corporation | 0,00 | 0,00 | 0,28 | −3,85 | 0,0698 | −0,0096 | |||
| NSC / Norfolk Southern Corporation | 0,00 | −17,33 | 0,27 | −10,75 | 0,0695 | −0,0158 | |||
| AEIS / Advanced Energy Industries, Inc. | 0,00 | 0,27 | 0,0684 | 0,0684 | |||||
| AXP / American Express Company | 0,00 | 0,89 | 0,25 | 19,43 | 0,0640 | 0,0053 | |||
| TJX / The TJX Companies, Inc. | 0,00 | −100,00 | 0,00 | 0,0000 | |||||
| XOM / Exxon Mobil Corporation | 0,00 | −100,00 | 0,00 | 0,0000 |