Grunnleggende statistikk
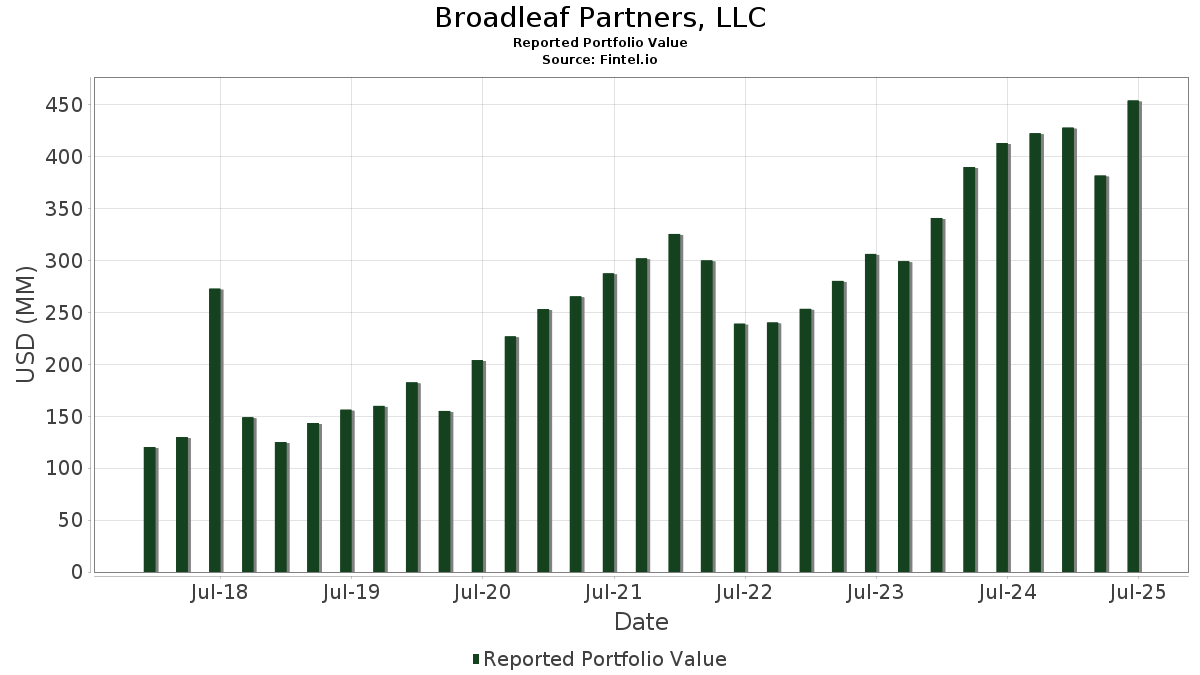
| Porteføljeverdi | $ 454 236 237 |
| Nåværende posisjoner | 82 |
Siste beholdninger, prestasjoner, forvaltet kapital (fra 13F, 13D)
Broadleaf Partners, LLC har oppgitt 82 totale beholdninger i sine siste SEC-arkiveringer. Siste porteføljeverdi er beregnet til 454 236 237 USD. Faktisk forvaltet kapital (AUM) er denne verdien pluss kontanter (som ikke er oppgitt). Broadleaf Partners, LLCs største beholdninger er Microsoft Corporation (US:MSFT) , NVIDIA Corporation (US:NVDA) , Amazon.com, Inc. (US:AMZN) , Apple Inc. (US:AAPL) , and Meta Platforms, Inc. (US:META) . Broadleaf Partners, LLCs nye posisjoner inkluderer Spotify Technology S.A. (US:SPOT) , Palo Alto Networks, Inc. (US:PANW) , .
De største økningene dette kvartalet
Vi bruker endringen i porteføljeallokeringen fordi dette er det mest meningsfulle målet. Endringer kan skyldes handler eller endringer i aksjekursene.
| Verdipapirer | Aksjer (MM) |
Verdi (MM$) |
Portefølje % | ΔPortefølje % |
|---|---|---|---|---|
| 0,05 | 13,82 | 3,0426 | 1,4398 | |
| 0,19 | 30,19 | 6,6461 | 1,1812 | |
| 0,01 | 3,94 | 0,8681 | 0,8681 | |
| 0,00 | 7,42 | 1,6339 | 0,8487 | |
| 0,02 | 3,71 | 0,8170 | 0,8170 | |
| 0,03 | 7,54 | 1,6604 | 0,7886 | |
| 0,06 | 30,80 | 6,7800 | 0,6668 | |
| 0,07 | 9,06 | 1,9939 | 0,6527 | |
| 0,06 | 8,24 | 1,8148 | 0,5971 | |
| 0,07 | 11,72 | 2,5791 | 0,5724 |
De største reduksjonene dette kvartalet
Vi bruker endringen i porteføljeallokeringen fordi dette er det mest meningsfulle målet. Endringer kan skyldes handler eller endringer i aksjekurser.
| Verdipapirer | Aksjer (MM) |
Verdi (MM$) |
Portefølje % | ΔPortefølje % |
|---|---|---|---|---|
| 0,10 | 19,66 | 4,3287 | −2,3160 | |
| 0,07 | 3,83 | 0,8424 | −1,0736 | |
| 0,09 | 15,08 | 3,3204 | −0,9272 | |
| 0,00 | 1,13 | 0,2485 | −0,8953 | |
| 0,77 | 17,02 | 3,7460 | −0,7219 | |
| 0,04 | 10,57 | 2,3265 | −0,6102 | |
| 0,01 | 12,78 | 2,8140 | −0,4011 | |
| 0,02 | 9,89 | 2,1766 | −0,3529 | |
| 0,01 | 4,96 | 1,0923 | −0,2895 | |
| 0,17 | 4,56 | 1,0041 | −0,2611 |
13F- og Fondsarkiveringer
Dette skjemaet ble sendt inn den 2025-08-14 for rapporteringsperioden 2025-06-30. Klikk på lenkeikonet for å se hele transaksjonshistorikken.
Oppgradere for å låse opp premiedata og eksportere til Excel![]() .
.
| Verdipapirer | Type | Gjennomsnittlig aksjekurs | Aksjer (MM) |
ΔAksjer (%) |
ΔAksjer (%) |
Verdi ($MM) |
Portefølje (%) |
ΔPortefølje (%) |
|
|---|---|---|---|---|---|---|---|---|---|
| MSFT / Microsoft Corporation | 0,06 | −0,45 | 30,80 | 31,91 | 6,7800 | 0,6668 | |||
| NVDA / NVIDIA Corporation | 0,19 | −0,78 | 30,19 | 44,64 | 6,6461 | 1,1812 | |||
| AMZN / Amazon.com, Inc. | 0,11 | −0,19 | 24,49 | 15,09 | 5,3904 | −0,1799 | |||
| AAPL / Apple Inc. | 0,10 | −16,12 | 19,66 | −22,52 | 4,3287 | −2,3160 | |||
| META / Meta Platforms, Inc. | 0,03 | −0,55 | 19,56 | 27,36 | 4,3065 | 0,2848 | |||
| SCHF / Schwab Strategic Trust - Schwab International Equity ETF | 0,77 | −10,75 | 17,02 | −0,29 | 3,7460 | −0,7219 | |||
| GOOG / Alphabet Inc. | 0,09 | −18,12 | 15,08 | −7,03 | 3,3204 | −0,9272 | |||
| SCHG / Schwab Strategic Trust - Schwab U.S. Large-Cap Growth ETF | 0,48 | 9,03 | 13,98 | 27,18 | 3,0768 | 0,1997 | |||
| AVGO / Broadcom Inc. | 0,05 | 37,13 | 13,82 | 125,78 | 3,0426 | 1,4398 | |||
| NOW / ServiceNow, Inc. | 0,01 | −0,56 | 13,27 | 28,41 | 2,9213 | 0,2155 | |||
| NFLX / Netflix, Inc. | 0,01 | −0,39 | 12,97 | 43,05 | 2,8552 | 0,4812 | |||
| COST / Costco Wholesale Corporation | 0,01 | −0,55 | 12,78 | 4,10 | 2,8140 | −0,4011 | |||
| GSCE / GS Connect S&P GSCI Enhanced Commodity Total Return ETN | 0,02 | −0,29 | 12,77 | 29,17 | 2,8108 | 0,2229 | |||
| ARM / Arm Holdings plc - Depositary Receipt (Common Stock) | 0,07 | 0,93 | 11,72 | 52,86 | 2,5791 | 0,5724 | |||
| PGR / The Progressive Corporation | 0,04 | −0,08 | 10,57 | −5,78 | 2,3265 | −0,6102 | |||
| CTAS / Cintas Corporation | 0,05 | −0,08 | 10,41 | 8,35 | 2,2919 | −0,2238 | |||
| ISRG / Intuitive Surgical, Inc. | 0,02 | −0,51 | 10,36 | 9,17 | 2,2807 | −0,2041 | |||
| ANET / Arista Networks Inc | 0,10 | −3,88 | 9,90 | 26,92 | 2,1796 | 0,1371 | |||
| MA / Mastercard Incorporated | 0,02 | −0,18 | 9,89 | 2,34 | 2,1766 | −0,3529 | |||
| VRT / Vertiv Holdings Co | 0,07 | −0,59 | 9,06 | 76,81 | 1,9939 | 0,6527 | |||
| UBER / Uber Technologies, Inc. | 0,10 | −0,35 | 8,98 | 27,61 | 1,9759 | 0,1344 | |||
| ORCL / Oracle Corporation | 0,04 | −0,54 | 8,32 | 55,54 | 1,8306 | 0,4307 | |||
| PLTR / Palantir Technologies Inc. | 0,06 | 9,74 | 8,24 | 77,27 | 1,8148 | 0,5971 | |||
| URI / United Rentals, Inc. | 0,01 | 0,17 | 7,91 | 20,42 | 1,7409 | 0,0215 | |||
| JPM / JPMorgan Chase & Co. | 0,03 | 91,67 | 7,54 | 126,55 | 1,6604 | 0,7886 | |||
| BKNG / Booking Holdings Inc. | 0,00 | 96,93 | 7,42 | 147,45 | 1,6339 | 0,8487 | |||
| FBCG / Fidelity Covington Trust - Fidelity Blue Chip Growth ETF | 0,14 | 14,86 | 6,58 | 38,64 | 1,4486 | 0,2058 | |||
| SCHM / Schwab Strategic Trust - Schwab U.S. Mid-Cap ETF | 0,23 | 5,16 | 6,47 | 12,59 | 1,4235 | −0,0803 | |||
| TSLA / Tesla, Inc. | 0,02 | −0,07 | 5,48 | 22,48 | 1,2068 | 0,0350 | |||
| DDOG / Datadog, Inc. | 0,04 | −0,57 | 5,37 | 34,61 | 1,1817 | 0,1378 | |||
| LLY / Eli Lilly and Company | 0,01 | −0,39 | 4,96 | −5,99 | 1,0923 | −0,2895 | |||
| SHW / The Sherwin-Williams Company | 0,01 | −0,11 | 4,73 | −1,77 | 1,0407 | −0,2194 | |||
| TDG / TransDigm Group Incorporated | 0,00 | −0,07 | 4,64 | 9,85 | 1,0214 | −0,0844 | |||
| SCHD / Schwab Strategic Trust - Schwab U.S. Dividend Equity ETF | 0,17 | −0,41 | 4,56 | −5,61 | 1,0041 | −0,2611 | |||
| APP / AppLovin Corporation | 0,01 | −0,15 | 4,22 | 31,92 | 0,9292 | 0,0915 | |||
| SPOT / Spotify Technology S.A. | 0,01 | 3,94 | 0,8681 | 0,8681 | |||||
| BALL / Ball Corporation | 0,07 | −9,19 | 3,88 | −2,17 | 0,8544 | −0,1844 | |||
| CMG / Chipotle Mexican Grill, Inc. | 0,07 | −53,24 | 3,83 | −47,71 | 0,8424 | −1,0736 | |||
| PANW / Palo Alto Networks, Inc. | 0,02 | 3,71 | 0,8170 | 0,8170 | |||||
| TXRH / Texas Roadhouse, Inc. | 0,02 | 0,71 | 3,34 | 13,27 | 0,7350 | −0,0368 | |||
| SCHA / Schwab Strategic Trust - Schwab U.S. Small-Cap ETF | 0,13 | 8,62 | 3,30 | 17,26 | 0,7269 | −0,0102 | |||
| UTHR / United Therapeutics Corporation | 0,01 | −0,08 | 2,73 | −6,87 | 0,6003 | −0,1663 | |||
| IWP / iShares Trust - iShares Russell Mid-Cap Growth ETF | 0,02 | 4,56 | 2,71 | 23,44 | 0,5960 | 0,0217 | |||
| VRTX / Vertex Pharmaceuticals Incorporated | 0,01 | 0,37 | 2,68 | −7,81 | 0,5898 | −0,1713 | |||
| QQQ / Invesco QQQ Trust, Series 1 | 0,00 | 4,71 | 2,27 | 23,19 | 0,4994 | 0,0172 | |||
| VTV / Vanguard Index Funds - Vanguard Value ETF | 0,01 | −2,57 | 1,89 | −0,32 | 0,4161 | −0,0803 | |||
| BRK.B / Berkshire Hathaway Inc. | 0,00 | −71,67 | 1,13 | −74,18 | 0,2485 | −0,8953 | |||
| JNJ / Johnson & Johnson | 0,01 | 0,00 | 1,10 | −7,95 | 0,2424 | −0,0706 | |||
| VOO / Vanguard Index Funds - Vanguard S&P 500 ETF | 0,00 | −16,38 | 1,09 | −7,61 | 0,2406 | −0,0690 | |||
| ABBV / AbbVie Inc. | 0,00 | −16,40 | 0,89 | −25,93 | 0,1969 | −0,1193 | |||
| PG / The Procter & Gamble Company | 0,01 | −0,45 | 0,89 | −6,93 | 0,1952 | −0,0543 | |||
| GOOGL / Alphabet Inc. | 0,00 | −9,51 | 0,59 | 3,14 | 0,1304 | −0,0200 | |||
| SCHB / Schwab Strategic Trust - Schwab U.S. Broad Market ETF | 0,02 | 0,11 | 0,57 | 10,64 | 0,1261 | −0,0093 | |||
| VTI / Vanguard Index Funds - Vanguard Total Stock Market ETF | 0,00 | −15,20 | 0,55 | −6,19 | 0,1202 | −0,0322 | |||
| XOM / Exxon Mobil Corporation | 0,00 | 0,00 | 0,52 | −9,44 | 0,1142 | −0,0356 | |||
| MCO / Moody's Corporation | 0,00 | 0,00 | 0,51 | 7,58 | 0,1126 | −0,0117 | |||
| NOC / Northrop Grumman Corporation | 0,00 | 0,00 | 0,49 | −2,40 | 0,1079 | −0,0235 | |||
| CSCO / Cisco Systems, Inc. | 0,01 | 0,00 | 0,48 | 12,44 | 0,1055 | −0,0061 | |||
| HD / The Home Depot, Inc. | 0,00 | −8,52 | 0,48 | −8,46 | 0,1048 | −0,0314 | |||
| PEP / PepsiCo, Inc. | 0,00 | −8,73 | 0,47 | −19,66 | 0,1045 | −0,0501 | |||
| DIS / The Walt Disney Company | 0,00 | 0,00 | 0,42 | 25,98 | 0,0918 | 0,0049 | |||
| MS / Morgan Stanley | 0,00 | 0,00 | 0,38 | 20,50 | 0,0843 | 0,0013 | |||
| GLD / SPDR Gold Trust | 0,00 | −52,73 | 0,37 | −49,93 | 0,0808 | −0,1114 | |||
| KBWB / Invesco Exchange-Traded Fund Trust II - Invesco KBW Bank ETF | 0,00 | 0,00 | 0,35 | 14,19 | 0,0763 | −0,0032 | |||
| MCD / McDonald's Corporation | 0,00 | 0,00 | 0,35 | −6,25 | 0,0760 | −0,0206 | |||
| VERSX / Vanguard Emerging Markets Stock Index Fund | 0,01 | −16,14 | 0,32 | −8,31 | 0,0705 | −0,0210 | |||
| HBAN / Huntington Bancshares Incorporated | 0,02 | 0,00 | 0,32 | 11,70 | 0,0694 | −0,0045 | |||
| FE / FirstEnergy Corp. | 0,01 | −39,53 | 0,31 | −39,92 | 0,0678 | −0,0661 | |||
| ABT / Abbott Laboratories | 0,00 | −39,36 | 0,30 | −37,78 | 0,0667 | −0,0609 | |||
| XLU / The Select Sector SPDR Trust - The Utilities Select Sector SPDR Fund | 0,00 | 0,00 | 0,30 | 3,51 | 0,0651 | −0,0097 | |||
| CMCSA / Comcast Corporation | 0,01 | 0,00 | 0,29 | −3,29 | 0,0649 | −0,0149 | |||
| XLK / The Select Sector SPDR Trust - The Technology Select Sector SPDR Fund | 0,00 | −0,87 | 0,29 | 21,52 | 0,0636 | 0,0014 | |||
| CAT / Caterpillar Inc. | 0,00 | 0,00 | 0,29 | 17,62 | 0,0632 | −0,0007 | |||
| XLY / The Select Sector SPDR Trust - The Consumer Discretionary Select Sector SPDR Fund | 0,00 | 0,00 | 0,29 | 10,42 | 0,0630 | −0,0051 | |||
| CVX / Chevron Corporation | 0,00 | 0,00 | 0,28 | −14,42 | 0,0616 | −0,0240 | |||
| UNP / Union Pacific Corporation | 0,00 | 0,00 | 0,28 | −2,47 | 0,0608 | −0,0134 | |||
| ITW / Illinois Tool Works Inc. | 0,00 | 0,00 | 0,26 | −0,39 | 0,0568 | −0,0110 | |||
| IBM / International Business Machines Corporation | 0,00 | 0,00 | 0,26 | 18,60 | 0,0563 | −0,0002 | |||
| SCHW / The Charles Schwab Corporation | 0,00 | 0,00 | 0,24 | 16,50 | 0,0530 | −0,0011 | |||
| NSC / Norfolk Southern Corporation | 0,00 | 0,00 | 0,22 | 8,37 | 0,0485 | −0,0049 | |||
| IWF / iShares Trust - iShares Russell 1000 Growth ETF | 0,00 | 0,21 | 0,0463 | 0,0463 | |||||
| XLC / The Select Sector SPDR Trust - The Communication Services Select Sector SPDR Fund | 0,00 | 0,21 | 0,0460 | 0,0460 | |||||
| KKR / KKR & Co. Inc. | 0,00 | −100,00 | 0,00 | 0,0000 |