Grunnleggende statistikk
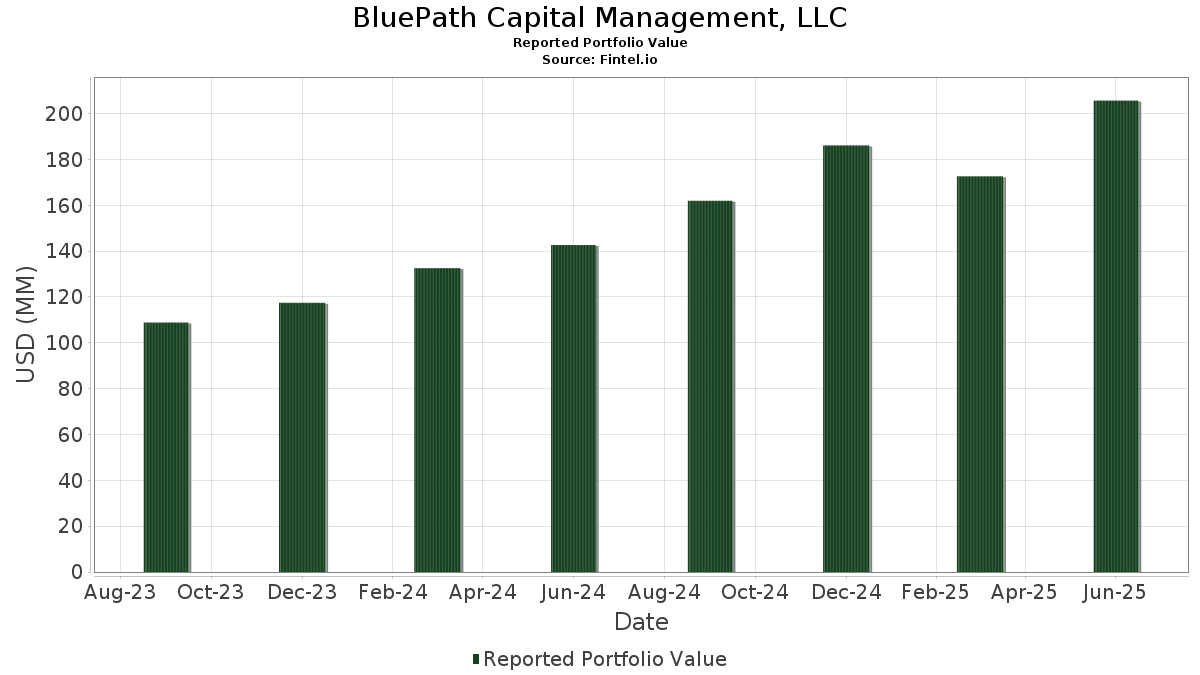
| Porteføljeverdi | $ 205 668 019 |
| Nåværende posisjoner | 98 |
Siste beholdninger, prestasjoner, forvaltet kapital (fra 13F, 13D)
BluePath Capital Management, LLC har oppgitt 98 totale beholdninger i sine siste SEC-arkiveringer. Siste porteføljeverdi er beregnet til 205 668 019 USD. Faktisk forvaltet kapital (AUM) er denne verdien pluss kontanter (som ikke er oppgitt). BluePath Capital Management, LLCs største beholdninger er Tidal Trust II - Nicholas Fixed Income Alternative ETF (US:FIAX) , Tidal Trust II - Nicholas Global Equity and Income ETF (US:GIAX) , Aflac Incorporated (US:AFL) , Tesla, Inc. (US:TSLA) , and The Home Depot, Inc. (US:HD) . BluePath Capital Management, LLCs nye posisjoner inkluderer Tidal Trust II - Nicholas Crypto Income ETF (US:BLOX) , Celestica Inc. (CA:CLS) , IonQ, Inc. (US:IONQ) , Celsius Holdings, Inc. (US:CELH) , and Dollar Tree, Inc. (US:DLTR) .
De største økningene dette kvartalet
Vi bruker endringen i porteføljeallokeringen fordi dette er det mest meningsfulle målet. Endringer kan skyldes handler eller endringer i aksjekursene.
| Verdipapirer | Aksjer (MM) |
Verdi (MM$) |
Portefølje % | ΔPortefølje % |
|---|---|---|---|---|
| 0,10 | 2,11 | 1,0279 | 1,0279 | |
| 0,01 | 1,51 | 0,7334 | 0,7334 | |
| 0,01 | 1,50 | 0,7290 | 0,7290 | |
| 0,03 | 1,42 | 0,6887 | 0,6887 | |
| 0,03 | 1,42 | 0,6881 | 0,6881 | |
| 0,01 | 1,31 | 0,6368 | 0,6368 | |
| 0,01 | 1,30 | 0,6298 | 0,6298 | |
| 0,02 | 1,10 | 0,5134 | 0,5134 | |
| 0,03 | 4,08 | 1,9852 | 0,4852 | |
| 0,01 | 1,38 | 0,6401 | 0,4692 |
De største reduksjonene dette kvartalet
Vi bruker endringen i porteføljeallokeringen fordi dette er det mest meningsfulle målet. Endringer kan skyldes handler eller endringer i aksjekurser.
| Verdipapirer | Aksjer (MM) |
Verdi (MM$) |
Portefølje % | ΔPortefølje % |
|---|---|---|---|---|
| 1,83 | 33,47 | 16,2745 | −2,7337 | |
| 0,08 | 7,96 | 3,8697 | −0,8529 | |
| 0,00 | 0,20 | 0,0978 | −0,6880 | |
| 0,01 | 4,49 | 2,1829 | −0,4277 | |
| 0,01 | 2,85 | 1,3870 | −0,3321 | |
| 0,01 | 0,46 | 0,2123 | −0,2573 | |
| 1,67 | 29,58 | 13,7529 | −0,2207 | |
| 0,04 | 2,61 | 1,2668 | −0,2203 | |
| 0,01 | 0,91 | 0,4409 | −0,2154 | |
| 0,02 | 0,57 | 0,2671 | −0,1825 |
13F- og Fondsarkiveringer
Dette skjemaet ble sendt inn den 2025-08-11 for rapporteringsperioden 2025-06-30. Klikk på lenkeikonet for å se hele transaksjonshistorikken.
Oppgradere for å låse opp premiedata og eksportere til Excel![]() .
.
| Verdipapirer | Type | Gjennomsnittlig aksjekurs | Aksjer (MM) |
ΔAksjer (%) |
ΔAksjer (%) |
Verdi ($MM) |
Portefølje (%) |
ΔPortefølje (%) |
|
|---|---|---|---|---|---|---|---|---|---|
| FIAX / Tidal Trust II - Nicholas Fixed Income Alternative ETF | 1,83 | 3,18 | 33,47 | 2,01 | 16,2745 | −2,7337 | |||
| GIAX / Tidal Trust II - Nicholas Global Equity and Income ETF | 1,67 | 13,55 | 29,58 | 22,61 | 13,7529 | −0,2207 | |||
| AFL / Aflac Incorporated | 0,08 | 2,93 | 7,96 | −2,38 | 3,8697 | −0,8529 | |||
| TSLA / Tesla, Inc. | 0,02 | 1,94 | 5,01 | 24,94 | 2,4383 | 0,1134 | |||
| HD / The Home Depot, Inc. | 0,01 | −0,41 | 4,49 | −0,38 | 2,1829 | −0,4277 | |||
| NVDA / NVIDIA Corporation | 0,03 | 8,17 | 4,08 | 57,67 | 1,9852 | 0,4852 | |||
| SPY / SPDR S&P 500 ETF | 0,01 | 18,41 | 4,06 | 30,82 | 1,9732 | 0,1757 | |||
| AMZN / Amazon.com, Inc. | 0,02 | 24,13 | 3,56 | 43,16 | 1,7293 | 0,2899 | |||
| MSFT / Microsoft Corporation | 0,01 | −0,70 | 3,39 | 31,56 | 1,6463 | 0,1557 | |||
| PLTR / Palantir Technologies Inc. | 0,02 | −24,06 | 3,03 | 22,67 | 1,4712 | 0,0421 | |||
| AAPL / Apple Inc. | 0,01 | 4,07 | 2,85 | −3,88 | 1,3870 | −0,3321 | |||
| META / Meta Platforms, Inc. | 0,00 | 1,43 | 2,61 | 29,92 | 1,2140 | 0,0497 | |||
| KO / The Coca-Cola Company | 0,04 | 2,73 | 2,61 | 1,48 | 1,2668 | −0,2203 | |||
| ABBV / AbbVie Inc. | 0,01 | 19,98 | 2,60 | 6,29 | 1,2666 | −0,1531 | |||
| NEE / NextEra Energy, Inc. | 0,04 | 16,86 | 2,45 | 14,41 | 1,1372 | −0,1008 | |||
| QQQ / Invesco QQQ Trust, Series 1 | 0,00 | 13,18 | 2,31 | 33,14 | 1,1215 | 0,1181 | |||
| AVGO / Broadcom Inc. | 0,01 | −6,57 | 2,30 | 53,78 | 1,1167 | 0,2518 | |||
| BLOX / Tidal Trust II - Nicholas Crypto Income ETF | 0,10 | 2,11 | 1,0279 | 1,0279 | |||||
| NFLX / Netflix, Inc. | 0,00 | −9,91 | 2,11 | 29,36 | 0,9794 | 0,0363 | |||
| HOOD / Robinhood Markets, Inc. | 0,02 | −18,80 | 2,03 | 82,70 | 0,9432 | 0,2999 | |||
| COST / Costco Wholesale Corporation | 0,00 | 1,18 | 1,94 | 5,88 | 0,9455 | −0,1182 | |||
| ZHDG / Tidal Trust I - ZEGA Buy & Hedge ETF | 0,08 | −6,90 | 1,81 | 2,49 | 0,8409 | −0,1814 | |||
| SPY / SPDR S&P 500 ETF | Call | 0,01 | −13,92 | 1,76 | 1,97 | 0,8551 | −0,1436 | ||
| JPM / JPMorgan Chase & Co. | 0,01 | 0,65 | 1,76 | 18,98 | 0,8536 | −0,0013 | |||
| APP / AppLovin Corporation | 0,00 | 20,66 | 1,68 | 59,39 | 0,8172 | 0,2065 | |||
| SOFI / SoFi Technologies, Inc. | 0,09 | 5,90 | 1,65 | 65,93 | 0,8005 | 0,2253 | |||
| V / Visa Inc. | 0,00 | 1,79 | 1,64 | 3,15 | 0,7612 | −0,1584 | |||
| GOOGL / Alphabet Inc. | 0,01 | 13,00 | 1,63 | 28,76 | 0,7947 | 0,0595 | |||
| CRWD / CrowdStrike Holdings, Inc. | 0,00 | −9,46 | 1,63 | 30,77 | 0,7937 | 0,0707 | |||
| ORCL / Oracle Corporation | 0,01 | 1,30 | 1,62 | 58,49 | 0,7855 | 0,1948 | |||
| UBER / Uber Technologies, Inc. | 0,02 | 3,62 | 1,56 | 32,79 | 0,7230 | 0,0442 | |||
| SPOT / Spotify Technology S.A. | 0,00 | 6,45 | 1,55 | 48,56 | 0,7514 | 0,1486 | |||
| SMCI / Super Micro Computer, Inc. | 0,03 | 17,54 | 1,52 | 68,29 | 0,7384 | 0,2155 | |||
| GSCE / GS Connect S&P GSCI Enhanced Commodity Total Return ETN | 0,00 | 10,17 | 1,52 | 42,71 | 0,7058 | 0,0897 | |||
| MS / Morgan Stanley | 0,01 | 10,53 | 1,51 | 33,48 | 0,7029 | 0,0467 | |||
| CLS / Celestica Inc. | 0,01 | 1,51 | 0,7334 | 0,7334 | |||||
| MSTR / Strategy Inc | 0,00 | −13,59 | 1,51 | 21,16 | 0,7323 | 0,0123 | |||
| AMD / Advanced Micro Devices, Inc. | 0,01 | 1,50 | 0,7290 | 0,7290 | |||||
| IBM / International Business Machines Corporation | 0,01 | 10,38 | 1,49 | 30,82 | 0,7269 | 0,0651 | |||
| CB / Chubb Limited | 0,01 | 7,33 | 1,49 | 2,97 | 0,6939 | −0,1457 | |||
| HIMS / Hims & Hers Health, Inc. | 0,03 | 7,29 | 1,48 | 81,07 | 0,6897 | 0,2150 | |||
| ETN / Eaton Corporation plc | 0,00 | 4,39 | 1,46 | 37,18 | 0,7105 | 0,0931 | |||
| WMT / Walmart Inc. | 0,01 | 3,56 | 1,46 | 15,27 | 0,7089 | −0,0234 | |||
| XOM / Exxon Mobil Corporation | 0,01 | 17,36 | 1,43 | 6,39 | 0,6661 | −0,1139 | |||
| CAT / Caterpillar Inc. | 0,00 | 2,72 | 1,42 | 20,87 | 0,6902 | 0,0100 | |||
| IONQ / IonQ, Inc. | 0,03 | 1,42 | 0,6887 | 0,6887 | |||||
| CELH / Celsius Holdings, Inc. | 0,03 | 1,42 | 0,6881 | 0,6881 | |||||
| CRM / Salesforce, Inc. | 0,01 | 22,12 | 1,40 | 24,11 | 0,6786 | 0,0271 | |||
| UPS / United Parcel Service, Inc. | 0,01 | 408,50 | 1,38 | 366,44 | 0,6401 | 0,4692 | |||
| BAC / Bank of America Corporation | 0,03 | 6,14 | 1,38 | 20,38 | 0,6692 | 0,0068 | |||
| ARES / Ares Management Corporation | 0,01 | 9,00 | 1,36 | 28,82 | 0,6319 | 0,0205 | |||
| CF / CF Industries Holdings, Inc. | 0,01 | 2,50 | 1,35 | 20,70 | 0,6579 | 0,0083 | |||
| XYZ / Block, Inc. | 0,02 | 11,55 | 1,34 | 39,52 | 0,6225 | 0,0665 | |||
| ABT / Abbott Laboratories | 0,01 | 6,37 | 1,32 | 9,08 | 0,6428 | −0,0594 | |||
| CYBR / CyberArk Software Ltd. | 0,00 | 9,29 | 1,31 | 31,63 | 0,6376 | 0,0602 | |||
| DLTR / Dollar Tree, Inc. | 0,01 | 1,31 | 0,6368 | 0,6368 | |||||
| ORLY / O'Reilly Automotive, Inc. | 0,01 | 1,30 | 0,6298 | 0,6298 | |||||
| VLO / Valero Energy Corporation | 0,01 | 11,92 | 1,26 | 13,87 | 0,6149 | −0,0282 | |||
| PM / Philip Morris International Inc. | 0,01 | 5,52 | 1,22 | 21,11 | 0,5943 | 0,0095 | |||
| MSTY / Tidal Trust II - YieldMaxTM MSTR Option Income Strategy ETF | 0,05 | 23,47 | 1,21 | 34,59 | 0,5648 | 0,0422 | |||
| MMM / 3M Company | 0,01 | 21,06 | 1,21 | 25,55 | 0,5624 | 0,0040 | |||
| BX / Blackstone Inc. | 0,01 | 31,38 | 1,20 | 40,68 | 0,5837 | 0,0891 | |||
| GSL / Global Ship Lease, Inc. | 0,05 | 20,85 | 1,20 | 39,19 | 0,5822 | 0,0837 | |||
| PLOW / Douglas Dynamics, Inc. | 0,04 | 22,18 | 1,19 | 55,01 | 0,5543 | 0,1088 | |||
| GILD / Gilead Sciences, Inc. | 0,01 | 21,73 | 1,18 | 20,51 | 0,5744 | 0,0062 | |||
| HYBL / SSGA Active Trust - SPDR Blackstone High Income ETF | 0,04 | 289,87 | 1,18 | 296,97 | 0,5483 | 0,3759 | |||
| BTI / British American Tobacco p.l.c. - Depositary Receipt (Common Stock) | 0,02 | 4,81 | 1,17 | 19,84 | 0,5453 | −0,0212 | |||
| AB / AllianceBernstein Holding L.P. - Limited Partnership | 0,03 | 22,14 | 1,16 | 30,30 | 0,5399 | 0,0232 | |||
| LNC / Lincoln National Corporation | 0,03 | 27,01 | 1,15 | 22,29 | 0,5606 | 0,0148 | |||
| PNC / The PNC Financial Services Group, Inc. | 0,01 | 27,57 | 1,14 | 35,31 | 0,5554 | 0,0663 | |||
| BMY / Bristol-Myers Squibb Company | 0,02 | 1,10 | 0,5134 | 0,5134 | |||||
| O / Realty Income Corporation | 0,02 | 24,99 | 1,08 | 24,11 | 0,5260 | 0,0211 | |||
| WES / Western Midstream Partners, LP - Limited Partnership | 0,03 | 28,53 | 1,08 | 21,44 | 0,5005 | −0,0130 | |||
| SO / The Southern Company | 0,01 | −19,86 | 0,91 | −19,96 | 0,4409 | −0,2154 | |||
| LMT / Lockheed Martin Corporation | 0,00 | −1,28 | 0,89 | 2,41 | 0,4337 | −0,0710 | |||
| SJNK / SPDR Series Trust - SPDR Bloomberg Short Term High Yield Bond ETF | 0,02 | −26,92 | 0,57 | −26,03 | 0,2671 | −0,1825 | |||
| SRLN / SSGA Active Trust - SPDR Blackstone Senior Loan ETF | 0,01 | −44,29 | 0,46 | −43,70 | 0,2123 | −0,2573 | |||
| IVV / iShares Trust - iShares Core S&P 500 ETF | 0,00 | −7,14 | 0,45 | 2,73 | 0,2103 | −0,0450 | |||
| VTI / Vanguard Index Funds - Vanguard Total Stock Market ETF | 0,00 | 21,35 | 0,41 | 34,31 | 0,1912 | 0,0137 | |||
| BRK.B / Berkshire Hathaway Inc. | 0,00 | −19,12 | 0,40 | −26,24 | 0,1958 | −0,1204 | |||
| TSM / Taiwan Semiconductor Manufacturing Company Limited - Depositary Receipt (Common Stock) | 0,00 | 14,91 | 0,38 | 57,08 | 0,1834 | 0,0440 | |||
| GLD / SPDR Gold Trust | 0,00 | −1,20 | 0,37 | 4,47 | 0,1823 | −0,0255 | |||
| GOOG / Alphabet Inc. | 0,00 | 55,18 | 0,35 | 76,50 | 0,1718 | 0,0556 | |||
| HPQ / HP Inc. | 0,01 | 0,27 | 0,33 | −11,50 | 0,1613 | −0,0557 | |||
| LLY / Eli Lilly and Company | 0,00 | −6,88 | 0,32 | −12,22 | 0,1540 | −0,0547 | |||
| TLNE / Talen Energy Corporation | 0,00 | 0,31 | 0,1496 | 0,1496 | |||||
| VST / Vistra Corp. | 0,00 | 0,31 | 0,1485 | 0,1485 | |||||
| RH / RH | 0,00 | 0,30 | 0,1476 | 0,1476 | |||||
| INTU / Intuit Inc. | 0,00 | 0,27 | 0,1331 | 0,1331 | |||||
| LCG / Northern Lights Fund Trust IV - Sterling Capital Focus Equity ETF | 0,01 | −2,75 | 0,23 | 11,06 | 0,1126 | −0,0085 | |||
| NBIS / Nebius Group N.V. | 0,00 | 0,23 | 0,1119 | 0,1119 | |||||
| TPHD / The Timothy Plan - Timothy Plan High Dividend Stock ETF | 0,01 | 0,00 | 0,23 | 0,89 | 0,1051 | −0,0252 | |||
| IWY / iShares Trust - iShares Russell Top 200 Growth ETF | 0,00 | 0,22 | 0,1045 | 0,1045 | |||||
| SPGI / S&P Global Inc. | 0,00 | −2,71 | 0,21 | 0,97 | 0,0969 | −0,0226 | |||
| CSCO / Cisco Systems, Inc. | 0,00 | −86,81 | 0,20 | −85,18 | 0,0978 | −0,6880 | |||
| TSLY / Tidal Trust II - YieldMax TSLA Option Income Strategy ETF | 0,01 | −4,41 | 0,11 | −5,00 | 0,0531 | −0,0167 | |||
| AFL / Aflac Incorporated | Call | 0,06 | 0,03 | 0,0141 | 0,0141 | ||||
| NAK / Northern Dynasty Minerals Ltd. | 0,02 | 0,00 | 0,03 | 17,39 | 0,0126 | −0,0009 | |||
| XPRO / Expro Group Holdings N.V. | 0,00 | −100,00 | 0,00 | −100,00 | −0,1385 | ||||
| MDT / Medtronic plc | 0,00 | −100,00 | 0,00 | 0,0000 | |||||
| NOW / ServiceNow, Inc. | 0,00 | −100,00 | 0,00 | 0,0000 | |||||
| QCOM / QUALCOMM Incorporated | 0,00 | −100,00 | 0,00 | 0,0000 | |||||
| GFL / GFL Environmental Inc. | 0,00 | −100,00 | 0,00 | 0,0000 | |||||
| PSX / Phillips 66 | 0,00 | −100,00 | 0,00 | 0,0000 | |||||
| SGOV / iShares Trust - iShares 0-3 Month Treasury Bond ETF | 0,00 | −100,00 | 0,00 | 0,0000 | |||||
| UNH / UnitedHealth Group Incorporated | 0,00 | −100,00 | 0,00 | 0,0000 | |||||
| YMAX / Tidal Trust II - YieldMax Universe Fund of Option Income ETFs | 0,00 | −100,00 | 0,00 | 0,0000 | |||||
| DAL / Delta Air Lines, Inc. | 0,00 | −100,00 | 0,00 | 0,0000 | |||||
| NVDY / Tidal Trust II - YieldMax NVDA Option Income Strategy ETF | 0,00 | −100,00 | 0,00 | 0,0000 | |||||
| NSA / National Storage Affiliates Trust | 0,00 | −100,00 | 0,00 | 0,0000 | |||||
| GJR / Strats Trust For Procter & Gambel Security - Preferred Security | 0,00 | −100,00 | 0,00 | 0,0000 |