Grunnleggende statistikk
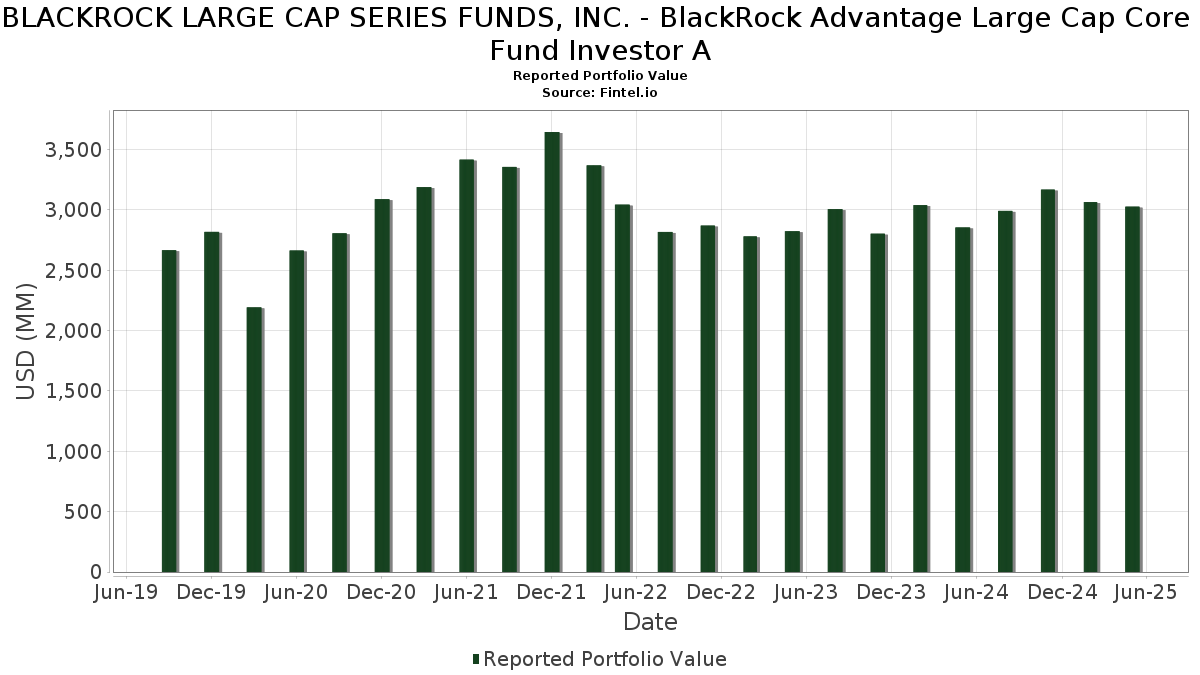
| Porteføljeverdi | $ 3 027 051 829 |
| Nåværende posisjoner | 99 |
Siste beholdninger, prestasjoner, forvaltet kapital (fra 13F, 13D)
BLACKROCK LARGE CAP SERIES FUNDS, INC. - BlackRock Advantage Large Cap Core Fund Investor A har oppgitt 99 totale beholdninger i sine siste SEC-arkiveringer. Siste porteføljeverdi er beregnet til 3 027 051 829 USD. Faktisk forvaltet kapital (AUM) er denne verdien pluss kontanter (som ikke er oppgitt). BLACKROCK LARGE CAP SERIES FUNDS, INC. - BlackRock Advantage Large Cap Core Fund Investor As største beholdninger er Microsoft Corporation (US:MSFT) , NVIDIA Corporation (US:NVDA) , Apple Inc. (US:AAPL) , Amazon.com, Inc. (US:AMZN) , and Meta Platforms, Inc. (US:META) . BLACKROCK LARGE CAP SERIES FUNDS, INC. - BlackRock Advantage Large Cap Core Fund Investor As nye posisjoner inkluderer Corning Incorporated (US:GLW) , Palantir Technologies Inc. (US:PLTR) , Elastic N.V. (US:ESTC) , .
De største økningene dette kvartalet
Vi bruker endringen i porteføljeallokeringen fordi dette er det mest meningsfulle målet. Endringer kan skyldes handler eller endringer i aksjekursene.
| Verdipapirer | Aksjer (MM) |
Verdi (MM$) |
Portefølje % | ΔPortefølje % |
|---|---|---|---|---|
| 0,44 | 36,23 | 1,1986 | 0,9316 | |
| 0,43 | 27,86 | 0,9216 | 0,8967 | |
| 0,48 | 42,15 | 1,3945 | 0,8930 | |
| 0,25 | 38,47 | 1,2725 | 0,8410 | |
| 0,11 | 25,06 | 0,8289 | 0,7857 | |
| 0,21 | 38,60 | 1,2770 | 0,7716 | |
| 0,43 | 21,30 | 0,7047 | 0,7047 | |
| 0,40 | 23,92 | 0,7912 | 0,6796 | |
| 0,15 | 17,38 | 0,5749 | 0,5506 | |
| 0,08 | 37,84 | 1,2519 | 0,5326 |
De største reduksjonene dette kvartalet
Vi bruker endringen i porteføljeallokeringen fordi dette er det mest meningsfulle målet. Endringer kan skyldes handler eller endringer i aksjekurser.
| Verdipapirer | Aksjer (MM) |
Verdi (MM$) |
Portefølje % | ΔPortefølje % |
|---|---|---|---|---|
| 0,05 | 14,07 | 0,4654 | −1,1168 | |
| 0,86 | 173,59 | 5,7427 | −1,0863 | |
| 0,01 | 28,42 | 0,9401 | −0,5822 | |
| 0,01 | 10,63 | 0,3516 | −0,5768 | |
| 0,22 | 20,00 | 0,6617 | −0,5747 | |
| 0,07 | 15,94 | 0,5273 | −0,5743 | |
| 0,14 | 23,47 | 0,7765 | −0,5480 | |
| 0,05 | 19,40 | 0,6418 | −0,5301 | |
| 0,11 | 20,59 | 0,6810 | −0,4914 | |
| 0,00 | 0,00 | −0,4602 |
13F- og Fondsarkiveringer
Dette skjemaet ble sendt inn den 2025-07-24 for rapporteringsperioden 2025-05-30. Klikk på lenkeikonet for å se hele transaksjonshistorikken.
Oppgradere for å låse opp premiedata og eksportere til Excel![]() .
.
| Verdipapirer | Type | Gjennomsnittlig aksjekurs | Aksjer (MM) |
ΔAksjer (%) |
ΔAksjer (%) |
Verdi ($MM) |
Portefølje (%) |
ΔPortefølje (%) |
|
|---|---|---|---|---|---|---|---|---|---|
| MSFT / Microsoft Corporation | 0,46 | −10,25 | 209,56 | 4,08 | 6,9326 | 0,3677 | |||
| NVDA / NVIDIA Corporation | 1,31 | −8,99 | 177,61 | −1,55 | 5,8754 | −0,0063 | |||
| AAPL / Apple Inc. | 0,86 | −0,21 | 173,59 | −17,12 | 5,7427 | −1,0863 | |||
| AMZN / Amazon.com, Inc. | 0,61 | −1,52 | 124,91 | −4,90 | 4,1321 | −0,1501 | |||
| META / Meta Platforms, Inc. | 0,14 | 4,82 | 88,58 | 1,57 | 2,9302 | 0,0871 | |||
| GOOGL / Alphabet Inc. | 0,45 | −1,34 | 77,63 | −0,49 | 2,5680 | 0,0244 | |||
| AVGO / Broadcom Inc. | 0,26 | 5,64 | 62,55 | 28,23 | 2,0694 | 0,4788 | |||
| HD / The Home Depot, Inc. | 0,15 | 16,35 | 55,33 | 8,05 | 1,8303 | 0,1608 | |||
| WMT / Walmart Inc. | 0,55 | −0,99 | 54,42 | −0,88 | 1,8002 | 0,0102 | |||
| BAC / Bank of America Corporation | 1,18 | 0,69 | 51,95 | −3,61 | 1,7186 | −0,0387 | |||
| COST / Costco Wholesale Corporation | 0,05 | 2,68 | 47,55 | 1,85 | 1,5728 | 0,0509 | |||
| GOOG / Alphabet Inc. | 0,27 | −0,74 | 46,30 | −0,37 | 1,5316 | 0,0164 | |||
| TSLA / Tesla, Inc. | 0,13 | −17,57 | 44,54 | −2,53 | 1,4734 | −0,0164 | |||
| MS / Morgan Stanley | 0,35 | 2,53 | 44,35 | −1,39 | 1,4673 | 0,0009 | |||
| MDT / Medtronic plc | 0,51 | 20,38 | 42,62 | 8,55 | 1,4098 | 0,1298 | |||
| SCHW / The Charles Schwab Corporation | 0,48 | 146,71 | 42,15 | 174,06 | 1,3945 | 0,8930 | |||
| MCO / Moody's Corporation | 0,08 | 22,35 | 39,40 | 16,38 | 1,3034 | 0,1996 | |||
| TRV / The Travelers Companies, Inc. | 0,14 | 4,52 | 39,19 | 59,54 | 1,2965 | 0,4154 | |||
| PM / Philip Morris International Inc. | 0,21 | 114,14 | 38,60 | 149,04 | 1,2770 | 0,7716 | |||
| CAH / Cardinal Health, Inc. | 0,25 | 143,66 | 38,47 | 190,64 | 1,2725 | 0,8410 | |||
| LMT / Lockheed Martin Corporation | 0,08 | 60,16 | 37,84 | 71,54 | 1,2519 | 0,5326 | |||
| JPM / JPMorgan Chase & Co. | 0,14 | 0,00 | 36,87 | −0,24 | 1,2198 | 0,0146 | |||
| ETR / Entergy Corporation | 0,44 | 567,52 | 36,23 | 378,12 | 1,1986 | 0,9316 | |||
| BSX / Boston Scientific Corporation | 0,34 | −38,58 | 36,01 | 19,85 | 1,1913 | 0,1878 | |||
| PFE / Pfizer Inc. | 1,52 | 45,19 | 35,71 | 29,04 | 1,1814 | 0,2791 | |||
| CTAS / Cintas Corporation | 0,15 | −13,58 | 34,84 | −5,67 | 1,1524 | −0,0516 | |||
| US09248U7182 / BlackRock Liquidity Funds: T-Fund, Institutional Shares | 34,28 | 17,81 | 34,28 | 17,81 | 1,1340 | 0,1853 | |||
| LLY / Eli Lilly and Company | 0,05 | 1,51 | 33,85 | −18,67 | 1,1199 | −0,2372 | |||
| EQIX / Equinix, Inc. | 0,04 | 75,73 | 33,09 | 87,20 | 1,0946 | 0,5041 | |||
| PNC / The PNC Financial Services Group, Inc. | 0,19 | 22,99 | 32,77 | 11,38 | 1,0841 | 0,1248 | |||
| ADSK / Autodesk, Inc. | 0,11 | 29,47 | 32,59 | 39,82 | 1,0781 | 0,3182 | |||
| CRM / Salesforce, Inc. | 0,11 | 21,18 | 30,32 | 27,66 | 1,0030 | 0,1511 | |||
| PH / Parker-Hannifin Corporation | 0,04 | −28,97 | 29,55 | −29,37 | 0,9776 | −0,3866 | |||
| ABBV / AbbVie Inc. | 0,16 | 65,83 | 29,26 | 47,65 | 0,9681 | 0,3219 | |||
| NFLX / Netflix, Inc. | 0,02 | 40,28 | 29,17 | 72,71 | 0,9650 | 0,4143 | |||
| BKNG / Booking Holdings Inc. | 0,01 | −44,68 | 28,42 | −39,14 | 0,9401 | −0,5822 | |||
| MRK / Merck & Co., Inc. | 0,36 | 38,94 | 28,04 | 15,73 | 0,9275 | 0,1376 | |||
| VTR / Ventas, Inc. | 0,43 | 2 751,76 | 27,86 | 3 840,45 | 0,9216 | 0,8967 | |||
| LRCX / Lam Research Corporation | 0,34 | 25,53 | 27,72 | 32,16 | 0,9168 | 0,2331 | |||
| CL / Colgate-Palmolive Company | 0,30 | −33,78 | 27,56 | −32,49 | 0,9118 | −0,4194 | |||
| V / Visa Inc. | 0,07 | −29,65 | 26,13 | −29,17 | 0,8646 | −0,3385 | |||
| LNG / Cheniere Energy, Inc. | 0,11 | 1 109,86 | 25,06 | 1 952,09 | 0,8289 | 0,7857 | |||
| ICE / Intercontinental Exchange, Inc. | 0,14 | −31,06 | 24,90 | −28,45 | 0,8237 | −0,3109 | |||
| DVN / Devon Energy Corporation | 0,82 | 11,49 | 24,89 | −6,86 | 0,8234 | −0,0478 | |||
| ADBE / Adobe Inc. | 0,06 | 5,73 | 24,32 | 0,08 | 0,8046 | 0,0122 | |||
| WMB / The Williams Companies, Inc. | 0,40 | 308,67 | 23,92 | 616,26 | 0,7912 | 0,6796 | |||
| SPG / Simon Property Group, Inc. | 0,14 | −34,06 | 23,47 | −42,22 | 0,7765 | −0,5480 | |||
| FLS / Flowserve Corporation | 0,46 | 94,90 | 22,73 | 76,74 | 0,7520 | 0,3326 | |||
| ETN / Eaton Corporation plc | 0,07 | −25,54 | 22,67 | −18,72 | 0,7500 | −0,1594 | |||
| BWA / BorgWarner Inc. | 0,68 | 73,24 | 22,59 | 92,57 | 0,7472 | 0,3648 | |||
| CMCSA / Comcast Corporation | 0,64 | −13,43 | 22,26 | −16,59 | 0,7365 | −0,1338 | |||
| BMY / Bristol-Myers Squibb Company | 0,45 | 77,77 | 21,67 | 71,83 | 0,7169 | 0,2956 | |||
| GLW / Corning Incorporated | 0,43 | 21,30 | 0,7047 | 0,7047 | |||||
| UNH / UnitedHealth Group Incorporated | 0,07 | 20,35 | 21,23 | −23,50 | 0,7022 | −0,2025 | |||
| RL / Ralph Lauren Corporation | 0,08 | 70,91 | 21,14 | 345,09 | 0,6994 | 0,5313 | |||
| PKG / Packaging Corporation of America | 0,11 | −36,85 | 20,59 | −42,75 | 0,6810 | −0,4914 | |||
| UBER / Uber Technologies, Inc. | 0,24 | −19,26 | 20,51 | −5,57 | 0,6785 | −0,0113 | |||
| APH / Amphenol Corporation | 0,22 | −60,94 | 20,00 | −47,25 | 0,6617 | −0,5747 | |||
| BRK.B / Berkshire Hathaway Inc. | 0,04 | 38,35 | 19,76 | 35,69 | 0,6538 | 0,1789 | |||
| MTZ / MasTec, Inc. | 0,13 | 64,77 | 19,72 | 96,75 | 0,6524 | 0,3256 | |||
| MSI / Motorola Solutions, Inc. | 0,05 | −42,80 | 19,40 | −46,03 | 0,6418 | −0,5301 | |||
| QCOM / QUALCOMM Incorporated | 0,13 | −31,99 | 18,32 | −37,17 | 0,6061 | −0,3447 | |||
| DIS / The Walt Disney Company | 0,15 | 2 074,99 | 17,38 | 2 415,05 | 0,5749 | 0,5506 | |||
| AMD / Advanced Micro Devices, Inc. | 0,16 | 13,87 | 17,22 | 26,27 | 0,5697 | 0,1250 | |||
| FDX / FedEx Corporation | 0,07 | −38,41 | 15,94 | −48,10 | 0,5273 | −0,5743 | |||
| MRVL / Marvell Technology, Inc. | 0,26 | 15,90 | 0,5261 | 0,5261 | |||||
| PLTR / Palantir Technologies Inc. | 0,12 | 15,89 | 0,5258 | 0,5258 | |||||
| EXPD / Expeditors International of Washington, Inc. | 0,14 | 9,01 | 15,87 | 4,71 | 0,5251 | 0,0309 | |||
| CME / CME Group Inc. | 0,05 | −50,81 | 15,71 | −43,98 | 0,5195 | −0,3946 | |||
| BIIB / Biogen Inc. | 0,12 | −15,25 | 15,70 | −21,71 | 0,5194 | −0,1345 | |||
| TRGP / Targa Resources Corp. | 0,10 | 63,84 | 15,05 | 200,00 | 0,4980 | 0,3304 | |||
| REGN / Regeneron Pharmaceuticals, Inc. | 0,03 | 284,75 | 15,04 | 128,97 | 0,4976 | 0,2620 | |||
| MA / Mastercard Incorporated | 0,03 | −24,33 | 14,88 | −23,11 | 0,4922 | −0,1387 | |||
| YUM / Yum! Brands, Inc. | 0,10 | 167,44 | 14,39 | 199,13 | 0,4760 | 0,3058 | |||
| PGR / The Progressive Corporation | 0,05 | −71,31 | 14,07 | −71,01 | 0,4654 | −1,1168 | |||
| FIX / Comfort Systems USA, Inc. | 0,03 | 11,45 | 13,97 | 46,70 | 0,4623 | 0,1517 | |||
| ESTC / Elastic N.V. | 0,16 | 13,14 | 0,4346 | 0,4346 | |||||
| BMRN / BioMarin Pharmaceutical Inc. | 0,22 | −3,16 | 13,02 | −20,97 | 0,4308 | −0,1065 | |||
| HAL / Halliburton Company | 0,61 | 2,66 | 11,87 | −23,73 | 0,3925 | −0,1147 | |||
| TOL / Toll Brothers, Inc. | 0,11 | 12,47 | 11,50 | 5,03 | 0,3803 | 0,0234 | |||
| DAL / Delta Air Lines, Inc. | 0,23 | −2,65 | 10,93 | −21,64 | 0,3616 | −0,0932 | |||
| NUE / Nucor Corporation | 0,10 | −42,56 | 10,76 | −54,31 | 0,3559 | −0,4117 | |||
| NOW / ServiceNow, Inc. | 0,01 | −65,68 | 10,63 | −62,68 | 0,3516 | −0,5768 | |||
| KO / The Coca-Cola Company | 0,15 | −63,89 | 10,49 | −56,63 | 0,3470 | −0,4532 | |||
| TXN / Texas Instruments Incorporated | 0,06 | 207,80 | 10,46 | 218,46 | 0,3459 | 0,2381 | |||
| NTRA / Natera, Inc. | 0,07 | 0,00 | 10,28 | 1,37 | 0,3401 | 0,0095 | |||
| CNC / Centene Corporation | 0,18 | −49,46 | 9,91 | −50,96 | 0,3280 | −0,3312 | |||
| INTU / Intuit Inc. | 0,01 | −50,09 | 9,59 | −41,40 | 0,3174 | −0,2026 | |||
| IVZ / Invesco Ltd. | 0,64 | −50,14 | 9,22 | −58,54 | 0,3050 | −0,4200 | |||
| FICO / Fair Isaac Corporation | 0,01 | −32,07 | 9,11 | −37,84 | 0,3013 | −0,1764 | |||
| UTHR / United Therapeutics Corporation | 0,03 | 27,56 | 9,06 | 27,09 | 0,2997 | 0,0673 | |||
| DHI / D.R. Horton, Inc. | 0,07 | −2,24 | 7,99 | −8,98 | 0,2645 | −0,0219 | |||
| DASH / DoorDash, Inc. | 0,03 | −71,77 | 5,83 | −70,32 | 0,1930 | −0,4479 | |||
| FCX / Freeport-McMoRan Inc. | 0,13 | −60,54 | 5,03 | −58,86 | 0,1665 | −0,2324 | |||
| S&P500 EMINI / DE (000000000) | 2,31 | 0,0765 | 0,0765 | ||||||
| SAIL / SailPoint, Inc. | 0,04 | 0,00 | 0,62 | −26,63 | 0,0205 | −0,0070 | |||
| FOX / Fox Corporation | 0,01 | 0,00 | 0,38 | −6,95 | 0,0124 | −0,0007 | |||
| IDCC / InterDigital, Inc. | 0,00 | 0,00 | 0,00 | 0,00 | 0,0000 | 0,0000 | |||
| RLJ / RLJ Lodging Trust | 0,00 | 0,00 | 0,00 | 0,0000 | −0,0000 | ||||
| DD / DuPont de Nemours, Inc. | 0,00 | −100,00 | 0,00 | −100,00 | −0,3475 | ||||
| FOXA / Fox Corporation | 0,00 | −100,00 | 0,00 | −100,00 | −0,3540 | ||||
| IRM / Iron Mountain Incorporated | 0,00 | −100,00 | 0,00 | −100,00 | −0,4602 | ||||
| ETSY / Etsy, Inc. | 0,00 | −100,00 | 0,00 | −100,00 | −0,3459 |