Grunnleggende statistikk
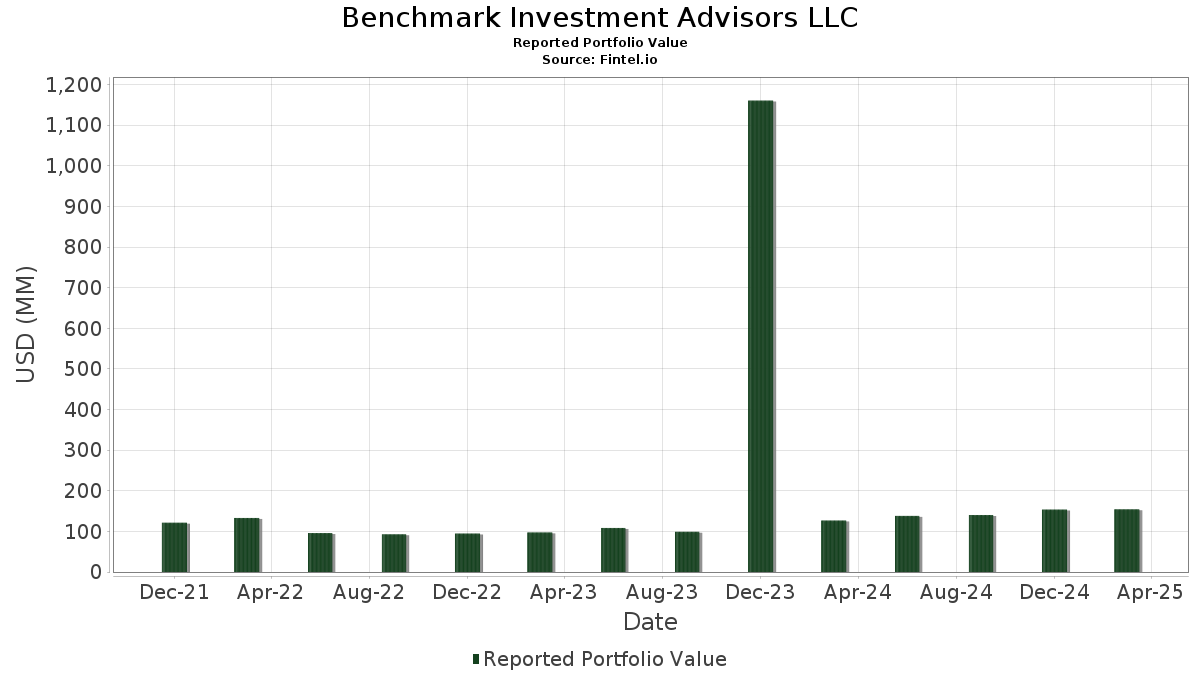
| Porteføljeverdi | $ 154 334 599 |
| Nåværende posisjoner | 86 |
Siste beholdninger, prestasjoner, forvaltet kapital (fra 13F, 13D)
Benchmark Investment Advisors LLC har oppgitt 86 totale beholdninger i sine siste SEC-arkiveringer. Siste porteføljeverdi er beregnet til 154 334 599 USD. Faktisk forvaltet kapital (AUM) er denne verdien pluss kontanter (som ikke er oppgitt). Benchmark Investment Advisors LLCs største beholdninger er NVIDIA Corporation (US:NVDA) , Meta Platforms, Inc. (US:META) , Microsoft Corporation (US:MSFT) , AppLovin Corporation (US:APP) , and Broadcom Inc. (US:AVGO) . Benchmark Investment Advisors LLCs nye posisjoner inkluderer CyberArk Software Ltd. (US:CYBR) , .
De største økningene dette kvartalet
Vi bruker endringen i porteføljeallokeringen fordi dette er det mest meningsfulle målet. Endringer kan skyldes handler eller endringer i aksjekursene.
| Verdipapirer | Aksjer (MM) |
Verdi (MM$) |
Portefølje % | ΔPortefølje % |
|---|---|---|---|---|
| 0,01 | 3,61 | 2,3412 | 1,1453 | |
| 0,03 | 2,21 | 1,4341 | 1,1229 | |
| 0,01 | 5,96 | 3,8589 | 1,0623 | |
| 0,01 | 4,27 | 2,7680 | 1,0139 | |
| 0,01 | 1,74 | 1,1273 | 0,8325 | |
| 0,00 | 1,39 | 0,9007 | 0,7091 | |
| 0,00 | 1,06 | 0,6893 | 0,6893 | |
| 0,00 | 1,03 | 0,6653 | 0,6653 | |
| 0,00 | 1,54 | 1,0009 | 0,6636 | |
| 0,02 | 4,74 | 3,0741 | 0,5741 |
De største reduksjonene dette kvartalet
Vi bruker endringen i porteføljeallokeringen fordi dette er det mest meningsfulle målet. Endringer kan skyldes handler eller endringer i aksjekurser.
| Verdipapirer | Aksjer (MM) |
Verdi (MM$) |
Portefølje % | ΔPortefølje % |
|---|---|---|---|---|
| 0,23 | 24,59 | 15,9348 | −4,9691 | |
| 0,00 | 2,95 | 1,9092 | −0,9687 | |
| 0,02 | 3,73 | 2,4166 | −0,9100 | |
| 0,02 | 5,64 | 3,6563 | −0,5830 | |
| 0,00 | 0,59 | 0,3818 | −0,5803 | |
| 0,04 | 2,86 | 1,8555 | −0,4060 | |
| 0,01 | 0,69 | 0,4440 | −0,3906 | |
| 0,00 | 1,06 | 0,6897 | −0,3733 | |
| 0,03 | 5,39 | 3,4946 | −0,3205 | |
| 0,00 | 2,36 | 1,5294 | −0,2990 |
13F- og Fondsarkiveringer
Dette skjemaet ble sendt inn den 2025-05-15 for rapporteringsperioden 2025-03-31. Klikk på lenkeikonet for å se hele transaksjonshistorikken.
Oppgradere for å låse opp premiedata og eksportere til Excel![]() .
.
| Verdipapirer | Type | Gjennomsnittlig aksjekurs | Aksjer (MM) |
ΔAksjer (%) |
ΔAksjer (%) |
Verdi ($MM) |
Portefølje (%) |
ΔPortefølje (%) |
|
|---|---|---|---|---|---|---|---|---|---|
| NVDA / NVIDIA Corporation | 0,23 | −5,14 | 24,59 | −23,44 | 15,9348 | −4,9691 | |||
| META / Meta Platforms, Inc. | 0,01 | 40,78 | 5,96 | 38,59 | 3,8589 | 1,0623 | |||
| MSFT / Microsoft Corporation | 0,02 | −2,74 | 5,64 | −13,37 | 3,6563 | −0,5830 | |||
| APP / AppLovin Corporation | 0,02 | 23,55 | 5,57 | 1,09 | 3,6087 | 0,0236 | |||
| AVGO / Broadcom Inc. | 0,03 | 27,38 | 5,39 | −8,00 | 3,4946 | −0,3205 | |||
| AMZN / Amazon.com, Inc. | 0,02 | 42,40 | 4,74 | 23,51 | 3,0741 | 0,5741 | |||
| GOOGL / Alphabet Inc. | 0,03 | 19,63 | 4,58 | −2,28 | 2,9686 | −0,0821 | |||
| V / Visa Inc. | 0,01 | 42,92 | 4,27 | 58,52 | 2,7680 | 1,0139 | |||
| URI / United Rentals, Inc. | 0,01 | 13,70 | 4,03 | 1,16 | 2,6092 | 0,0187 | |||
| PANW / Palo Alto Networks, Inc. | 0,02 | 32,07 | 3,84 | 23,83 | 2,4885 | 0,4705 | |||
| AAPL / Apple Inc. | 0,02 | −17,75 | 3,73 | −27,05 | 2,4166 | −0,9100 | |||
| CRWD / CrowdStrike Holdings, Inc. | 0,01 | 90,80 | 3,61 | 96,68 | 2,3412 | 1,1453 | |||
| TSM / Taiwan Semiconductor Manufacturing Company Limited - Depositary Receipt (Common Stock) | 0,02 | 3,88 | 3,05 | −12,68 | 1,9765 | −0,2969 | |||
| MA / Mastercard Incorporated | 0,01 | 2,13 | 3,00 | 6,31 | 1,9442 | 0,1077 | |||
| XPRO / Expro Group Holdings N.V. | 0,01 | 13,20 | 2,97 | 21,69 | 1,9271 | 0,3366 | |||
| FTXP / Foothills Exploration, Inc. | 0,00 | −38,24 | 2,95 | −33,38 | 1,9092 | −0,9687 | |||
| ANET / Arista Networks Inc | 0,04 | 62,51 | 2,89 | 13,94 | 1,8747 | 0,2220 | |||
| UBER / Uber Technologies, Inc. | 0,04 | −31,78 | 2,86 | −17,61 | 1,8555 | −0,4060 | |||
| JPM / JPMorgan Chase & Co. | 0,01 | 34,76 | 2,40 | 37,92 | 1,5582 | 0,4235 | |||
| EME / EMCOR Group, Inc. | 0,01 | 27,05 | 2,39 | 3,47 | 1,5457 | 0,0451 | |||
| ROP / Roper Technologies, Inc. | 0,00 | −25,92 | 2,36 | −15,98 | 1,5294 | −0,2990 | |||
| VRT / Vertiv Holdings Co | 0,03 | 628,30 | 2,21 | 362,97 | 1,4341 | 1,1229 | |||
| PH / Parker-Hannifin Corporation | 0,00 | −6,97 | 1,90 | −11,11 | 1,2295 | −0,1595 | |||
| AMAT / Applied Materials, Inc. | 0,01 | 7,88 | 1,80 | −3,69 | 1,1657 | −0,0505 | |||
| FIX / Comfort Systems USA, Inc. | 0,01 | 405,43 | 1,74 | 283,89 | 1,1273 | 0,8325 | |||
| CPRT / Copart, Inc. | 0,03 | 13,14 | 1,72 | 11,58 | 1,1113 | 0,1109 | |||
| NFLX / Netflix, Inc. | 0,00 | 29,99 | 1,69 | 35,99 | 1,0949 | 0,2863 | |||
| GWW / W.W. Grainger, Inc. | 0,00 | 14,47 | 1,60 | 7,23 | 1,0379 | 0,0663 | |||
| BKNG / Booking Holdings Inc. | 0,00 | 4,27 | 1,58 | −3,25 | 1,0213 | −0,0390 | |||
| AZO / AutoZone, Inc. | 0,00 | 7,55 | 1,57 | 28,07 | 1,0203 | 0,2202 | |||
| SPOT / Spotify Technology S.A. | 0,00 | 142,36 | 1,54 | 198,07 | 1,0009 | 0,6636 | |||
| NOW / ServiceNow, Inc. | 0,00 | 61,44 | 1,53 | 21,28 | 0,9935 | 0,1705 | |||
| SPGI / S&P Global Inc. | 0,00 | 362,94 | 1,39 | 372,79 | 0,9007 | 0,7091 | |||
| BRO / Brown & Brown, Inc. | 0,01 | −35,63 | 1,32 | −21,52 | 0,8582 | −0,2399 | |||
| DVYE / iShares, Inc. - iShares Emerging Markets Dividend ETF | 0,05 | 5,57 | 1,29 | 11,47 | 0,8383 | 0,0835 | |||
| VOO / Vanguard Index Funds - Vanguard S&P 500 ETF | 0,00 | 0,37 | 1,25 | −4,27 | 0,8128 | −0,0401 | |||
| SNPS / Synopsys, Inc. | 0,00 | −4,91 | 1,19 | −15,98 | 0,7703 | −0,1504 | |||
| MRK / Merck & Co., Inc. | 0,01 | −5,06 | 1,18 | −14,35 | 0,7621 | −0,1314 | |||
| CRM / Salesforce, Inc. | 0,00 | 259,38 | 1,08 | 188,77 | 0,6999 | 0,4563 | |||
| UNH / UnitedHealth Group Incorporated | 0,00 | −37,07 | 1,06 | −34,84 | 0,6897 | −0,3733 | |||
| CYBR / CyberArk Software Ltd. | 0,00 | 1,06 | 0,6893 | 0,6893 | |||||
| TTWO / Take-Two Interactive Software, Inc. | 0,00 | 1,03 | 0,6653 | 0,6653 | |||||
| VGSN.X / Vanguard Specialized Funds - Vanguard Real Estate ETF | 0,01 | −5,14 | 0,98 | −3,64 | 0,6350 | −0,0264 | |||
| GE / General Electric Company | 0,00 | 0,00 | 0,95 | 19,92 | 0,6168 | 0,1006 | |||
| CDW / CDW Corporation | 0,01 | 0,02 | 0,93 | −7,93 | 0,6026 | −0,0545 | |||
| KRE / SPDR Series Trust - SPDR S&P Regional Banking ETF | 0,02 | −1,07 | 0,91 | −6,88 | 0,5883 | −0,0457 | |||
| HD / The Home Depot, Inc. | 0,00 | −10,95 | 0,86 | −16,09 | 0,5544 | −0,1091 | |||
| IVE / iShares Trust - iShares S&P 500 Value ETF | 0,00 | −3,99 | 0,78 | −4,04 | 0,5080 | −0,0241 | |||
| ELV / Elevance Health, Inc. | 0,00 | −24,47 | 0,78 | −11,02 | 0,5028 | −0,0641 | |||
| WELL / Welltower Inc. | 0,01 | 0,00 | 0,78 | 21,66 | 0,5023 | 0,0873 | |||
| RSP / Invesco Exchange-Traded Fund Trust - Invesco S&P 500 Equal Weight ETF | 0,00 | −0,23 | 0,75 | −1,32 | 0,4861 | −0,0088 | |||
| JPC / Nuveen Preferred & Income Opportunities Fund | 0,09 | 0,00 | 0,70 | 1,30 | 0,4539 | 0,0038 | |||
| LRCX / Lam Research Corporation | 0,01 | −46,91 | 0,69 | −46,57 | 0,4440 | −0,3906 | |||
| BRK.A / Berkshire Hathaway Inc. | 0,00 | 0,00 | 0,68 | 17,47 | 0,4403 | 0,0640 | |||
| IWM / iShares Trust - iShares Russell 2000 ETF | 0,00 | −30,79 | 0,67 | −37,59 | 0,4373 | −0,2656 | |||
| INDA / iShares Trust - iShares MSCI India ETF | 0,01 | −7,25 | 0,66 | −9,37 | 0,4270 | −0,0458 | |||
| OXY / Occidental Petroleum Corporation | 0,01 | −4,62 | 0,61 | −4,67 | 0,3966 | −0,0214 | |||
| MCK / McKesson Corporation | 0,00 | −24,19 | 0,60 | −10,43 | 0,3896 | −0,0472 | |||
| GOOG / Alphabet Inc. | 0,00 | −51,42 | 0,59 | −60,15 | 0,3818 | −0,5803 | |||
| NTNX / Nutanix, Inc. | 0,01 | 34,64 | 0,58 | 53,83 | 0,3778 | 0,1308 | |||
| FCX / Freeport-McMoRan Inc. | 0,02 | −6,10 | 0,58 | −6,57 | 0,3778 | −0,0286 | |||
| PUT 100 INVESCO QQQ TR UNIT SER 1 EXP 06-20-25 @474.78 / PUT (99QA4017W) | 0,00 | 0,58 | 0,0000 | ||||||
| HSY / The Hershey Company | 0,00 | 0,51 | 0,3325 | 0,3325 | |||||
| ASML / ASML Holding N.V. - Depositary Receipt (Common Stock) | 0,00 | −28,75 | 0,45 | −31,97 | 0,2916 | −0,1383 | |||
| IAU / iShares Gold Trust | 0,01 | −2,52 | 0,43 | 16,09 | 0,2810 | 0,0379 | |||
| CDNS / Cadence Design Systems, Inc. | 0,00 | −12,11 | 0,42 | −25,61 | 0,2752 | −0,0963 | |||
| O / Realty Income Corporation | 0,01 | 0,00 | 0,42 | 8,53 | 0,2727 | 0,0205 | |||
| JNJ / Johnson & Johnson | 0,00 | −10,48 | 0,40 | 2,59 | 0,2571 | 0,0056 | |||
| ADI / Analog Devices, Inc. | 0,00 | −9,04 | 0,40 | −13,76 | 0,2563 | −0,0418 | |||
| ACN / Accenture plc | 0,00 | 22,30 | 0,39 | 8,38 | 0,2518 | 0,0187 | |||
| NHI / National Health Investors, Inc. | 0,01 | 0,00 | 0,37 | 6,65 | 0,2393 | 0,0138 | |||
| GEV / GE Vernova Inc. | 0,00 | 0,00 | 0,36 | −7,18 | 0,2350 | −0,0193 | |||
| NKE / NIKE, Inc. | 0,01 | 0,36 | 0,2344 | 0,2344 | |||||
| VIG / Vanguard Specialized Funds - Vanguard Dividend Appreciation ETF | 0,00 | 0,11 | 0,35 | −0,85 | 0,2259 | −0,0028 | |||
| LTC / LTC Properties, Inc. | 0,01 | 0,00 | 0,32 | 2,59 | 0,2060 | 0,0044 | |||
| FTNT / Fortinet, Inc. | 0,00 | −0,61 | 0,31 | 1,30 | 0,2018 | 0,0016 | |||
| PFF / iShares Trust - iShares Preferred and Income Securities ETF | 0,01 | −7,77 | 0,31 | −9,71 | 0,1990 | −0,0227 | |||
| CSCO / Cisco Systems, Inc. | 0,00 | −7,01 | 0,30 | −2,94 | 0,1925 | −0,0070 | |||
| ADBE / Adobe Inc. | 0,00 | −48,59 | 0,28 | −55,70 | 0,1817 | −0,2298 | |||
| TMO / Thermo Fisher Scientific Inc. | 0,00 | −11,26 | 0,27 | −15,36 | 0,1753 | −0,0324 | |||
| VRTX / Vertex Pharmaceuticals Incorporated | 0,00 | −95,52 | 0,27 | −94,68 | 0,1747 | −0,2610 | |||
| IWB / iShares Trust - iShares Russell 1000 ETF | 0,00 | 0,00 | 0,26 | −4,80 | 0,1673 | −0,0092 | |||
| ISRG / Intuitive Surgical, Inc. | 0,00 | 3,18 | 0,26 | −1,91 | 0,1666 | −0,0044 | |||
| SYK / Stryker Corporation | 0,00 | 0,00 | 0,23 | 3,17 | 0,1482 | 0,0044 | |||
| XLV / The Select Sector SPDR Trust - The Health Care Select Sector SPDR Fund | 0,00 | −15,66 | 0,21 | −10,46 | 0,1391 | −0,0170 | |||
| LLY / Eli Lilly and Company | 0,00 | 0,21 | 0,1333 | 0,1333 | |||||
| RELX / RELX PLC - Depositary Receipt (Common Stock) | 0,00 | −100,00 | 0,00 | 0,0000 | |||||
| ORCL / Oracle Corporation | 0,00 | −100,00 | 0,00 | −100,00 | −0,1565 | ||||
| SRPT / Sarepta Therapeutics, Inc. | 0,00 | −100,00 | 0,00 | 0,0000 | |||||
| XLE / The Select Sector SPDR Trust - The Energy Select Sector SPDR Fund | 0,00 | −100,00 | 0,00 | 0,0000 | |||||
| EA / Electronic Arts Inc. | 0,00 | −100,00 | 0,00 | 0,0000 | |||||
| QQQ / Invesco QQQ Trust, Series 1 | 0,00 | −100,00 | 0,00 | 0,0000 | |||||
| CCFLU / CCF Holdings LLC | 0,00 | −100,00 | 0,00 | 0,0000 |