Grunnleggende statistikk
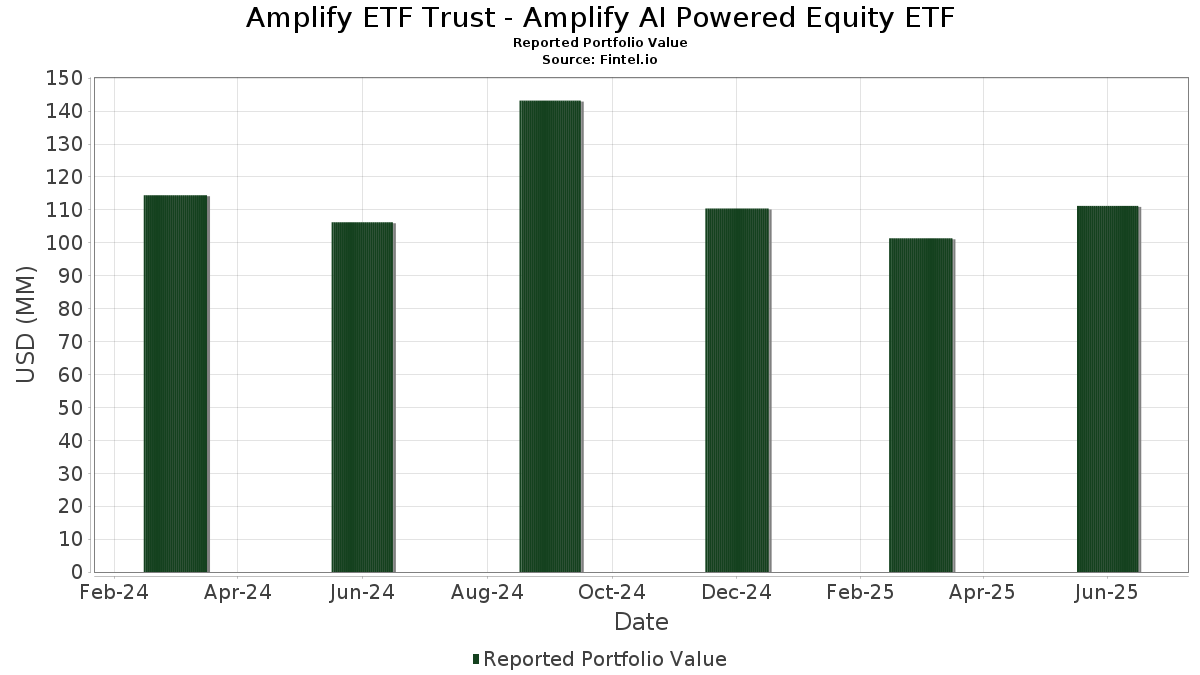
| Porteføljeverdi | $ 111 215 645 |
| Nåværende posisjoner | 152 |
Siste beholdninger, prestasjoner, forvaltet kapital (fra 13F, 13D)
Amplify ETF Trust - Amplify AI Powered Equity ETF har oppgitt 152 totale beholdninger i sine siste SEC-arkiveringer. Siste porteføljeverdi er beregnet til 111 215 645 USD. Faktisk forvaltet kapital (AUM) er denne verdien pluss kontanter (som ikke er oppgitt). Amplify ETF Trust - Amplify AI Powered Equity ETFs største beholdninger er Microsoft Corporation (US:MSFT) , NVIDIA Corporation (US:NVDA) , Apple Inc. (US:AAPL) , Amazon.com, Inc. (US:AMZN) , and Meta Platforms, Inc. (US:META) . Amplify ETF Trust - Amplify AI Powered Equity ETFs nye posisjoner inkluderer Vertiv Holdings Co (US:VRT) , AbbVie Inc. (US:ABBV) , Humana Inc. (US:HUM) , AT&T Inc. (US:T) , and Dollar General Corporation (US:DG) .
De største økningene dette kvartalet
Vi bruker endringen i porteføljeallokeringen fordi dette er det mest meningsfulle målet. Endringer kan skyldes handler eller endringer i aksjekursene.
| Verdipapirer | Aksjer (MM) |
Verdi (MM$) |
Portefølje % | ΔPortefølje % |
|---|---|---|---|---|
| 0,01 | 6,36 | 5,7164 | 5,7164 | |
| 0,04 | 6,23 | 5,6065 | 2,9990 | |
| 0,02 | 4,33 | 3,8893 | 2,8245 | |
| 0,01 | 3,75 | 3,3690 | 2,6578 | |
| 0,02 | 4,85 | 4,3634 | 2,5946 | |
| 0,01 | 2,88 | 2,5858 | 2,0175 | |
| 0,01 | 2,56 | 2,2990 | 1,8451 | |
| 0,02 | 3,07 | 2,7568 | 1,8350 | |
| 0,01 | 2,76 | 2,4800 | 1,7525 | |
| 0,02 | 2,23 | 2,0020 | 1,6392 |
De største reduksjonene dette kvartalet
Vi bruker endringen i porteføljeallokeringen fordi dette er det mest meningsfulle målet. Endringer kan skyldes handler eller endringer i aksjekurser.
| Verdipapirer | Aksjer (MM) |
Verdi (MM$) |
Portefølje % | ΔPortefølje % |
|---|---|---|---|---|
| 0,01 | 0,81 | 0,7319 | −5,7535 | |
| 0,00 | 1,49 | 1,3391 | −4,8619 | |
| 0,00 | 0,00 | −3,8176 | ||
| 0,00 | 0,00 | −3,8176 | ||
| 0,00 | 0,00 | −3,8176 | ||
| 0,00 | 0,00 | −3,8176 | ||
| 0,02 | 0,66 | 0,5917 | −3,7207 | |
| 0,00 | 0,26 | 0,2368 | −3,6816 | |
| 0,00 | 0,63 | 0,5701 | −2,7441 | |
| 0,00 | 0,46 | 0,4126 | −2,5551 |
13F- og Fondsarkiveringer
Dette skjemaet ble sendt inn den 2025-08-27 for rapporteringsperioden 2025-06-30. Klikk på lenkeikonet for å se hele transaksjonshistorikken.
Oppgradere for å låse opp premiedata og eksportere til Excel![]() .
.
| Verdipapirer | Type | Gjennomsnittlig aksjekurs | Aksjer (MM) |
ΔAksjer (%) |
ΔAksjer (%) |
Verdi ($MM) |
Portefølje (%) |
ΔPortefølje (%) |
|
|---|---|---|---|---|---|---|---|---|---|
| MSFT / Microsoft Corporation | 0,01 | 6,36 | 5,7164 | 5,7164 | |||||
| NVDA / NVIDIA Corporation | 0,04 | 61,80 | 6,23 | 135,87 | 5,6065 | 2,9990 | |||
| AAPL / Apple Inc. | 0,02 | 192,99 | 4,85 | 170,61 | 4,3634 | 2,5946 | |||
| AMZN / Amazon.com, Inc. | 0,02 | 247,51 | 4,33 | 300,83 | 3,8893 | 2,8245 | |||
| META / Meta Platforms, Inc. | 0,01 | 305,76 | 3,75 | 419,56 | 3,3690 | 2,6578 | |||
| PLTR / Palantir Technologies Inc. | 0,02 | 103,12 | 3,07 | 228,16 | 2,7568 | 1,8350 | |||
| AVGO / Broadcom Inc. | 0,01 | 203,17 | 2,88 | 399,13 | 2,5858 | 2,0175 | |||
| TSLA / Tesla, Inc. | 0,01 | 205,06 | 2,76 | 274,08 | 2,4800 | 1,7525 | |||
| BRK.B / Berkshire Hathaway Inc. | 0,01 | 509,14 | 2,56 | 455,65 | 2,2990 | 1,8451 | |||
| GOOGL / Alphabet Inc. | 0,01 | 240,41 | 2,41 | 287,92 | 2,1665 | 1,5539 | |||
| XOM / Exxon Mobil Corporation | 0,02 | 567,92 | 2,23 | 506,54 | 2,0020 | 1,6392 | |||
| COST / Costco Wholesale Corporation | 0,00 | 550,60 | 2,14 | 583,07 | 1,9228 | 1,6131 | |||
| AL / Air Lease Corporation | 0,03 | −49,33 | 1,93 | −38,66 | 1,7313 | −1,3643 | |||
| JPM / JPMorgan Chase & Co. | 0,01 | 288,15 | 1,91 | 358,65 | 1,7162 | 1,3058 | |||
| MSTR / Strategy Inc | 0,00 | 106,76 | 1,72 | 190,20 | 1,5452 | 0,9606 | |||
| LLY / Eli Lilly and Company | 0,00 | 226,29 | 1,58 | 207,81 | 1,4181 | 0,9130 | |||
| NFLX / Netflix, Inc. | 0,00 | −83,50 | 1,49 | −76,31 | 1,3391 | −4,8619 | |||
| V / Visa Inc. | 0,00 | 1,43 | 1,2854 | 1,2854 | |||||
| WMT / Walmart Inc. | 0,01 | 200,32 | 1,39 | 234,38 | 1,2514 | 0,8410 | |||
| HOOD / Robinhood Markets, Inc. | 0,01 | −67,12 | 1,37 | −26,04 | 1,2341 | −0,5960 | |||
| VMI / Valmont Industries, Inc. | 0,00 | −48,94 | 1,28 | −41,57 | 1,1532 | −1,0118 | |||
| MA / Mastercard Incorporated | 0,00 | 149,41 | 1,19 | 166,44 | 1,0713 | 0,6660 | |||
| CRWD / CrowdStrike Holdings, Inc. | 0,00 | −41,64 | 0,92 | −15,70 | 0,8262 | −0,2488 | |||
| PG / The Procter & Gamble Company | 0,01 | 240,99 | 0,89 | 218,71 | 0,7973 | 0,5229 | |||
| JNJ / Johnson & Johnson | 0,01 | 208,37 | 0,88 | 184,14 | 0,7895 | 0,4846 | |||
| HD / The Home Depot, Inc. | 0,00 | 180,07 | 0,87 | 180,84 | 0,7784 | 0,4737 | |||
| MCHP / Microchip Technology Incorporated | 0,01 | 601,80 | 0,85 | 926,51 | 0,7665 | 0,6841 | |||
| ORCL / Oracle Corporation | 0,00 | 100,59 | 0,82 | 213,79 | 0,7371 | 0,4793 | |||
| NEE / NextEra Energy, Inc. | 0,01 | −87,36 | 0,81 | −87,63 | 0,7319 | −5,7535 | |||
| VRT / Vertiv Holdings Co | 0,01 | 0,81 | 0,7317 | 0,7317 | |||||
| APP / AppLovin Corporation | 0,00 | 368,62 | 0,81 | 523,08 | 0,7288 | 0,5997 | |||
| ABBV / AbbVie Inc. | 0,00 | 0,78 | 0,6980 | 0,6980 | |||||
| KO / The Coca-Cola Company | 0,01 | 107,01 | 0,74 | 104,72 | 0,6633 | 0,3075 | |||
| BAC / Bank of America Corporation | 0,02 | 180,07 | 0,73 | 218,78 | 0,6567 | 0,4298 | |||
| ELV / Elevance Health, Inc. | 0,00 | 504,62 | 0,71 | 443,51 | 0,6408 | 0,5108 | |||
| CRM / Salesforce, Inc. | 0,00 | 207,63 | 0,69 | 213,12 | 0,6231 | 0,4044 | |||
| HUM / Humana Inc. | 0,00 | 0,68 | 0,6114 | 0,6114 | |||||
| PM / Philip Morris International Inc. | 0,00 | −57,74 | 0,68 | −51,57 | 0,6106 | −0,7708 | |||
| UNH / UnitedHealth Group Incorporated | 0,00 | 229,29 | 0,68 | 95,94 | 0,6088 | 0,2683 | |||
| CSCO / Cisco Systems, Inc. | 0,01 | 0,67 | 0,5997 | 0,5997 | |||||
| SLB / Schlumberger Limited | 0,02 | −81,39 | 0,66 | −84,97 | 0,5917 | −3,7207 | |||
| IBM / International Business Machines Corporation | 0,00 | 90,56 | 0,65 | 126,30 | 0,5885 | 0,3027 | |||
| GE / General Electric Company | 0,00 | −85,33 | 0,63 | −81,16 | 0,5701 | −2,7441 | |||
| WFC / Wells Fargo & Company | 0,01 | 162,16 | 0,61 | 192,82 | 0,5506 | 0,3442 | |||
| OKTA / Okta, Inc. | 0,01 | 207,22 | 0,60 | 191,67 | 0,5355 | 0,3343 | |||
| MCD / McDonald's Corporation | 0,00 | 214,17 | 0,58 | 193,88 | 0,5184 | 0,3249 | |||
| ABT / Abbott Laboratories | 0,00 | 167,71 | 0,56 | 175,25 | 0,5000 | 0,3002 | |||
| CVX / Chevron Corporation | 0,00 | 180,48 | 0,55 | 140,43 | 0,4977 | 0,2703 | |||
| T / AT&T Inc. | 0,02 | 0,55 | 0,4966 | 0,4966 | |||||
| AMD / Advanced Micro Devices, Inc. | 0,00 | 136,40 | 0,54 | 228,22 | 0,4814 | 0,3197 | |||
| DG / Dollar General Corporation | 0,00 | 0,53 | 0,4736 | 0,4736 | |||||
| GS / The Goldman Sachs Group, Inc. | 0,00 | 117,54 | 0,53 | 182,80 | 0,4735 | 0,2892 | |||
| DIS / The Walt Disney Company | 0,00 | 0,53 | 0,4733 | 0,4733 | |||||
| LIN / Linde plc | 0,00 | 136,29 | 0,53 | 138,64 | 0,4725 | 0,2548 | |||
| CVNA / Carvana Co. | 0,00 | −79,71 | 0,52 | −67,30 | 0,4642 | −1,0934 | |||
| NOW / ServiceNow, Inc. | 0,00 | 145,73 | 0,50 | 139,05 | 0,4521 | 0,2610 | |||
| INTU / Intuit Inc. | 0,00 | 0,49 | 0,4398 | 0,4398 | |||||
| MRK / Merck & Co., Inc. | 0,01 | 175,10 | 0,49 | 143,00 | 0,4373 | 0,2396 | |||
| UBER / Uber Technologies, Inc. | 0,01 | −44,12 | 0,47 | −28,40 | 0,4221 | −0,2250 | |||
| TTD / The Trade Desk, Inc. | 0,01 | −65,10 | 0,47 | −77,09 | 0,4201 | −1,0087 | |||
| RTX / RTX Corporation | 0,00 | −88,91 | 0,46 | −86,02 | 0,4126 | −2,5551 | |||
| ISRG / Intuitive Surgical, Inc. | 0,00 | 158,88 | 0,45 | 185,44 | 0,4061 | 0,2492 | |||
| PWR / Quanta Services, Inc. | 0,00 | 0,45 | 0,4025 | 0,4025 | |||||
| BKNG / Booking Holdings Inc. | 0,00 | 108,11 | 0,45 | 161,76 | 0,4009 | 0,2327 | |||
| CAT / Caterpillar Inc. | 0,00 | 124,01 | 0,44 | 163,86 | 0,3941 | 0,2302 | |||
| VZ / Verizon Communications Inc. | 0,01 | 160,45 | 0,44 | 148,30 | 0,3933 | 0,2196 | |||
| ACN / Accenture plc | 0,00 | 147,97 | 0,44 | 137,50 | 0,3932 | 0,2116 | |||
| ADBE / Adobe Inc. | 0,00 | 0,43 | 0,3883 | 0,3883 | |||||
| TXN / Texas Instruments Incorporated | 0,00 | 139,98 | 0,43 | 176,77 | 0,3867 | 0,2337 | |||
| PEP / PepsiCo, Inc. | 0,00 | 137,19 | 0,43 | 109,36 | 0,3824 | 0,1816 | |||
| QCOM / QUALCOMM Incorporated | 0,00 | 98,85 | 0,41 | 106,50 | 0,3716 | 0,1739 | |||
| MS / Morgan Stanley | 0,00 | 112,57 | 0,41 | 157,23 | 0,3683 | 0,2109 | |||
| AXP / American Express Company | 0,00 | 0,41 | 0,3657 | 0,3657 | |||||
| SPGI / S&P Global Inc. | 0,00 | 112,86 | 0,39 | 121,47 | 0,3532 | 0,1778 | |||
| BLK / BlackRock, Inc. | 0,00 | 0,38 | 0,3434 | 0,3434 | |||||
| BSX / Boston Scientific Corporation | 0,00 | 120,51 | 0,38 | 135,40 | 0,3416 | 0,1820 | |||
| PGR / The Progressive Corporation | 0,00 | 122,38 | 0,37 | 109,55 | 0,3362 | 0,1603 | |||
| SCHW / The Charles Schwab Corporation | 0,00 | 97,39 | 0,37 | 131,06 | 0,3348 | 0,1751 | |||
| HCA / HCA Healthcare, Inc. | 0,00 | 0,37 | 0,3342 | 0,3342 | |||||
| C / Citigroup Inc. | 0,00 | 87,68 | 0,36 | 125,00 | 0,3242 | 0,1662 | |||
| TMO / Thermo Fisher Scientific Inc. | 0,00 | 166,97 | 0,36 | 117,68 | 0,3212 | 0,1592 | |||
| HON / Honeywell International Inc. | 0,00 | 110,29 | 0,36 | 131,82 | 0,3210 | 0,1688 | |||
| BA / The Boeing Company | 0,00 | 40,89 | 0,35 | 72,91 | 0,3162 | 0,1158 | |||
| AMAT / Applied Materials, Inc. | 0,00 | 101,47 | 0,35 | 154,35 | 0,3157 | 0,1795 | |||
| TMUS / T-Mobile US, Inc. | 0,00 | −56,18 | 0,35 | −60,85 | 0,3147 | −0,5672 | |||
| AMGN / Amgen Inc. | 0,00 | 115,21 | 0,34 | 92,70 | 0,3091 | 0,1333 | |||
| GEV / GE Vernova Inc. | 0,00 | 0,34 | 0,3064 | 0,3064 | |||||
| COF / Capital One Financial Corporation | 0,00 | 0,33 | 0,3006 | 0,3006 | |||||
| NKE / NIKE, Inc. | 0,00 | −13,85 | 0,33 | −3,78 | 0,2985 | −0,0411 | |||
| UNP / Union Pacific Corporation | 0,00 | 0,33 | 0,2983 | 0,2983 | |||||
| ETN / Eaton Corporation plc | 0,00 | 106,47 | 0,33 | 172,73 | 0,2969 | 0,1768 | |||
| PFE / Pfizer Inc. | 0,01 | 134,43 | 0,33 | 125,52 | 0,2943 | 0,1504 | |||
| TJX / The TJX Companies, Inc. | 0,00 | 103,70 | 0,33 | 106,33 | 0,2938 | 0,1378 | |||
| PANW / Palo Alto Networks, Inc. | 0,00 | 82,64 | 0,32 | 119,05 | 0,2904 | 0,1449 | |||
| CMCSA / Comcast Corporation | 0,01 | 97,61 | 0,32 | 91,07 | 0,2893 | 0,1232 | |||
| SYK / Stryker Corporation | 0,00 | 0,32 | 0,2892 | 0,2892 | |||||
| GILD / Gilead Sciences, Inc. | 0,00 | 0,32 | 0,2874 | 0,2874 | |||||
| MU / Micron Technology, Inc. | 0,00 | −48,41 | 0,32 | −26,96 | 0,2857 | −0,1426 | |||
| MOH / Molina Healthcare, Inc. | 0,00 | 0,31 | 0,2789 | 0,2789 | |||||
| DE / Deere & Company | 0,00 | 0,31 | 0,2757 | 0,2757 | |||||
| ADP / Automatic Data Processing, Inc. | 0,00 | 0,30 | 0,2676 | 0,2676 | |||||
| LOW / Lowe's Companies, Inc. | 0,00 | 0,29 | 0,2632 | 0,2632 | |||||
| DHR / Danaher Corporation | 0,00 | 90,10 | 0,29 | 83,65 | 0,2627 | 0,1054 | |||
| LRCX / Lam Research Corporation | 0,00 | 106,64 | 0,29 | −75,41 | 0,2588 | −0,5597 | |||
| MMC / Marsh & McLennan Companies, Inc. | 0,00 | 0,28 | 0,2546 | 0,2546 | |||||
| KLAC / KLA Corporation | 0,00 | −60,88 | 0,28 | −48,43 | 0,2521 | −0,2844 | |||
| DLTR / Dollar Tree, Inc. | 0,00 | 0,28 | 0,2484 | 0,2484 | |||||
| ADI / Analog Devices, Inc. | 0,00 | 82,62 | 0,28 | 116,54 | 0,2474 | 0,1215 | |||
| APH / Amphenol Corporation | 0,00 | 135,65 | 0,27 | 234,57 | 0,2442 | 0,1708 | |||
| COP / ConocoPhillips | 0,00 | 107,36 | 0,27 | 77,63 | 0,2431 | 0,0926 | |||
| ANET / Arista Networks Inc | 0,00 | 0,27 | 0,2412 | 0,2412 | |||||
| VRTX / Vertex Pharmaceuticals Incorporated | 0,00 | 105,46 | 0,27 | 88,73 | 0,2410 | 0,1009 | |||
| MO / Altria Group, Inc. | 0,00 | 0,26 | 0,2380 | 0,2380 | |||||
| MOS / The Mosaic Company | 0,01 | 25,77 | 0,26 | 69,68 | 0,2371 | 0,0840 | |||
| CEG / Constellation Energy Corporation | 0,00 | −95,86 | 0,26 | −93,38 | 0,2368 | −3,6816 | |||
| MDT / Medtronic plc | 0,00 | 0,26 | 0,2359 | 0,2359 | |||||
| LMT / Lockheed Martin Corporation | 0,00 | −87,26 | 0,26 | −87,90 | 0,2320 | −1,6914 | |||
| BJ / BJ's Wholesale Club Holdings, Inc. | 0,00 | 0,25 | 0,2284 | 0,2284 | |||||
| NRG / NRG Energy, Inc. | 0,00 | 0,25 | 0,2271 | 0,2271 | |||||
| BX / Blackstone Inc. | 0,00 | 0,25 | 0,2269 | 0,2269 | |||||
| CB / Chubb Limited | 0,00 | 91,19 | 0,25 | 83,21 | 0,2261 | 0,0909 | |||
| WRB / W. R. Berkley Corporation | 0,00 | 0,25 | 0,2261 | 0,2261 | |||||
| ICE / Intercontinental Exchange, Inc. | 0,00 | 0,25 | 0,2217 | 0,2217 | |||||
| AMT / American Tower Corporation | 0,00 | 0,25 | 0,2210 | 0,2210 | |||||
| SBUX / Starbucks Corporation | 0,00 | −85,39 | 0,25 | −86,39 | 0,2210 | −1,5549 | |||
| MCK / McKesson Corporation | 0,00 | 0,24 | 0,2201 | 0,2201 | |||||
| SO / The Southern Company | 0,00 | 0,24 | 0,2187 | 0,2187 | |||||
| WM / Waste Management, Inc. | 0,00 | 0,24 | 0,2185 | 0,2185 | |||||
| CME / CME Group Inc. | 0,00 | −84,06 | 0,24 | −80,14 | 0,2119 | −0,6176 | |||
| PH / Parker-Hannifin Corporation | 0,00 | 167,20 | 0,23 | 269,84 | 0,2098 | 0,1496 | |||
| INTC / Intel Corporation | 0,01 | 20,88 | 0,23 | 19,07 | 0,2084 | 0,0167 | |||
| WELL / Welltower Inc. | 0,00 | 0,23 | 0,2071 | 0,2071 | |||||
| TT / Trane Technologies plc | 0,00 | 0,23 | 0,2065 | 0,2065 | |||||
| FI / Fiserv, Inc. | 0,00 | 0,23 | 0,2059 | 0,2059 | |||||
| CDNS / Cadence Design Systems, Inc. | 0,00 | 0,22 | 0,2017 | 0,2017 | |||||
| DUOL / Duolingo, Inc. | 0,00 | −67,35 | 0,22 | −56,98 | 0,2002 | −0,3092 | |||
| PLD / Prologis, Inc. | 0,00 | −84,58 | 0,22 | −84,73 | 0,1995 | −1,1112 | |||
| DUK / Duke Energy Corporation | 0,00 | 0,22 | 0,1994 | 0,1994 | |||||
| BMY / Bristol-Myers Squibb Company | 0,00 | 0,22 | 0,1987 | 0,1987 | |||||
| CI / The Cigna Group | 0,00 | 0,22 | 0,1947 | 0,1947 | |||||
| MMM / 3M Company | 0,00 | 0,21 | 0,1930 | 0,1930 | |||||
| AJG / Arthur J. Gallagher & Co. | 0,00 | 0,21 | 0,1917 | 0,1917 | |||||
| SNPS / Synopsys, Inc. | 0,00 | 0,21 | 0,1872 | 0,1872 | |||||
| KKR / KKR & Co. Inc. | 0,00 | 0,21 | 0,1864 | 0,1864 | |||||
| MDLZ / Mondelez International, Inc. | 0,00 | 0,21 | 0,1845 | 0,1845 | |||||
| CTAS / Cintas Corporation | 0,00 | 0,20 | 0,1840 | 0,1840 | |||||
| CL / Colgate-Palmolive Company | 0,00 | −86,78 | 0,20 | −86,81 | 0,1777 | −1,1760 | |||
| TDG / TransDigm Group Incorporated | 0,00 | −67,83 | 0,20 | −65,73 | 0,1764 | −0,2247 | |||
| SHW / The Sherwin-Williams Company | 0,00 | 0,19 | 0,1704 | 0,1704 | |||||
| ORLY / O'Reilly Automotive, Inc. | 0,00 | 571,79 | 0,19 | −57,85 | 0,1699 | −0,2710 | |||
| EQIX / Equinix, Inc. | 0,00 | 0,18 | 0,1624 | 0,1624 | |||||
| US8252528851 / Invesco Government & Agency Portfolio, Institutional Class | 0,16 | −12,30 | 0,16 | −12,64 | 0,1437 | −0,0360 | |||
| VLO / Valero Energy Corporation | 0,00 | −100,00 | 0,00 | −100,00 | −0,0958 | ||||
| TPR / Tapestry, Inc. | 0,00 | −100,00 | 0,00 | −100,00 | −0,4169 | ||||
| GTLB / GitLab Inc. | 0,00 | −100,00 | 0,00 | −100,00 | −0,6112 | ||||
| RITM / Rithm Capital Corp. | 0,00 | −100,00 | 0,00 | −100,00 | −0,1936 | ||||
| QRVO / Qorvo, Inc. | 0,00 | −100,00 | 0,00 | −100,00 | −0,6470 | ||||
| WBA / Walgreens Boots Alliance, Inc. | 0,00 | −100,00 | 0,00 | −100,00 | −0,2100 | ||||
| GWRE / Guidewire Software, Inc. | 0,00 | −100,00 | 0,00 | −100,00 | −1,2052 | ||||
| CRS / Carpenter Technology Corporation | 0,00 | −100,00 | 0,00 | −100,00 | −0,1256 | ||||
| NNN / NNN REIT, Inc. | 0,00 | −100,00 | 0,00 | −100,00 | −0,4502 | ||||
| SNX / TD SYNNEX Corporation | 0,00 | −100,00 | 0,00 | −100,00 | −0,1160 | ||||
| NOC / Northrop Grumman Corporation | 0,00 | −100,00 | 0,00 | −100,00 | −1,8571 | ||||
| FFIV / F5, Inc. | 0,00 | −100,00 | 0,00 | −100,00 | −0,1140 | ||||
| IOT / Samsara Inc. | 0,00 | −100,00 | 0,00 | −100,00 | −0,1655 | ||||
| NEM / Newmont Corporation | 0,00 | −100,00 | 0,00 | −100,00 | −3,8176 | ||||
| NEM / Newmont Corporation | 0,00 | −100,00 | 0,00 | −100,00 | −3,8176 | ||||
| ABG / Asbury Automotive Group, Inc. | 0,00 | −100,00 | 0,00 | −100,00 | −0,3172 | ||||
| NEM / Newmont Corporation | 0,00 | −100,00 | 0,00 | −100,00 | −3,8176 | ||||
| NEM / Newmont Corporation | 0,00 | −100,00 | 0,00 | −100,00 | −3,8176 | ||||
| ITCI / Intra-Cellular Therapies, Inc. | 0,00 | −100,00 | 0,00 | −100,00 | −0,5248 | ||||
| RBC / RBC Bearings Incorporated | 0,00 | −100,00 | 0,00 | −100,00 | −0,2108 | ||||
| ABNB / Airbnb, Inc. | 0,00 | −100,00 | 0,00 | −100,00 | −0,1021 | ||||
| TWLO / Twilio Inc. | 0,00 | −100,00 | 0,00 | −100,00 | −1,5491 | ||||
| IOT / Samsara Inc. | 0,00 | −100,00 | 0,00 | −100,00 | −0,1655 | ||||
| NUE / Nucor Corporation | 0,00 | −100,00 | 0,00 | −100,00 | −0,8010 | ||||
| NEU / NewMarket Corporation | 0,00 | −100,00 | 0,00 | −100,00 | −0,1598 | ||||
| SFM / Sprouts Farmers Market, Inc. | 0,00 | −100,00 | 0,00 | −100,00 | −0,8587 | ||||
| TRGP / Targa Resources Corp. | 0,00 | −100,00 | 0,00 | −100,00 | −0,1552 | ||||
| NWSA / News Corporation | 0,00 | −100,00 | 0,00 | −100,00 | −0,1640 | ||||
| SKY / Champion Homes, Inc. | 0,00 | −100,00 | 0,00 | −100,00 | −0,2290 | ||||
| 1NIS / NiSource Inc. | 0,00 | −100,00 | 0,00 | −100,00 | −1,2168 |