Grunnleggende statistikk
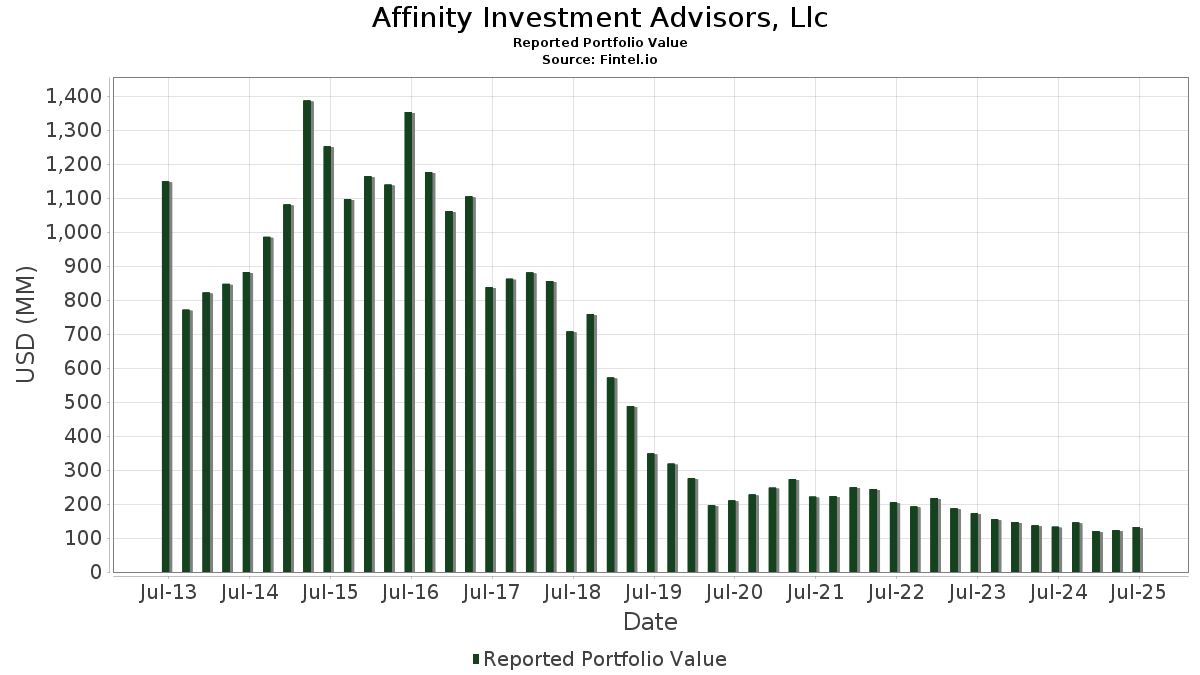
| Porteføljeverdi | $ 132 093 508 |
| Nåværende posisjoner | 133 |
Siste beholdninger, prestasjoner, forvaltet kapital (fra 13F, 13D)
Affinity Investment Advisors, Llc har oppgitt 133 totale beholdninger i sine siste SEC-arkiveringer. Siste porteføljeverdi er beregnet til 132 093 508 USD. Faktisk forvaltet kapital (AUM) er denne verdien pluss kontanter (som ikke er oppgitt). Affinity Investment Advisors, Llcs største beholdninger er Microsoft Corporation (US:MSFT) , JPMorgan Chase & Co. (US:JPM) , Cisco Systems, Inc. (US:CSCO) , Jabil Inc. (US:JBL) , and Bank of America Corporation (US:BAC) . Affinity Investment Advisors, Llcs nye posisjoner inkluderer Corning Incorporated (US:GLW) , Carvana Co. (US:CVNA) , Charter Communications, Inc. (US:CHTR) , Zoom Communications Inc. (US:ZM) , and Howmet Aerospace Inc. (US:HWM) .
De største økningene dette kvartalet
Vi bruker endringen i porteføljeallokeringen fordi dette er det mest meningsfulle målet. Endringer kan skyldes handler eller endringer i aksjekursene.
| Verdipapirer | Aksjer (MM) |
Verdi (MM$) |
Portefølje % | ΔPortefølje % |
|---|---|---|---|---|
| 0,01 | 3,11 | 2,3581 | 1,7836 | |
| 0,05 | 3,18 | 2,4111 | 1,2369 | |
| 0,03 | 1,49 | 1,1256 | 1,1256 | |
| 0,00 | 1,47 | 1,1130 | 1,1130 | |
| 0,02 | 2,30 | 1,7430 | 1,0289 | |
| 0,03 | 2,67 | 2,0209 | 0,9513 | |
| 0,01 | 2,10 | 1,5927 | 0,8083 | |
| 0,00 | 1,04 | 0,7863 | 0,7863 | |
| 0,01 | 6,36 | 4,8177 | 0,7844 | |
| 0,01 | 1,35 | 1,0248 | 0,7283 |
De største reduksjonene dette kvartalet
Vi bruker endringen i porteføljeallokeringen fordi dette er det mest meningsfulle målet. Endringer kan skyldes handler eller endringer i aksjekurser.
| Verdipapirer | Aksjer (MM) |
Verdi (MM$) |
Portefølje % | ΔPortefølje % |
|---|---|---|---|---|
| 0,00 | 0,55 | 0,4131 | −1,4627 | |
| 0,00 | 2,06 | 1,5601 | −0,8041 | |
| 0,01 | 2,82 | 2,1335 | −0,6658 | |
| 0,00 | 0,42 | 0,3185 | −0,6444 | |
| 0,00 | 0,40 | 0,3044 | −0,5942 | |
| 0,01 | 0,77 | 0,5855 | −0,5444 | |
| 0,02 | 2,60 | 1,9706 | −0,4491 | |
| 0,03 | 1,88 | 1,4205 | −0,4140 | |
| 0,01 | 0,26 | 0,1977 | −0,3590 | |
| 0,01 | 1,70 | 1,2859 | −0,3258 |
13F- og Fondsarkiveringer
Dette skjemaet ble sendt inn den 2025-08-14 for rapporteringsperioden 2025-06-30. Klikk på lenkeikonet for å se hele transaksjonshistorikken.
Oppgradere for å låse opp premiedata og eksportere til Excel![]() .
.
| Verdipapirer | Type | Gjennomsnittlig aksjekurs | Aksjer (MM) |
ΔAksjer (%) |
ΔAksjer (%) |
Verdi ($MM) |
Portefølje (%) |
ΔPortefølje (%) |
|
|---|---|---|---|---|---|---|---|---|---|
| MSFT / Microsoft Corporation | 0,01 | −3,01 | 6,36 | 28,52 | 4,8177 | 0,7844 | |||
| JPM / JPMorgan Chase & Co. | 0,01 | −4,37 | 4,29 | 13,04 | 3,2493 | 0,1562 | |||
| CSCO / Cisco Systems, Inc. | 0,05 | 96,51 | 3,18 | 120,96 | 2,4111 | 1,2369 | |||
| JBL / Jabil Inc. | 0,01 | 175,50 | 3,11 | 341,70 | 2,3581 | 1,7836 | |||
| BAC / Bank of America Corporation | 0,06 | −2,67 | 2,83 | 10,34 | 2,1424 | 0,0538 | |||
| AAPL / Apple Inc. | 0,01 | −11,22 | 2,82 | −17,99 | 2,1335 | −0,6658 | |||
| AVGO / Broadcom Inc. | 0,01 | −9,74 | 2,80 | 48,59 | 2,1185 | 0,5847 | |||
| TPR / Tapestry, Inc. | 0,03 | 63,00 | 2,67 | 103,27 | 2,0209 | 0,9513 | |||
| XOM / Exxon Mobil Corporation | 0,02 | −3,33 | 2,60 | −12,36 | 1,9706 | −0,4491 | |||
| NVDA / NVIDIA Corporation | 0,02 | −12,40 | 2,46 | 27,71 | 1,8636 | 0,2935 | |||
| STX / Seagate Technology Holdings plc | 0,02 | 54,57 | 2,30 | 162,79 | 1,7430 | 1,0289 | |||
| IBM / International Business Machines Corporation | 0,01 | −5,43 | 2,26 | 12,13 | 1,7074 | 0,0689 | |||
| RTX / RTX Corporation | 0,01 | 98,18 | 2,10 | 118,61 | 1,5927 | 0,8083 | |||
| GILD / Gilead Sciences, Inc. | 0,02 | 45,25 | 2,10 | 43,70 | 1,5890 | 0,3995 | |||
| URI / United Rentals, Inc. | 0,00 | −2,33 | 2,08 | 17,43 | 1,5765 | 0,1319 | |||
| META / Meta Platforms, Inc. | 0,00 | −44,56 | 2,06 | −29,01 | 1,5601 | −0,8041 | |||
| KR / The Kroger Co. | 0,03 | −21,38 | 1,88 | −16,70 | 1,4205 | −0,4140 | |||
| GS / The Goldman Sachs Group, Inc. | 0,00 | 0,00 | 1,77 | 29,51 | 1,3427 | 0,2276 | |||
| CMCSA / Comcast Corporation | 0,05 | 13,29 | 1,71 | 9,60 | 1,2973 | 0,0235 | |||
| GOOGL / Alphabet Inc. | 0,01 | −9,59 | 1,70 | 3,02 | 1,2896 | −0,0570 | |||
| ABBV / AbbVie Inc. | 0,01 | −3,10 | 1,70 | −14,16 | 1,2859 | −0,3258 | |||
| VZ / Verizon Communications Inc. | 0,04 | 8,22 | 1,68 | 3,20 | 1,2709 | −0,0536 | |||
| AMP / Ameriprise Financial, Inc. | 0,00 | −9,04 | 1,68 | 0,30 | 1,2691 | −0,0924 | |||
| MO / Altria Group, Inc. | 0,03 | −11,72 | 1,65 | −13,73 | 1,2462 | −0,3086 | |||
| NEM / Newmont Corporation | 0,03 | −0,41 | 1,64 | 20,12 | 1,2392 | 0,1298 | |||
| DAL / Delta Air Lines, Inc. | 0,03 | −4,60 | 1,56 | 7,57 | 1,1839 | 0,0002 | |||
| DRI / Darden Restaurants, Inc. | 0,01 | −5,10 | 1,55 | −0,45 | 1,1770 | −0,0948 | |||
| PFE / Pfizer Inc. | 0,06 | 11,39 | 1,55 | 6,54 | 1,1718 | −0,0114 | |||
| T / AT&T Inc. | 0,05 | 90,36 | 1,51 | 94,85 | 1,1451 | 0,5127 | |||
| GLW / Corning Incorporated | 0,03 | 1,49 | 1,1256 | 1,1256 | |||||
| CVNA / Carvana Co. | 0,00 | 1,47 | 1,1130 | 1,1130 | |||||
| VLO / Valero Energy Corporation | 0,01 | 7,19 | 1,44 | 9,17 | 1,0902 | 0,0151 | |||
| WFC / Wells Fargo & Company | 0,02 | −7,22 | 1,41 | 3,52 | 1,0702 | −0,0419 | |||
| PM / Philip Morris International Inc. | 0,01 | −21,79 | 1,41 | −10,28 | 1,0639 | −0,2117 | |||
| SPG / Simon Property Group, Inc. | 0,01 | 1,80 | 1,38 | −1,43 | 1,0413 | −0,0957 | |||
| TWLO / Twilio Inc. | 0,01 | 192,76 | 1,35 | 271,70 | 1,0248 | 0,7283 | |||
| QCOM / QUALCOMM Incorporated | 0,01 | −3,11 | 1,34 | 0,45 | 1,0109 | −0,0718 | |||
| CVS / CVS Health Corporation | 0,02 | 136,03 | 1,32 | 140,73 | 1,0023 | 0,5536 | |||
| CAT / Caterpillar Inc. | 0,00 | −10,25 | 1,32 | 5,71 | 0,9957 | −0,0184 | |||
| CI / The Cigna Group | 0,00 | 27,68 | 1,31 | 28,25 | 0,9938 | 0,1604 | |||
| MRK / Merck & Co., Inc. | 0,02 | −1,57 | 1,29 | −13,22 | 0,9749 | −0,2335 | |||
| BBY / Best Buy Co., Inc. | 0,02 | 4,22 | 1,24 | −4,92 | 0,9359 | −0,1235 | |||
| AGG / iShares Trust - iShares Core U.S. Aggregate Bond ETF | 0,01 | 0,00 | 1,18 | 0,26 | 0,8929 | −0,0651 | |||
| AMGN / Amgen Inc. | 0,00 | −6,35 | 1,14 | −16,04 | 0,8641 | −0,2436 | |||
| DKS / DICK'S Sporting Goods, Inc. | 0,01 | −3,01 | 1,05 | −4,82 | 0,7920 | −0,1032 | |||
| COF / Capital One Financial Corporation | 0,00 | 1,04 | 0,7863 | 0,7863 | |||||
| BK / The Bank of New York Mellon Corporation | 0,01 | −6,94 | 1,04 | 1,07 | 0,7846 | −0,0504 | |||
| EXC / Exelon Corporation | 0,02 | −16,18 | 1,00 | −20,98 | 0,7587 | −0,2748 | |||
| UNM / Unum Group | 0,01 | −0,18 | 0,98 | −1,02 | 0,7383 | −0,0644 | |||
| PKG / Packaging Corporation of America | 0,01 | −5,70 | 0,97 | −10,31 | 0,7317 | −0,1455 | |||
| APP / AppLovin Corporation | 0,00 | −39,56 | 0,96 | −20,13 | 0,7272 | −0,2526 | |||
| CEG / Constellation Energy Corporation | 0,00 | −1,41 | 0,90 | 57,79 | 0,6824 | 0,2172 | |||
| PPL / PPL Corporation | 0,03 | −16,47 | 0,90 | −21,63 | 0,6783 | −0,2526 | |||
| MS / Morgan Stanley | 0,01 | −6,83 | 0,88 | 12,47 | 0,6695 | 0,0292 | |||
| HST / Host Hotels & Resorts, Inc. | 0,05 | 28,11 | 0,84 | 38,49 | 0,6381 | 0,1423 | |||
| LMT / Lockheed Martin Corporation | 0,00 | 169,07 | 0,83 | 179,12 | 0,6283 | 0,3860 | |||
| APH / Amphenol Corporation | 0,01 | −9,86 | 0,83 | 35,69 | 0,6253 | 0,1296 | |||
| PHM / PulteGroup, Inc. | 0,01 | 0,00 | 0,79 | 2,61 | 0,5946 | −0,0290 | |||
| DELL / Dell Technologies Inc. | 0,01 | −58,55 | 0,77 | −44,27 | 0,5855 | −0,5444 | |||
| GEN / Gen Digital Inc. | 0,03 | 7,08 | 0,76 | 18,63 | 0,5789 | 0,0538 | |||
| EBAY / eBay Inc. | 0,01 | −2,32 | 0,75 | 7,32 | 0,5670 | −0,0011 | |||
| RCL / Royal Caribbean Cruises Ltd. | 0,00 | −16,47 | 0,73 | 27,30 | 0,5542 | 0,0859 | |||
| NRG / NRG Energy, Inc. | 0,00 | 76,35 | 0,72 | 197,52 | 0,5456 | 0,3477 | |||
| PNC / The PNC Financial Services Group, Inc. | 0,00 | 3,20 | 0,72 | 9,33 | 0,5419 | 0,0092 | |||
| CHTR / Charter Communications, Inc. | 0,00 | 0,71 | 0,5379 | 0,5379 | |||||
| ED / Consolidated Edison, Inc. | 0,01 | 0,00 | 0,70 | −9,23 | 0,5287 | −0,0982 | |||
| ZM / Zoom Communications Inc. | 0,01 | 0,69 | 0,5248 | 0,5248 | |||||
| SSNC / SS&C Technologies Holdings, Inc. | 0,01 | −5,46 | 0,69 | −6,25 | 0,5228 | −0,0774 | |||
| LRCX / Lam Research Corporation | 0,01 | −9,37 | 0,69 | 21,38 | 0,5202 | 0,0590 | |||
| C / Citigroup Inc. | 0,01 | −0,15 | 0,68 | 19,68 | 0,5158 | 0,0523 | |||
| DOX / Amdocs Limited | 0,01 | −3,48 | 0,68 | −3,70 | 0,5122 | −0,0604 | |||
| ACGL / Arch Capital Group Ltd. | 0,01 | −15,79 | 0,67 | −20,26 | 0,5037 | −0,1761 | |||
| BMY / Bristol-Myers Squibb Company | 0,01 | −3,24 | 0,65 | −26,50 | 0,4914 | −0,2285 | |||
| CMI / Cummins Inc. | 0,00 | 0,05 | 0,63 | 4,45 | 0,4805 | −0,0140 | |||
| HWM / Howmet Aerospace Inc. | 0,00 | 0,60 | 0,4565 | 0,4565 | |||||
| LOW / Lowe's Companies, Inc. | 0,00 | −9,46 | 0,59 | −13,91 | 0,4501 | −0,1122 | |||
| ALL / The Allstate Corporation | 0,00 | 12,25 | 0,57 | 8,97 | 0,4330 | 0,0061 | |||
| KLAC / KLA Corporation | 0,00 | 0,00 | 0,57 | 32,01 | 0,4279 | 0,0785 | |||
| CNC / Centene Corporation | 0,01 | 15,41 | 0,56 | 3,13 | 0,4253 | −0,0181 | |||
| UNH / UnitedHealth Group Incorporated | 0,00 | −60,22 | 0,55 | −76,32 | 0,4131 | −1,4627 | |||
| PGR / The Progressive Corporation | 0,00 | 0,00 | 0,52 | −5,76 | 0,3972 | −0,0560 | |||
| JNJ / Johnson & Johnson | 0,00 | 0,06 | 0,52 | −7,94 | 0,3956 | −0,0662 | |||
| ELV / Elevance Health, Inc. | 0,00 | −0,24 | 0,49 | −10,75 | 0,3713 | −0,0765 | |||
| CME / CME Group Inc. | 0,00 | 0,47 | 0,3537 | 0,3537 | |||||
| STT / State Street Corporation | 0,00 | −0,02 | 0,45 | 18,85 | 0,3438 | 0,0323 | |||
| GD / General Dynamics Corporation | 0,00 | 0,00 | 0,45 | 6,95 | 0,3383 | −0,0019 | |||
| K / Kellanova | 0,01 | 0,00 | 0,42 | −3,64 | 0,3207 | −0,0372 | |||
| AMAT / Applied Materials, Inc. | 0,00 | −71,79 | 0,42 | −64,47 | 0,3185 | −0,6444 | |||
| PPC / Pilgrim's Pride Corporation | 0,01 | 34,14 | 0,42 | 10,64 | 0,3152 | 0,0088 | |||
| ORCL / Oracle Corporation | 0,00 | 0,00 | 0,40 | 56,81 | 0,3054 | 0,0953 | |||
| NTAP / NetApp, Inc. | 0,00 | −69,95 | 0,40 | −63,55 | 0,3044 | −0,5942 | |||
| USFD / US Foods Holding Corp. | 0,00 | 0,74 | 0,38 | 18,44 | 0,2875 | 0,0265 | |||
| LNG / Cheniere Energy, Inc. | 0,00 | −0,06 | 0,38 | 5,28 | 0,2872 | −0,0066 | |||
| JCI / Johnson Controls International plc | 0,00 | 0,00 | 0,37 | 32,03 | 0,2811 | 0,0517 | |||
| CTVA / Corteva, Inc. | 0,00 | 0,37 | 0,2787 | 0,2787 | |||||
| GM / General Motors Company | 0,01 | 0,36 | 0,2762 | 0,2762 | |||||
| SNA / Snap-on Incorporated | 0,00 | 0,36 | 0,2695 | 0,2695 | |||||
| GAP / The Gap, Inc. | 0,02 | −0,03 | 0,35 | 5,79 | 0,2631 | −0,0045 | |||
| MMM / 3M Company | 0,00 | −16,15 | 0,34 | −12,98 | 0,2591 | −0,0616 | |||
| SFM / Sprouts Farmers Market, Inc. | 0,00 | 0,33 | 0,2489 | 0,2489 | |||||
| WMB / The Williams Companies, Inc. | 0,01 | −24,89 | 0,32 | −21,04 | 0,2416 | −0,0877 | |||
| TAP / Molson Coors Beverage Company | 0,01 | −7,62 | 0,32 | −27,08 | 0,2388 | −0,1132 | |||
| CAH / Cardinal Health, Inc. | 0,00 | −14,94 | 0,31 | 3,64 | 0,2374 | −0,0089 | |||
| MAS / Masco Corporation | 0,00 | 0,31 | 0,2374 | 0,2374 | |||||
| UAL / United Airlines Holdings, Inc. | 0,00 | 0,31 | 0,2356 | 0,2356 | |||||
| EXE / Expand Energy Corporation | 0,00 | 0,30 | 0,2299 | 0,2299 | |||||
| BBWI / Bath & Body Works, Inc. | 0,01 | 0,00 | 0,30 | −1,31 | 0,2282 | −0,0203 | |||
| ROK / Rockwell Automation, Inc. | 0,00 | 0,30 | 0,2271 | 0,2271 | |||||
| MCK / McKesson Corporation | 0,00 | −7,62 | 0,29 | 0,69 | 0,2219 | −0,0155 | |||
| SWK / Stanley Black & Decker, Inc. | 0,00 | 39,27 | 0,29 | 23,18 | 0,2174 | 0,0268 | |||
| LLY / Eli Lilly and Company | 0,00 | 0,00 | 0,28 | −5,72 | 0,2124 | −0,0297 | |||
| HIG / The Hartford Insurance Group, Inc. | 0,00 | 0,00 | 0,28 | 2,60 | 0,2096 | −0,0103 | |||
| AEP / American Electric Power Company, Inc. | 0,00 | 0,00 | 0,27 | −5,23 | 0,2067 | −0,0275 | |||
| CTRA / Coterra Energy Inc. | 0,01 | 0,27 | 0,2053 | 0,2053 | |||||
| KHC / The Kraft Heinz Company | 0,01 | −8,54 | 0,27 | −22,38 | 0,2023 | −0,0782 | |||
| JLL / Jones Lang LaSalle Incorporated | 0,00 | 0,00 | 0,26 | 3,13 | 0,2002 | −0,0086 | |||
| HCA / HCA Healthcare, Inc. | 0,00 | −1,16 | 0,26 | 9,62 | 0,1984 | 0,0036 | |||
| BKR / Baker Hughes Company | 0,01 | −56,20 | 0,26 | −61,79 | 0,1977 | −0,3590 | |||
| EPR / EPR Properties | 0,00 | −0,38 | 0,26 | 10,34 | 0,1940 | 0,0048 | |||
| USB / U.S. Bancorp | 0,01 | 0,00 | 0,24 | 7,14 | 0,1822 | −0,0007 | |||
| LH / Labcorp Holdings Inc. | 0,00 | 0,24 | 0,1810 | 0,1810 | |||||
| FNF / Fidelity National Financial, Inc. | 0,00 | 0,24 | 0,1804 | 0,1804 | |||||
| STLD / Steel Dynamics, Inc. | 0,00 | −0,11 | 0,23 | 2,20 | 0,1763 | −0,0092 | |||
| EME / EMCOR Group, Inc. | 0,00 | 0,23 | 0,1737 | 0,1737 | |||||
| CCL / Carnival Corporation & plc | 0,01 | −30,14 | 0,23 | 0,44 | 0,1731 | −0,0121 | |||
| ETR / Entergy Corporation | 0,00 | 0,22 | 0,1691 | 0,1691 | |||||
| DTE / DTE Energy Company | 0,00 | 0,00 | 0,21 | −4,04 | 0,1624 | −0,0200 | |||
| PYPL / PayPal Holdings, Inc. | 0,00 | 0,21 | 0,1614 | 0,1614 | |||||
| BAX / Baxter International Inc. | 0,01 | 0,00 | 0,21 | −11,25 | 0,1613 | −0,0349 | |||
| COR / Cencora, Inc. | 0,00 | −28,43 | 0,21 | −22,91 | 0,1612 | −0,0635 | |||
| SPY / SPDR S&P 500 ETF | 0,00 | 0,21 | 0,1609 | 0,1609 | |||||
| IRM / Iron Mountain Incorporated | 0,00 | 0,21 | 0,1563 | 0,1563 | |||||
| F / Ford Motor Company | 0,01 | −14,92 | 0,13 | −8,51 | 0,0983 | −0,0166 | |||
| PH / Parker-Hannifin Corporation | 0,00 | −100,00 | 0,00 | 0,0000 | |||||
| SJM / The J. M. Smucker Company | 0,00 | −100,00 | 0,00 | 0,0000 | |||||
| DFS / Discover Financial Services | 0,00 | −100,00 | 0,00 | 0,0000 | |||||
| LOGI / Logitech International S.A. | 0,00 | −100,00 | 0,00 | 0,0000 | |||||
| BURL / Burlington Stores, Inc. | 0,00 | −100,00 | 0,00 | 0,0000 | |||||
| UHS / Universal Health Services, Inc. | 0,00 | −100,00 | 0,00 | 0,0000 | |||||
| CPNG / Coupang, Inc. | 0,00 | −100,00 | 0,00 | 0,0000 | |||||
| VRT / Vertiv Holdings Co | 0,00 | −100,00 | 0,00 | 0,0000 | |||||
| RF / Regions Financial Corporation | 0,00 | −100,00 | 0,00 | 0,0000 | |||||
| OMC / Omnicom Group Inc. | 0,00 | −100,00 | 0,00 | 0,0000 | |||||
| CTSH / Cognizant Technology Solutions Corporation | 0,00 | −100,00 | 0,00 | 0,0000 | |||||
| OC / Owens Corning | 0,00 | −100,00 | 0,00 | 0,0000 | |||||
| MKL / Markel Group Inc. | 0,00 | −100,00 | 0,00 | 0,0000 | |||||
| DOCU / DocuSign, Inc. | 0,00 | −100,00 | 0,00 | 0,0000 | |||||
| AER / AerCap Holdings N.V. | 0,00 | −100,00 | 0,00 | 0,0000 | |||||
| PCAR / PACCAR Inc | 0,00 | −100,00 | 0,00 | 0,0000 | |||||
| TOL / Toll Brothers, Inc. | 0,00 | −100,00 | 0,00 | 0,0000 | |||||
| TROW / T. Rowe Price Group, Inc. | 0,00 | −100,00 | 0,00 | 0,0000 | |||||
| CBRE / CBRE Group, Inc. | 0,00 | −100,00 | 0,00 | 0,0000 | |||||
| CVX / Chevron Corporation | 0,00 | −100,00 | 0,00 | 0,0000 | |||||
| HPE / Hewlett Packard Enterprise Company | 0,00 | −100,00 | 0,00 | 0,0000 | |||||
| FI / Fiserv, Inc. | 0,00 | −100,00 | 0,00 | 0,0000 | |||||
| GIS / General Mills, Inc. | 0,00 | −100,00 | 0,00 | 0,0000 | |||||
| FANG / Diamondback Energy, Inc. | 0,00 | −100,00 | 0,00 | 0,0000 | |||||
| IP / International Paper Company | 0,00 | −100,00 | 0,00 | 0,0000 | |||||
| BRK.B / Berkshire Hathaway Inc. | 0,00 | −100,00 | 0,00 | 0,0000 | |||||
| TEVA / Teva Pharmaceutical Industries Limited - Depositary Receipt (Common Stock) | 0,00 | −100,00 | 0,00 | 0,0000 | |||||
| THC / Tenet Healthcare Corporation | 0,00 | −100,00 | 0,00 | 0,0000 | |||||
| BLDR / Builders FirstSource, Inc. | 0,00 | −100,00 | 0,00 | 0,0000 | |||||
| VTRS / Viatris Inc. | 0,00 | −100,00 | 0,00 | 0,0000 |