Grunnleggende statistikk
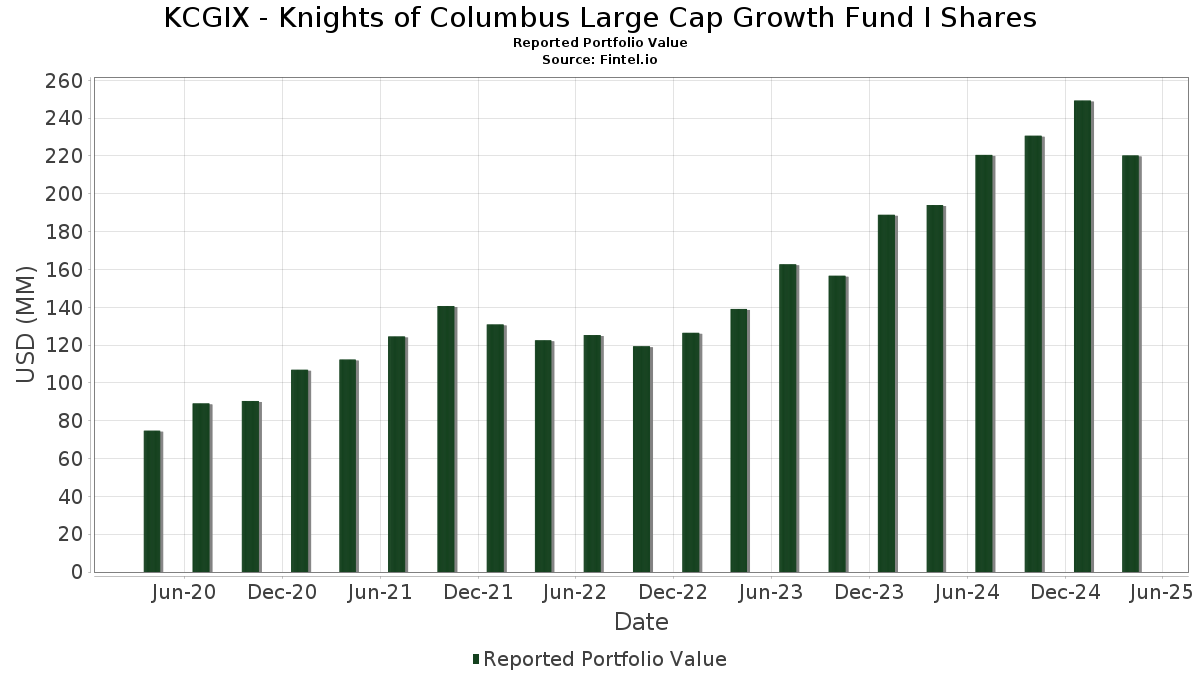
| Porteføljeverdi | $ 220 254 480 |
| Nåværende posisjoner | 69 |
Siste beholdninger, prestasjoner, forvaltet kapital (fra 13F, 13D)
KCGIX - Knights of Columbus Large Cap Growth Fund I Shares har oppgitt 69 totale beholdninger i sine siste SEC-arkiveringer. Siste porteføljeverdi er beregnet til 220 254 480 USD. Faktisk forvaltet kapital (AUM) er denne verdien pluss kontanter (som ikke er oppgitt). KCGIX - Knights of Columbus Large Cap Growth Fund I Sharess største beholdninger er Apple Inc. (US:AAPL) , Microsoft Corporation (US:MSFT) , NVIDIA Corporation (US:NVDA) , Meta Platforms, Inc. (US:META) , and Alphabet Inc. (US:GOOGL) . KCGIX - Knights of Columbus Large Cap Growth Fund I Sharess nye posisjoner inkluderer Welltower Inc. (US:WELL) , Walmart Inc. (US:WMT) , ATI Inc. (US:ATI) , Viking Holdings Ltd (US:VIK) , and Palantir Technologies Inc. (US:PLTR) .
De største økningene dette kvartalet
Vi bruker endringen i porteføljeallokeringen fordi dette er det mest meningsfulle målet. Endringer kan skyldes handler eller endringer i aksjekursene.
| Verdipapirer | Aksjer (MM) |
Verdi (MM$) |
Portefølje % | ΔPortefølje % |
|---|---|---|---|---|
| 8,87 | 4,0286 | 4,0286 | ||
| 0,02 | 2,82 | 1,2807 | 1,2807 | |
| 0,02 | 5,20 | 2,3615 | 1,2630 | |
| 0,03 | 2,76 | 1,2519 | 1,2519 | |
| 0,05 | 21,21 | 9,6322 | 0,8350 | |
| 0,03 | 1,74 | 0,7879 | 0,7879 | |
| 0,04 | 1,70 | 0,7697 | 0,7697 | |
| 0,01 | 1,65 | 0,7498 | 0,7498 | |
| 0,01 | 1,57 | 0,7139 | 0,7139 | |
| 0,01 | 5,43 | 2,4651 | 0,5234 |
De største reduksjonene dette kvartalet
Vi bruker endringen i porteføljeallokeringen fordi dette er det mest meningsfulle målet. Endringer kan skyldes handler eller endringer i aksjekurser.
| Verdipapirer | Aksjer (MM) |
Verdi (MM$) |
Portefølje % | ΔPortefølje % |
|---|---|---|---|---|
| 0,00 | 0,00 | −0,9132 | ||
| 0,00 | 0,00 | −0,8187 | ||
| 0,02 | 5,52 | 2,5062 | −0,7272 | |
| 0,00 | 1,14 | 0,5187 | −0,5393 | |
| 0,00 | 0,00 | −0,5283 | ||
| 0,04 | 6,87 | 3,1200 | −0,4861 | |
| 0,01 | 1,39 | 0,6330 | −0,4150 | |
| 0,00 | 0,92 | 0,4180 | −0,4022 | |
| 0,04 | 5,92 | 2,6882 | −0,4019 | |
| 0,00 | 1,18 | 0,5378 | −0,3825 |
13F- og Fondsarkiveringer
Dette skjemaet ble sendt inn den 2025-06-26 for rapporteringsperioden 2025-04-30. Klikk på lenkeikonet for å se hele transaksjonshistorikken.
Oppgradere for å låse opp premiedata og eksportere til Excel![]() .
.
| Verdipapirer | Type | Gjennomsnittlig aksjekurs | Aksjer (MM) |
ΔAksjer (%) |
ΔAksjer (%) |
Verdi ($MM) |
Portefølje (%) |
ΔPortefølje (%) |
|
|---|---|---|---|---|---|---|---|---|---|
| AAPL / Apple Inc. | 0,10 | −3,77 | 21,39 | −13,35 | 9,7114 | −0,1883 | |||
| MSFT / Microsoft Corporation | 0,05 | 1,56 | 21,21 | −3,29 | 9,6322 | 0,8350 | |||
| NVDA / NVIDIA Corporation | 0,17 | −0,24 | 18,25 | −9,50 | 8,2866 | 0,1984 | |||
| META / Meta Platforms, Inc. | 0,02 | 5,92 | 9,38 | −15,62 | 4,2602 | −0,1997 | |||
| BROWN BROTHERS HARRIMAN SWEEP INTEREST / STIV (N/A) | 8,87 | 4,0286 | 4,0286 | ||||||
| GOOGL / Alphabet Inc. | 0,04 | −1,82 | 6,87 | −23,58 | 3,1200 | −0,4861 | |||
| AVGO / Broadcom Inc. | 0,04 | −1,81 | 6,76 | −14,59 | 3,0697 | −0,1048 | |||
| GOOG / Alphabet Inc. | 0,04 | −1,80 | 5,92 | −23,16 | 2,6882 | −0,4019 | |||
| TSLA / Tesla, Inc. | 0,02 | −1,83 | 5,52 | −31,54 | 2,5062 | −0,7272 | |||
| BRK.B / Berkshire Hathaway Inc. | 0,01 | −1,44 | 5,43 | 12,15 | 2,4651 | 0,5234 | |||
| V / Visa Inc. | 0,02 | 87,86 | 5,20 | 89,92 | 2,3615 | 1,2630 | |||
| NFLX / Netflix, Inc. | 0,00 | −15,02 | 4,52 | −1,53 | 2,0503 | 0,2111 | |||
| TJX / The TJX Companies, Inc. | 0,03 | −1,82 | 3,46 | 1,26 | 1,5721 | 0,2005 | |||
| CRM / Salesforce, Inc. | 0,01 | −1,50 | 3,19 | −22,54 | 1,4463 | −0,2029 | |||
| PGR / The Progressive Corporation | 0,01 | −1,62 | 3,05 | 12,45 | 1,3861 | 0,2976 | |||
| MA / Mastercard Incorporated | 0,01 | −1,17 | 2,91 | −2,48 | 1,3209 | 0,1244 | |||
| PG / The Procter & Gamble Company | 0,02 | 26,95 | 2,84 | 32,08 | 1,2883 | −0,0320 | |||
| WELL / Welltower Inc. | 0,02 | 2,82 | 1,2807 | 1,2807 | |||||
| WMT / Walmart Inc. | 0,03 | 2,76 | 1,2519 | 1,2519 | |||||
| AZO / AutoZone, Inc. | 0,00 | −5,34 | 2,74 | 6,34 | 1,2420 | 0,2101 | |||
| JPM / JPMorgan Chase & Co. | 0,01 | 22,51 | 2,69 | 12,15 | 1,2197 | 0,2588 | |||
| UBER / Uber Technologies, Inc. | 0,03 | −1,80 | 2,62 | 19,03 | 1,1904 | 0,3068 | |||
| KO / The Coca-Cola Company | 0,04 | −1,88 | 2,60 | 12,16 | 1,1810 | 0,2507 | |||
| HD / The Home Depot, Inc. | 0,01 | −1,89 | 2,49 | −14,14 | 1,1307 | −0,0327 | |||
| SYK / Stryker Corporation | 0,01 | −1,88 | 2,47 | −6,22 | 1,1234 | 0,0651 | |||
| BSX / Boston Scientific Corporation | 0,02 | −1,87 | 2,43 | −1,38 | 1,1040 | 0,1151 | |||
| NOW / ServiceNow, Inc. | 0,00 | −0,62 | 2,43 | −6,83 | 1,1036 | 0,0576 | |||
| CAT / Caterpillar Inc. | 0,01 | −1,85 | 2,43 | −18,27 | 1,1029 | −0,0892 | |||
| AXP / American Express Company | 0,01 | −1,84 | 2,34 | −17,61 | 1,0644 | −0,0769 | |||
| WM / Waste Management, Inc. | 0,01 | −1,83 | 2,31 | 4,01 | 1,0479 | 0,1580 | |||
| PEP / PepsiCo, Inc. | 0,02 | −1,92 | 2,27 | −11,76 | 1,0297 | −0,0010 | |||
| ISRG / Intuitive Surgical, Inc. | 0,00 | −1,47 | 2,21 | −11,13 | 1,0047 | 0,0061 | |||
| KLAC / KLA Corporation | 0,00 | −1,49 | 2,09 | −6,22 | 0,9511 | 0,0552 | |||
| GS / The Goldman Sachs Group, Inc. | 0,00 | −1,43 | 1,89 | −15,71 | 0,8577 | −0,0412 | |||
| PANW / Palo Alto Networks, Inc. | 0,01 | −2,83 | 1,85 | −1,49 | 0,8419 | 0,0869 | |||
| TOST / Toast, Inc. | 0,05 | −1,87 | 1,85 | −14,69 | 0,8389 | −0,0295 | |||
| ORCL / Oracle Corporation | 0,01 | −2,90 | 1,75 | −19,66 | 0,7945 | −0,0790 | |||
| ATI / ATI Inc. | 0,03 | 1,74 | 0,7879 | 0,7879 | |||||
| DRI / Darden Restaurants, Inc. | 0,01 | −15,40 | 1,73 | 4,41 | 0,7858 | −0,0908 | |||
| QCOM / QUALCOMM Incorporated | 0,01 | −3,07 | 1,72 | −16,81 | 0,7801 | −0,0479 | |||
| VIK / Viking Holdings Ltd | 0,04 | 1,70 | 0,7697 | 0,7697 | |||||
| PLTR / Palantir Technologies Inc. | 0,01 | 1,65 | 0,7498 | 0,7498 | |||||
| INTU / Intuit Inc. | 0,00 | 0,00 | 1,64 | 4,34 | 0,7425 | 0,1138 | |||
| SPG / Simon Property Group, Inc. | 0,01 | 1,57 | 0,7139 | 0,7139 | |||||
| ECL / Ecolab Inc. | 0,01 | −2,79 | 1,50 | −2,28 | 0,6811 | 0,0653 | |||
| CMI / Cummins Inc. | 0,01 | 34,73 | 1,48 | 11,13 | 0,6712 | 0,1377 | |||
| ANET / Arista Networks Inc | 0,02 | −2,76 | 1,46 | −30,58 | 0,6631 | −0,1806 | |||
| BJ / BJ's Wholesale Club Holdings, Inc. | 0,01 | −55,05 | 1,39 | −46,63 | 0,6330 | −0,4150 | |||
| VST / Vistra Corp. | 0,01 | −2,85 | 1,39 | −25,05 | 0,6303 | −0,1125 | |||
| GE / General Electric Company | 0,01 | −2,64 | 1,38 | −3,57 | 0,6248 | 0,0523 | |||
| COST / Costco Wholesale Corporation | 0,00 | 0,00 | 1,36 | 1,49 | 0,6168 | 0,0800 | |||
| EME / EMCOR Group, Inc. | 0,00 | 0,00 | 1,28 | −10,62 | 0,5811 | 0,0071 | |||
| SPOT / Spotify Technology S.A. | 0,00 | −53,88 | 1,18 | −48,39 | 0,5378 | −0,3825 | |||
| PODD / Insulet Corporation | 0,00 | −52,22 | 1,14 | −56,69 | 0,5187 | −0,5393 | |||
| URI / United Rentals, Inc. | 0,00 | −2,81 | 1,13 | −19,06 | 0,5152 | −0,0469 | |||
| MLI / Mueller Industries, Inc. | 0,02 | 1,13 | 0,5113 | 0,5113 | |||||
| UNP / Union Pacific Corporation | 0,01 | −1,89 | 1,08 | −14,65 | 0,4926 | −0,0170 | |||
| ACN / Accenture plc | 0,00 | −2,85 | 0,97 | −24,51 | 0,4394 | −0,0747 | |||
| BLDR / Builders FirstSource, Inc. | 0,01 | −2,29 | 0,96 | −30,12 | 0,4373 | −0,1155 | |||
| AMD / Advanced Micro Devices, Inc. | 0,01 | −2,51 | 0,93 | −18,13 | 0,4225 | −0,0334 | |||
| TMUS / T-Mobile US, Inc. | 0,00 | −57,53 | 0,92 | −55,01 | 0,4180 | −0,4022 | |||
| DECK / Deckers Outdoor Corporation | 0,01 | −2,29 | 0,92 | −38,93 | 0,4160 | −0,1858 | |||
| NET / Cloudflare, Inc. | 0,01 | −2,68 | 0,89 | −15,07 | 0,4020 | −0,0161 | |||
| LNG / Cheniere Energy, Inc. | 0,00 | 0,00 | 0,88 | 3,40 | 0,4010 | 0,0582 | |||
| SNOW / Snowflake Inc. | 0,01 | 0,00 | 0,82 | −12,07 | 0,3738 | −0,0020 | |||
| HUBS / HubSpot, Inc. | 0,00 | 0,00 | 0,78 | −21,53 | 0,3543 | −0,0446 | |||
| BKR / Baker Hughes Company | 0,02 | 0,73 | 0,3316 | 0,3316 | |||||
| DDOG / Datadog, Inc. | 0,01 | 0,00 | 0,58 | −28,41 | 0,2620 | −0,0613 | |||
| APP / AppLovin Corporation | 0,00 | 0,42 | 0,1886 | 0,1886 | |||||
| GTLS / Chart Industries, Inc. | 0,00 | −100,00 | 0,00 | −100,00 | −0,9132 | ||||
| ZBRA / Zebra Technologies Corporation | 0,00 | −100,00 | 0,00 | −100,00 | −0,5283 | ||||
| BX / Blackstone Inc. | 0,00 | −100,00 | 0,00 | −100,00 | −0,8187 |