Grunnleggende statistikk
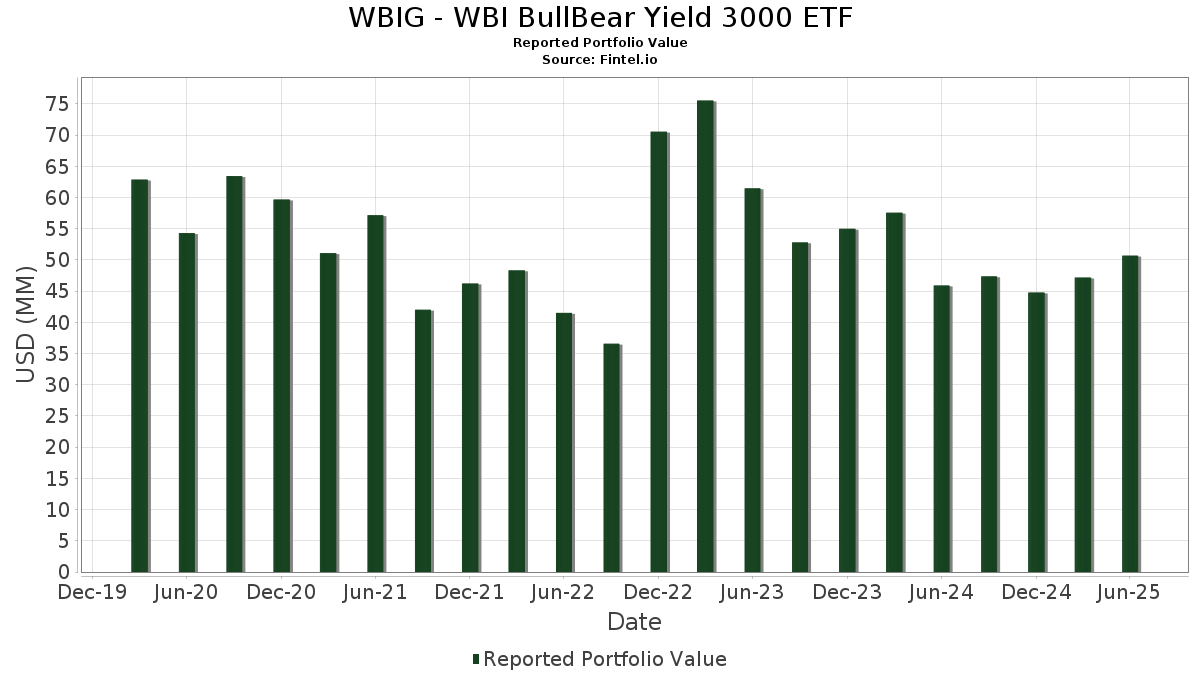
| Porteføljeverdi | $ 50 690 233 |
| Nåværende posisjoner | 109 |
Siste beholdninger, prestasjoner, forvaltet kapital (fra 13F, 13D)
WBIG - WBI BullBear Yield 3000 ETF har oppgitt 109 totale beholdninger i sine siste SEC-arkiveringer. Siste porteføljeverdi er beregnet til 50 690 233 USD. Faktisk forvaltet kapital (AUM) er denne verdien pluss kontanter (som ikke er oppgitt). WBIG - WBI BullBear Yield 3000 ETFs største beholdninger er WisdomTree Trust - WisdomTree Interest Rate Hedged U.S. Aggregate Bond Fund (US:AGZD) , Angel Oak Funds Trust - Angel Oak High Yield Opportunities ETF (US:AOHY) , TCW ETF Trust - TCW Senior Loan ETF (US:SLNZ) , Morgan Stanley ETF Trust - Eaton Vance Short Duration Income ETF (US:EVSD) , and SPDR Series Trust - SPDR Bloomberg Investment Grade Floating Rate ETF (US:FLRN) . WBIG - WBI BullBear Yield 3000 ETFs nye posisjoner inkluderer Angel Oak Funds Trust - Angel Oak High Yield Opportunities ETF (US:AOHY) , TCW ETF Trust - TCW Senior Loan ETF (US:SLNZ) , Morgan Stanley ETF Trust - Eaton Vance Short Duration Income ETF (US:EVSD) , SPDR Series Trust - SPDR Bloomberg Investment Grade Floating Rate ETF (US:FLRN) , and Invesco Actively Managed Exchange-Traded Fund Trust - Invesco Ultra Short Duration ETF (US:GSY) .
De største økningene dette kvartalet
Vi bruker endringen i porteføljeallokeringen fordi dette er det mest meningsfulle målet. Endringer kan skyldes handler eller endringer i aksjekursene.
| Verdipapirer | Aksjer (MM) |
Verdi (MM$) |
Portefølje % | ΔPortefølje % |
|---|---|---|---|---|
| 5,11 | 5,11 | 15,2021 | 15,2021 | |
| 5,11 | 5,11 | 15,2021 | 15,2021 | |
| 5,11 | 5,11 | 15,2021 | 15,2021 | |
| 0,11 | 1,20 | 3,5766 | 3,5766 | |
| 0,02 | 0,83 | 2,4820 | 2,4820 | |
| 0,01 | 0,73 | 2,1610 | 2,1610 | |
| 0,06 | 1,26 | 3,7557 | 2,1546 | |
| 0,02 | 0,71 | 2,1052 | 2,1052 | |
| 0,59 | 0,59 | 1,7700 | 1,7700 | |
| 0,59 | 0,59 | 1,7700 | 1,7700 |
De største reduksjonene dette kvartalet
Vi bruker endringen i porteføljeallokeringen fordi dette er det mest meningsfulle målet. Endringer kan skyldes handler eller endringer i aksjekurser.
| Verdipapirer | Aksjer (MM) |
Verdi (MM$) |
Portefølje % | ΔPortefølje % |
|---|---|---|---|---|
| 0,00 | 0,11 | 0,3297 | −4,5460 | |
| 0,01 | 0,24 | 0,7031 | −3,8506 | |
| 0,00 | 0,00 | −3,8111 | ||
| 0,00 | 0,12 | 0,3440 | −3,6069 | |
| 0,03 | 0,29 | 0,8754 | −3,4330 | |
| 0,00 | 0,21 | 0,6291 | −3,3644 | |
| 0,00 | 0,47 | 1,4003 | −3,3043 | |
| 0,02 | 0,49 | 1,4717 | −3,1601 | |
| 0,00 | 0,27 | 0,8001 | −3,1336 | |
| 0,00 | 0,19 | 0,5735 | −3,1000 |
13F- og Fondsarkiveringer
Dette skjemaet ble sendt inn den 2025-08-28 for rapporteringsperioden 2025-06-30. Klikk på lenkeikonet for å se hele transaksjonshistorikken.
Oppgradere for å låse opp premiedata og eksportere til Excel![]() .
.
| Verdipapirer | Type | Gjennomsnittlig aksjekurs | Aksjer (MM) |
ΔAksjer (%) |
ΔAksjer (%) |
Verdi ($MM) |
Portefølje (%) |
ΔPortefølje (%) |
|
|---|---|---|---|---|---|---|---|---|---|
| Mount Vernon Liquid Assets Portfolio, LLC / STIV (N/A) | 5,11 | 5,11 | 15,2021 | 15,2021 | |||||
| Mount Vernon Liquid Assets Portfolio, LLC / STIV (N/A) | 5,11 | 5,11 | 15,2021 | 15,2021 | |||||
| Mount Vernon Liquid Assets Portfolio, LLC / STIV (N/A) | 5,11 | 5,11 | 15,2021 | 15,2021 | |||||
| AGZD / WisdomTree Trust - WisdomTree Interest Rate Hedged U.S. Aggregate Bond Fund | 0,06 | 103,31 | 1,26 | 101,12 | 3,7557 | 2,1546 | |||
| AOHY / Angel Oak Funds Trust - Angel Oak High Yield Opportunities ETF | 0,11 | 1,20 | 3,5766 | 3,5766 | |||||
| SLNZ / TCW ETF Trust - TCW Senior Loan ETF | 0,02 | 0,83 | 2,4820 | 2,4820 | |||||
| EVSD / Morgan Stanley ETF Trust - Eaton Vance Short Duration Income ETF | 0,01 | 0,73 | 2,1610 | 2,1610 | |||||
| FLRN / SPDR Series Trust - SPDR Bloomberg Investment Grade Floating Rate ETF | 0,02 | 0,71 | 2,1052 | 2,1052 | |||||
| US BANK MMDA - USBFS 2 / STIV (N/A) | 0,59 | 0,59 | 1,7700 | 1,7700 | |||||
| US BANK MMDA - USBFS 2 / STIV (N/A) | 0,59 | 0,59 | 1,7700 | 1,7700 | |||||
| US BANK MMDA - USBFS 2 / STIV (N/A) | 0,59 | 0,59 | 1,7700 | 1,7700 | |||||
| US BANK MMDA - USBFS 2 / STIV (N/A) | 0,59 | 0,59 | 1,7700 | 1,7700 | |||||
| OMF / OneMain Holdings, Inc. | 0,01 | −48,23 | 0,54 | −39,16 | 1,6051 | −0,4178 | |||
| FIX / Comfort Systems USA, Inc. | 0,00 | −23,20 | 0,54 | 5,50 | 1,6008 | 0,4087 | |||
| IBKR / Interactive Brokers Group, Inc. | 0,01 | −8,10 | 0,50 | −69,26 | 1,4949 | −3,0493 | |||
| UPS / United Parcel Service, Inc. | 0,00 | −64,19 | 0,50 | −67,13 | 1,4734 | −2,7177 | |||
| PAG / Penske Automotive Group, Inc. | 0,00 | 0,49 | 1,4718 | 1,4718 | |||||
| PFE / Pfizer Inc. | 0,02 | −68,95 | 0,49 | −70,31 | 1,4717 | −3,1601 | |||
| CVS / CVS Health Corporation | 0,01 | 99,44 | 0,49 | 103,31 | 1,4672 | 0,7918 | |||
| GSY / Invesco Actively Managed Exchange-Traded Fund Trust - Invesco Ultra Short Duration ETF | 0,01 | 0,49 | 1,4606 | 1,4606 | |||||
| MIICF / Millicom International Cellular SA | 0,01 | 0,48 | 1,4291 | 1,4291 | |||||
| FANG / Diamondback Energy, Inc. | 0,00 | −77,67 | 0,47 | −80,24 | 1,4003 | −3,3043 | |||
| WRB / W. R. Berkley Corporation | 0,01 | −16,23 | 0,47 | 5,17 | 1,3943 | 0,2570 | |||
| AMAT / Applied Materials, Inc. | 0,00 | 91,82 | 0,47 | 116,20 | 1,3922 | 0,8391 | |||
| HAS / Hasbro, Inc. | 0,01 | −74,86 | 0,47 | −68,28 | 1,3849 | −1,9632 | |||
| VZ / Verizon Communications Inc. | 0,01 | −52,23 | 0,46 | −48,39 | 1,3836 | −0,9129 | |||
| YUMC / Yum China Holdings, Inc. | 0,01 | 0,46 | 1,3706 | 1,3706 | |||||
| FDX / FedEx Corporation | 0,00 | 0,46 | 1,3667 | 1,3667 | |||||
| MRK / Merck & Co., Inc. | 0,01 | 0,46 | 1,3586 | 1,3586 | |||||
| DTE / DTE Energy Company | 0,00 | 0,45 | 1,3519 | 1,3519 | |||||
| UGI / UGI Corporation | 0,01 | −73,25 | 0,45 | −70,54 | 1,3517 | −2,9370 | |||
| SWK / Stanley Black & Decker, Inc. | 0,01 | 0,45 | 1,3462 | 1,3462 | |||||
| MLI / Mueller Industries, Inc. | 0,01 | 0,45 | 1,3461 | 1,3461 | |||||
| PRI / Primerica, Inc. | 0,00 | −57,50 | 0,44 | −59,10 | 1,3188 | −1,6967 | |||
| OKE / ONEOK, Inc. | 0,01 | 35,80 | 0,44 | 11,62 | 1,3179 | 0,2153 | |||
| T / AT&T Inc. | 0,02 | −60,44 | 0,44 | −59,52 | 1,3101 | −1,7147 | |||
| BMY / Bristol-Myers Squibb Company | 0,01 | −55,82 | 0,44 | −60,45 | 1,3012 | −1,2848 | |||
| WSM / Williams-Sonoma, Inc. | 0,00 | 0,43 | 1,2755 | 1,2755 | |||||
| CMCSA / Comcast Corporation | 0,01 | 3,48 | 0,42 | 0,00 | 1,2643 | 0,0834 | |||
| OXY / Occidental Petroleum Corporation | 0,01 | 6,67 | 0,42 | −12,96 | 1,2600 | 0,1215 | |||
| TTEK / Tetra Tech, Inc. | 0,01 | 0,42 | 1,2463 | 1,2463 | |||||
| FTSL / First Trust Exchange-Traded Fund IV - First Trust Senior Loan Fund | 0,01 | −27,17 | 0,41 | −27,67 | 1,2299 | −0,2298 | |||
| NEAR / iShares U.S. ETF Trust - iShares Short Duration Bond Active ETF | 0,01 | 0,40 | 1,1935 | 1,1935 | |||||
| EME / EMCOR Group, Inc. | 0,00 | 0,37 | 1,0938 | 1,0938 | |||||
| DKS / DICK'S Sporting Goods, Inc. | 0,00 | 0,33 | 0,9827 | 0,9827 | |||||
| CALM / Cal-Maine Foods, Inc. | 0,00 | 0,33 | 0,9697 | 0,9697 | |||||
| AYI / Acuity Inc. | 0,00 | 0,32 | 0,9422 | 0,9422 | |||||
| AXP / American Express Company | 0,00 | 24,09 | 0,32 | 33,47 | 0,9390 | 0,3350 | |||
| SF / Stifel Financial Corp. | 0,00 | 0,30 | 0,9066 | 0,9066 | |||||
| ADT / ADT Inc. | 0,03 | −81,75 | 0,29 | −81,01 | 0,8754 | −3,4330 | |||
| ESNT / Essent Group Ltd. | 0,00 | 0,29 | 0,8709 | 0,8709 | |||||
| R / Ryder System, Inc. | 0,00 | 0,29 | 0,8684 | 0,8684 | |||||
| OC / Owens Corning | 0,00 | 0,28 | 0,8412 | 0,8412 | |||||
| CSL / Carlisle Companies Incorporated | 0,00 | 41,39 | 0,28 | 17,08 | 0,8391 | 0,2775 | |||
| FCFS / FirstCash Holdings, Inc. | 0,00 | 0,28 | 0,8367 | 0,8367 | |||||
| NEU / NewMarket Corporation | 0,00 | 0,28 | 0,8328 | 0,8328 | |||||
| MTG / MGIC Investment Corporation | 0,01 | 0,28 | 0,8325 | 0,8325 | |||||
| HRB / H&R Block, Inc. | 0,01 | 0,28 | 0,8249 | 0,8249 | |||||
| EXP / Eagle Materials Inc. | 0,00 | 0,28 | 0,8223 | 0,8223 | |||||
| J / Jacobs Solutions Inc. | 0,00 | 0,27 | 0,8068 | 0,8068 | |||||
| CF / CF Industries Holdings, Inc. | 0,00 | −91,95 | 0,27 | −85,65 | 0,8001 | −3,1336 | |||
| LW / Lamb Weston Holdings, Inc. | 0,01 | 0,27 | 0,7936 | 0,7936 | |||||
| TXRH / Texas Roadhouse, Inc. | 0,00 | 0,26 | 0,7782 | 0,7782 | |||||
| LRCX / Lam Research Corporation | 0,00 | −75,89 | 0,24 | −67,84 | 0,7084 | −1,3433 | |||
| JHG / Janus Henderson Group plc | 0,01 | −89,72 | 0,24 | −88,16 | 0,7031 | −3,8506 | |||
| KLAC / KLA Corporation | 0,00 | 0,23 | 0,6905 | 0,6905 | |||||
| HPE / Hewlett Packard Enterprise Company | 0,01 | −41,22 | 0,23 | −43,70 | 0,6795 | −0,3559 | |||
| EOG / EOG Resources, Inc. | 0,00 | 0,22 | 0,6572 | 0,6572 | |||||
| KBR / KBR, Inc. | 0,00 | 0,22 | 0,6467 | 0,6467 | |||||
| SYY / Sysco Corporation | 0,00 | −47,84 | 0,22 | −47,43 | 0,6418 | −0,4977 | |||
| LNG / Cheniere Energy, Inc. | 0,00 | 0,21 | 0,6393 | 0,6393 | |||||
| RMD / ResMed Inc. | 0,00 | −18,68 | 0,21 | −6,19 | 0,6320 | 0,0017 | |||
| MDT / Medtronic plc | 0,00 | −41,77 | 0,21 | −43,47 | 0,6318 | −0,4138 | |||
| LEN / Lennar Corporation | 0,00 | 0,21 | 0,6305 | 0,6305 | |||||
| COP / ConocoPhillips | 0,00 | 0,21 | 0,6301 | 0,6301 | |||||
| UNH / UnitedHealth Group Incorporated | 0,00 | 209,59 | 0,21 | 85,09 | 0,6296 | 0,3104 | |||
| AMGN / Amgen Inc. | 0,00 | −89,30 | 0,21 | −87,67 | 0,6291 | −3,3644 | |||
| CBOE / Cboe Global Markets, Inc. | 0,00 | −23,93 | 0,21 | −21,67 | 0,6157 | −0,1184 | |||
| MCK / McKesson Corporation | 0,00 | −50,53 | 0,21 | −46,34 | 0,6129 | −0,4507 | |||
| SLB / Schlumberger Limited | 0,01 | 6,68 | 0,21 | −13,50 | 0,6107 | −0,0511 | |||
| JNJ / Johnson & Johnson | 0,00 | −61,46 | 0,20 | −63,83 | 0,6101 | −0,7094 | |||
| TSN / Tyson Foods, Inc. | 0,00 | −61,45 | 0,20 | −63,83 | 0,6079 | −0,7110 | |||
| MDLZ / Mondelez International, Inc. | 0,00 | −9,47 | 0,20 | −9,82 | 0,6024 | −0,0234 | |||
| BR / Broadridge Financial Solutions, Inc. | 0,00 | −19,86 | 0,20 | −9,13 | 0,5924 | 0,0785 | |||
| HIG / The Hartford Insurance Group, Inc. | 0,00 | −25,83 | 0,20 | −23,85 | 0,5898 | −0,1352 | |||
| GILD / Gilead Sciences, Inc. | 0,00 | −52,88 | 0,19 | −53,48 | 0,5798 | −0,5828 | |||
| KDP / Keurig Dr Pepper Inc. | 0,01 | 0,19 | 0,5736 | 0,5736 | |||||
| LMT / Lockheed Martin Corporation | 0,00 | −89,85 | 0,19 | −89,66 | 0,5735 | −3,1000 | |||
| ACN / Accenture plc | 0,00 | −1,40 | 0,19 | −15,93 | 0,5658 | −0,0136 | |||
| NEE / NextEra Energy, Inc. | 0,00 | 0,19 | 0,5655 | 0,5655 | |||||
| ADP / Automatic Data Processing, Inc. | 0,00 | −12,81 | 0,19 | −8,37 | 0,5563 | 0,0368 | |||
| STZ / Constellation Brands, Inc. | 0,00 | 0,18 | 0,5273 | 0,5273 | |||||
| LAD / Lithia Motors, Inc. | 0,00 | 0,13 | 0,3861 | 0,3861 | |||||
| EQH / Equitable Holdings, Inc. | 0,00 | 0,13 | 0,3784 | 0,3784 | |||||
| BYD / Boyd Gaming Corporation | 0,00 | 0,13 | 0,3747 | 0,3747 | |||||
| LECO / Lincoln Electric Holdings, Inc. | 0,00 | 0,13 | 0,3727 | 0,3727 | |||||
| SCI / Service Corporation International | 0,00 | 0,12 | 0,3678 | 0,3678 | |||||
| NFG / National Fuel Gas Company | 0,00 | 0,12 | 0,3641 | 0,3641 | |||||
| AIT / Applied Industrial Technologies, Inc. | 0,00 | 0,12 | 0,3625 | 0,3625 | |||||
| GL / Globe Life Inc. | 0,00 | 0,12 | 0,3614 | 0,3614 | |||||
| AIZ / Assurant, Inc. | 0,00 | −95,06 | 0,12 | −93,22 | 0,3580 | −3,0829 | |||
| THG / The Hanover Insurance Group, Inc. | 0,00 | 0,12 | 0,3559 | 0,3559 | |||||
| GPI / Group 1 Automotive, Inc. | 0,00 | 0,12 | 0,3536 | 0,3536 | |||||
| G / Genpact Limited | 0,00 | 0,12 | 0,3524 | 0,3524 | |||||
| RL / Ralph Lauren Corporation | 0,00 | 0,12 | 0,3502 | 0,3502 | |||||
| SLGN / Silgan Holdings Inc. | 0,00 | −95,61 | 0,12 | −94,95 | 0,3440 | −3,6069 | |||
| AVY / Avery Dennison Corporation | 0,00 | 0,11 | 0,3405 | 0,3405 | |||||
| VNOM / Viper Energy, Inc. | 0,00 | −92,52 | 0,11 | −93,72 | 0,3297 | −4,5460 | |||
| LPX / Louisiana-Pacific Corporation | 0,00 | 0,11 | 0,3294 | 0,3294 | |||||
| SWX / Southwest Gas Holdings, Inc. | 0,00 | −100,00 | 0,00 | −100,00 | −3,8111 | ||||
| BRK.B / Berkshire Hathaway Inc. | 0,00 | −100,00 | 0,00 | −100,00 | −0,8120 | ||||
| AVGO / Broadcom Inc. | 0,00 | −100,00 | 0,00 | −100,00 | −0,6214 | ||||
| AEE / Ameren Corporation | 0,00 | −100,00 | 0,00 | −100,00 | −0,5741 | ||||
| LLY / Eli Lilly and Company | 0,00 | −100,00 | 0,00 | −100,00 | −0,4987 | ||||
| TSLA / Tesla, Inc. | 0,00 | −100,00 | 0,00 | −100,00 | −0,4550 |