Grunnleggende statistikk
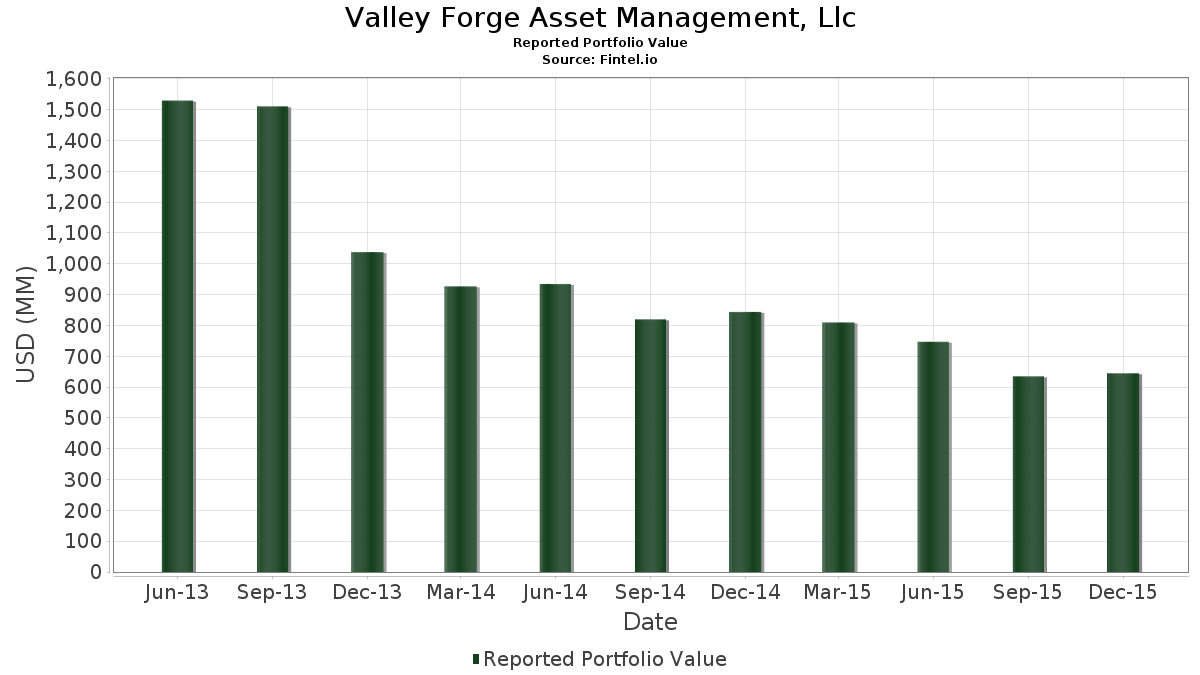
| Porteføljeverdi | $ 644 632 000 |
| Nåværende posisjoner | 98 |
Siste beholdninger, prestasjoner, forvaltet kapital (fra 13F, 13D)
Valley Forge Asset Management, Llc har oppgitt 98 totale beholdninger i sine siste SEC-arkiveringer. Siste porteføljeverdi er beregnet til 644 632 000 USD. Faktisk forvaltet kapital (AUM) er denne verdien pluss kontanter (som ikke er oppgitt). Valley Forge Asset Management, Llcs største beholdninger er General Electric Company (US:GE) , Intel Corporation (US:INTC) , Pfizer Inc. (US:PFE) , Microsoft Corporation (US:MSFT) , and Johnson & Johnson (US:JNJ) . Valley Forge Asset Management, Llcs nye posisjoner inkluderer Infosys Limited - Depositary Receipt (Common Stock) (US:INFY) , AbbVie Inc. (US:ABBV) , Yum! Brands, Inc. (US:YUM) , Flagstar Financial, Inc. (US:NYCB) , and NIKE, Inc. (US:NKE) .
De største økningene dette kvartalet
Vi bruker endringen i porteføljeallokeringen fordi dette er det mest meningsfulle målet. Endringer kan skyldes handler eller endringer i aksjekursene.
| Verdipapirer | Aksjer (MM) |
Verdi (MM$) |
Portefølje % | ΔPortefølje % |
|---|---|---|---|---|
| 0,30 | 10,45 | 1,6203 | 1,6203 | |
| 0,14 | 11,15 | 1,7298 | 1,4403 | |
| 0,51 | 8,50 | 1,3183 | 1,3183 | |
| 0,13 | 7,91 | 1,2272 | 1,2272 | |
| 0,10 | 7,18 | 1,1133 | 1,1133 | |
| 0,18 | 12,56 | 1,9492 | 1,0900 | |
| 0,05 | 6,34 | 0,9834 | 0,9834 | |
| 0,28 | 4,57 | 0,7094 | 0,7094 | |
| 0,73 | 22,83 | 3,5412 | 0,4832 | |
| 0,04 | 3,07 | 0,4769 | 0,4769 |
De største reduksjonene dette kvartalet
Vi bruker endringen i porteføljeallokeringen fordi dette er det mest meningsfulle målet. Endringer kan skyldes handler eller endringer i aksjekurser.
| Verdipapirer | Aksjer (MM) |
Verdi (MM$) |
Portefølje % | ΔPortefølje % |
|---|---|---|---|---|
| 0,01 | 0,95 | 0,1478 | −1,3744 | |
| 0,00 | 0,00 | −1,3699 | ||
| 0,00 | 0,27 | 0,0420 | −1,1921 | |
| 0,00 | 0,00 | −1,0485 | ||
| 0,00 | 0,00 | −0,9405 | ||
| 0,00 | 0,00 | −0,9173 | ||
| 0,58 | 7,68 | 1,1920 | −0,9114 | |
| 0,20 | 5,24 | 0,8130 | −0,8737 | |
| 0,11 | 6,93 | 1,0746 | −0,8322 | |
| 0,11 | 8,12 | 1,2590 | −0,7741 |
13F- og Fondsarkiveringer
Dette skjemaet ble sendt inn den 2016-02-09 for rapporteringsperioden 2015-12-31. Klikk på lenkeikonet for å se hele transaksjonshistorikken.
Oppgradere for å låse opp premiedata og eksportere til Excel![]() .
.
| Verdipapirer | Type | Gjennomsnittlig aksjekurs | Aksjer (MM) |
ΔAksjer (%) |
ΔAksjer (%) |
Verdi ($MM) |
Portefølje (%) |
ΔPortefølje (%) |
|
|---|---|---|---|---|---|---|---|---|---|
| GE / General Electric Company | 0,73 | −4,79 | 22,83 | 17,60 | 3,5412 | 0,4832 | |||
| INTC / Intel Corporation | 0,59 | −5,45 | 20,32 | 8,07 | 3,1516 | 0,1901 | |||
| PFE / Pfizer Inc. | 0,60 | −1,98 | 19,48 | 0,73 | 3,0213 | −0,0245 | |||
| MSFT / Microsoft Corporation | 0,34 | −4,66 | 18,98 | 19,52 | 2,9451 | 0,4427 | |||
| JNJ / Johnson & Johnson | 0,18 | −3,97 | 18,24 | 5,66 | 2,8289 | 0,1100 | |||
| BAC / Bank of America Corporation | 1,00 | −2,52 | 16,81 | 5,30 | 2,6083 | 0,0930 | |||
| VZ / Verizon Communications Inc. | 0,36 | 5,37 | 16,47 | 11,93 | 2,5554 | 0,2370 | |||
| MRK / Merck & Co., Inc. | 0,29 | 3,65 | 15,48 | 10,85 | 2,4017 | 0,2014 | |||
| PAYX / Paychex, Inc. | 0,28 | 6,03 | 15,00 | 17,74 | 2,3272 | 0,3199 | |||
| FITB / Fifth Third Bancorp | 0,74 | −3,28 | 14,78 | 2,81 | 2,2928 | 0,0281 | |||
| CSCO / Cisco Systems, Inc. | 0,53 | −1,04 | 14,31 | 2,37 | 2,2196 | 0,0177 | |||
| WFC / Wells Fargo & Company | 0,26 | 2,01 | 14,29 | 7,99 | 2,2163 | 0,1321 | |||
| XOM / Exxon Mobil Corporation | 0,18 | 3,58 | 14,04 | 8,60 | 2,1781 | 0,1414 | |||
| T / AT&T Inc. | 0,40 | 1,15 | 13,79 | 6,82 | 2,1394 | 0,1056 | |||
| ORCL / Oracle Corporation | 0,36 | −10,39 | 13,09 | −9,37 | 2,0305 | −0,2446 | |||
| WM / Waste Management, Inc. | 0,24 | −4,92 | 12,64 | 1,88 | 1,9613 | 0,0063 | |||
| SLB / Schlumberger Limited | 0,18 | 127,82 | 12,56 | 130,38 | 1,9492 | 1,0900 | |||
| UPS / United Parcel Service, Inc. | 0,13 | −8,94 | 12,11 | −11,20 | 1,8784 | −0,2699 | |||
| WMT / Walmart Inc. | 0,19 | 11,64 | 11,94 | 5,54 | 1,8521 | 0,0700 | |||
| PEP / PepsiCo, Inc. | 0,12 | 14,24 | 11,50 | 21,04 | 1,7841 | 0,2872 | |||
| VOD / Vodafone Group Public Limited Company - Depositary Receipt (Common Stock) | 0,35 | 14,31 | 11,42 | 16,19 | 1,7717 | 0,2232 | |||
| ABT / Abbott Laboratories | 0,25 | −4,94 | 11,36 | 6,15 | 1,7629 | 0,0763 | |||
| BA / The Boeing Company | 0,08 | −5,54 | 11,21 | 4,29 | 1,7382 | 0,0457 | |||
| PG / The Procter & Gamble Company | 0,14 | 449,41 | 11,15 | 506,69 | 1,7298 | 1,4403 | |||
| KMB / Kimberly-Clark Corporation | 0,09 | −4,60 | 11,01 | 11,37 | 1,7081 | 0,1506 | |||
| GOOG / Alphabet Inc. | 0,01 | −4,23 | 10,86 | 19,45 | 1,6853 | 0,2525 | |||
| TRI / Thomson Reuters Corporation | 0,28 | −3,94 | 10,74 | −9,69 | 1,6662 | −0,2073 | |||
| AAPL / Apple Inc. | 0,10 | −6,40 | 10,57 | −10,67 | 1,6392 | −0,2242 | |||
| M / Macy's, Inc. | 0,30 | 37,71 | 10,45 | −18,75 | 1,6203 | 1,6203 | |||
| MS / Morgan Stanley | 0,33 | −20,13 | 10,37 | −19,34 | 1,6087 | −0,4167 | |||
| SYY / Sysco Corporation | 0,24 | 7,29 | 9,93 | 12,88 | 1,5403 | 0,1546 | |||
| CME / CME Group Inc. | 0,11 | −1,23 | 9,84 | −3,51 | 1,5261 | −0,0801 | |||
| CSX / CSX Corporation | 0,38 | −19,78 | 9,80 | −22,62 | 1,5201 | −0,4748 | |||
| NLY / Annaly Capital Management, Inc. | 1,01 | −20,91 | 9,52 | −24,84 | 1,4760 | −0,5182 | |||
| PYPL / PayPal Holdings, Inc. | 0,25 | −2,44 | 8,90 | 13,79 | 1,3814 | 0,1485 | |||
| FAST / Fastenal Company | 0,22 | 5,99 | 8,90 | 18,18 | 1,3805 | 0,1942 | |||
| COST / Costco Wholesale Corporation | 0,05 | −6,81 | 8,84 | 4,11 | 1,3715 | 0,0337 | |||
| INFY / Infosys Limited - Depositary Receipt (Common Stock) | 0,51 | 8,50 | 1,3183 | 1,3183 | |||||
| TGT / Target Corporation | 0,11 | −31,88 | 8,12 | −37,11 | 1,2590 | −0,7741 | |||
| ABBV / AbbVie Inc. | 0,13 | 7,91 | 1,2272 | 1,2272 | |||||
| KEY / KeyCorp | 0,58 | −43,24 | 7,68 | −42,45 | 1,1920 | −0,9114 | |||
| TRV / The Travelers Companies, Inc. | 0,07 | −6,26 | 7,67 | 6,30 | 1,1891 | 0,0531 | |||
| F / Ford Motor Company | 0,54 | −7,41 | 7,63 | −3,87 | 1,1841 | −0,0667 | |||
| CLB / Core Laboratories Inc. | 0,07 | 1,50 | 7,55 | 10,55 | 1,1715 | 0,0954 | |||
| ETN / Eaton Corporation plc | 0,14 | 4,20 | 7,53 | 5,71 | 1,1687 | 0,0460 | |||
| YUM / Yum! Brands, Inc. | 0,10 | 7,18 | 1,1133 | 1,1133 | |||||
| VFC / V.F. Corporation | 0,11 | −37,29 | 6,93 | −42,77 | 1,0746 | −0,8322 | |||
| BBBY / Bed Bath & Beyond, Inc. | 0,14 | 41,42 | 6,81 | 19,68 | 1,0567 | 0,1600 | |||
| IHRMF / iShares Public Limited Company - iShares MSCI Japan UCITS ETF USD (Dist) | 0,55 | −4,78 | 6,71 | 0,98 | 1,0403 | −0,0059 | |||
| IBM / International Business Machines Corporation | 0,05 | 6,34 | 0,9834 | 0,9834 | |||||
| 847560109 / Spectra Energy Corp. | 0,24 | 9,69 | 5,75 | −0,03 | 0,8920 | −0,0142 | |||
| VWO / Vanguard International Equity Index Funds - Vanguard FTSE Emerging Markets ETF | 0,17 | −32,57 | 5,63 | −33,35 | 0,8729 | −0,4570 | |||
| Market Vectors Biotech ETF / (57060U183) | 0,04 | −9,81 | 5,45 | 0,15 | 0,0000 | ||||
| EMC / Global X Funds - Global X Emerging Markets Great Consumer ETF | 0,20 | −53,95 | 5,24 | −51,05 | 0,8130 | −0,8737 | |||
| IP / International Paper Company | 0,13 | −48,20 | 4,74 | −48,32 | 0,7353 | −0,7096 | |||
| NYCB / Flagstar Financial, Inc. | 0,28 | 4,57 | 0,7094 | 0,7094 | |||||
| DVY / iShares Trust - iShares Select Dividend ETF | 0,05 | 32,87 | 4,07 | 37,23 | 0,6307 | 0,1640 | |||
| RSP / Invesco Exchange-Traded Fund Trust - Invesco S&P 500 Equal Weight ETF | 0,04 | 1,15 | 3,07 | 5,38 | 0,4769 | 0,4769 | |||
| EEM / iShares, Inc. - iShares MSCI Emerging Markets ETF | 0,08 | 518,60 | 2,73 | 508,02 | 0,4235 | 0,3528 | |||
| HDV / iShares Trust - iShares Core High Dividend ETF | 0,03 | 19,56 | 2,54 | 26,15 | 0,3943 | 0,0769 | |||
| 153501101 / Central Fund of Canada Ltd. | 0,24 | −10,98 | 2,44 | −16,06 | 0,3787 | −0,0794 | |||
| SPY / SPDR S&P 500 ETF | 0,01 | −4,55 | 2,23 | 1,54 | 0,3467 | −0,0000 | |||
| VFINX / Vanguard Index Funds - Vanguard Index Trust 500 Index Fund | 0,01 | −10,45 | 1,66 | −4,75 | 0,2580 | 0,2580 | |||
| KO / The Coca-Cola Company | 0,03 | 26,95 | 1,40 | 35,95 | 0,2176 | 0,0551 | |||
| USB / U.S. Bancorp | 0,02 | 7,59 | 1,03 | 11,98 | 0,1595 | 0,0149 | |||
| DOW / Dow Inc. | 0,01 | −92,86 | 0,95 | −90,14 | 0,1478 | −1,3744 | |||
| SBAC / SBA Communications Corporation | 0,01 | 0,00 | 0,88 | 0,23 | 0,1367 | −0,0018 | |||
| EMR / Emerson Electric Co. | 0,02 | 0,00 | 0,77 | 0,1199 | 0,1199 | ||||
| MMM / 3M Company | 0,00 | −0,91 | 0,74 | 5,28 | 0,1145 | 0,0041 | |||
| MO / Altria Group, Inc. | 0,01 | 54,44 | 0,63 | 65,09 | 0,0976 | 0,0376 | |||
| QQQ / Invesco QQQ Trust, Series 1 | 0,01 | 3,03 | 0,61 | 13,41 | 0,0945 | 0,0945 | |||
| CL / Colgate-Palmolive Company | 0,01 | 19,41 | 0,53 | 25,54 | 0,0816 | 0,0156 | |||
| GSK / GSK plc - Depositary Receipt (Common Stock) | 0,01 | 4,75 | 0,51 | 10,11 | 0,0794 | 0,0062 | |||
| MCD / McDonald's Corporation | 0,00 | 0,00 | 0,48 | 19,85 | 0,0740 | 0,0113 | |||
| VEU / Vanguard International Equity Index Funds - Vanguard FTSE All-World ex-US ETF | 0,01 | 2,94 | 0,46 | 4,76 | 0,0717 | 0,0022 | |||
| RDS.B / Shell Plc - ADR | 0,01 | −21,82 | 0,46 | −24,17 | 0,0710 | −0,0241 | |||
| MKC / McCormick & Company, Incorporated | 0,01 | 6,06 | 0,45 | 10,32 | 0,0697 | 0,0055 | |||
| GLD / SPDR Gold Trust | 0,00 | −0,90 | 0,44 | −5,93 | 0,0689 | −0,0055 | |||
| 904784709 / Unilever N.V. | 0,01 | −2,06 | 0,41 | 5,37 | 0,0639 | 0,0023 | |||
| HD / The Home Depot, Inc. | 0,00 | 0,00 | 0,33 | 14,53 | 0,0513 | 0,0058 | |||
| MDY / SPDR S&P MidCap 400 ETF Trust | 0,00 | 0,00 | 0,29 | 2,10 | 0,0453 | 0,0002 | |||
| TMO / Thermo Fisher Scientific Inc. | 0,00 | 0,00 | 0,28 | 15,92 | 0,0441 | 0,0055 | |||
| PM / Philip Morris International Inc. | 0,00 | 0,00 | 0,27 | 0,0420 | 0,0420 | ||||
| DIS / The Walt Disney Company | 0,00 | −96,63 | 0,27 | −96,54 | 0,0420 | −1,1921 | |||
| JOF / Japan Smaller Capitalization Fund, Inc. | 0,03 | −3,89 | 0,26 | −3,36 | 0,0402 | −0,0020 | |||
| STZ / Constellation Brands, Inc. | 0,00 | −5,26 | 0,26 | 7,56 | 0,0397 | 0,0022 | |||
| IAU / iShares Gold Trust | 0,02 | 1,86 | 0,25 | −3,49 | 0,0386 | −0,0020 | |||
| NKE / NIKE, Inc. | 0,00 | 0,24 | 0,0379 | 0,0379 | |||||
| AZO / AutoZone, Inc. | 0,00 | 0,00 | 0,22 | 2,76 | 0,0346 | 0,0004 | |||
| RDS.A / Shell Plc - ADR (Representing Ordinary Shares - Class A) | 0,00 | −4,08 | 0,21 | −7,33 | 0,0334 | −0,0032 | |||
| XLK / The Select Sector SPDR Trust - The Technology Select Sector SPDR Fund | 0,00 | 0,20 | 0,0312 | 0,0312 | |||||
| EMF / Templeton Emerging Markets Fund | 0,02 | 7,98 | 0,16 | −2,41 | 0,0251 | −0,0010 | |||
| JEQ / Abrdn Japan Equity Fund Inc | 0,02 | −25,97 | 0,13 | −16,46 | 0,0205 | −0,0044 | |||
| PHYS / Sprott Physical Gold Trust | 0,01 | 0,00 | 0,13 | −5,07 | 0,0203 | −0,0014 | |||
| TRST / TrustCo Bank Corp NY | 0,02 | −36,36 | 0,11 | −33,54 | 0,0166 | −0,0088 | |||
| 300487105 / EVINE Live Inc. | 0,01 | 0,02 | 0,0029 | 0,0029 | |||||
| DML / Denison Mines Corp. | 0,01 | 0,00 | 0,01 | 16,67 | 0,0011 | 0,0001 | |||
| 23437P208 / Daleco Resources Corp. | 0,12 | 0,00 | 0,00 | −20,00 | 0,0006 | −0,0002 | |||
| DKS / DICK'S Sporting Goods, Inc. | 0,00 | −100,00 | 0,00 | −100,00 | −1,0485 | ||||
| CEF Invesco Value Fund / (EGB32P104) | 0,09 | 0,00 | 0,00 | 0,0000 | |||||
| CMCSA / Comcast Corporation | 0,00 | −100,00 | 0,00 | −100,00 | −1,3699 | ||||
| DOW / Dow Inc. | 0,00 | −100,00 | 0,00 | −100,00 | 0,0000 | 0,0000 | |||
| GG / Goldcorp, Inc. | 0,00 | −100,00 | 0,00 | −100,00 | −0,0203 | ||||
| SEAOF / SeaCo Ltd. | 0,05 | 0,00 | 0,00 | 0,0000 | 0,0000 | ||||
| AUY / Yamana Gold Inc. | 0,00 | −100,00 | 0,00 | −100,00 | −0,0035 | ||||
| COP / ConocoPhillips | 0,00 | −100,00 | 0,00 | −100,00 | −0,7478 | ||||
| STJ / St. Jude Medical, Inc. | 0,00 | −100,00 | 0,00 | −100,00 | −0,9173 | ||||
| LNC / Lincoln National Corporation | 0,00 | −100,00 | 0,00 | −100,00 | −0,9405 | ||||
| Advanta Corp. / (007942105) | 0,01 | 0,00 | 0,00 | 0,0000 |