Grunnleggende statistikk
| Porteføljeverdi | $ 15 385 906 |
| Nåværende posisjoner | 80 |
Siste beholdninger, prestasjoner, forvaltet kapital (fra 13F, 13D)
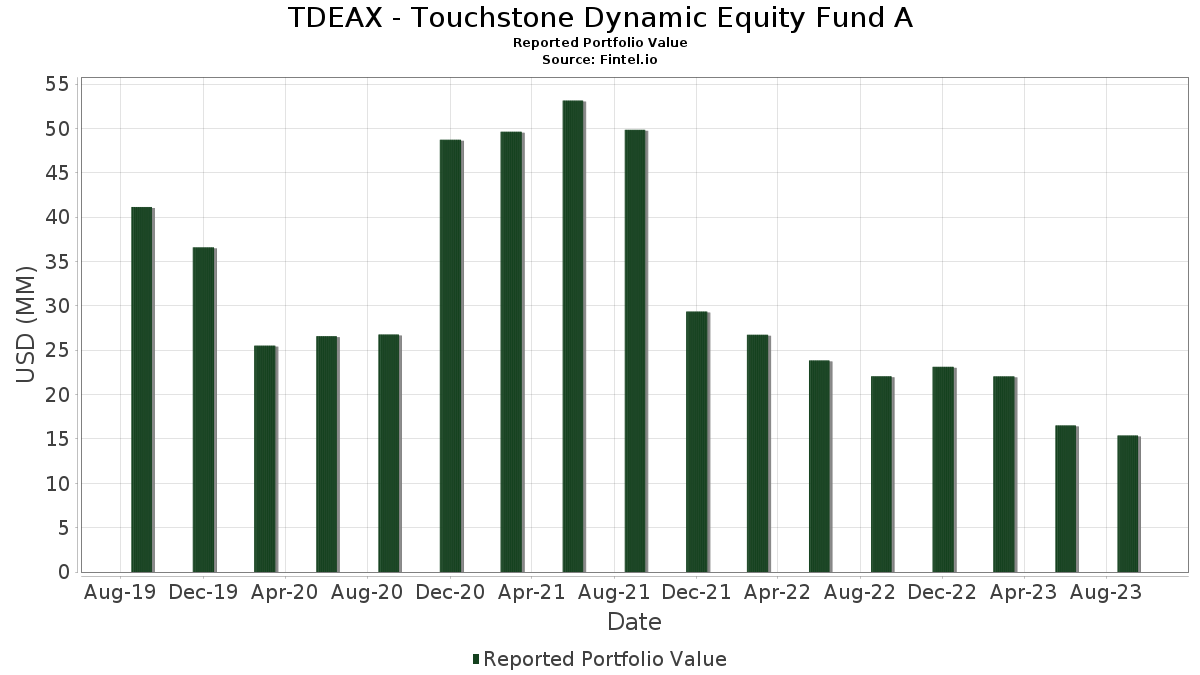
TDEAX - Touchstone Dynamic Equity Fund A har oppgitt 80 totale beholdninger i sine siste SEC-arkiveringer. Siste porteføljeverdi er beregnet til 15 385 906 USD. Faktisk forvaltet kapital (AUM) er denne verdien pluss kontanter (som ikke er oppgitt). TDEAX - Touchstone Dynamic Equity Fund As største beholdninger er AbbVie Inc. (US:ABBV) , The Kroger Co. (US:KR) , Merck & Co., Inc. (US:MRK) , Kellanova (US:K) , and Verizon Communications Inc. (US:VZ) . TDEAX - Touchstone Dynamic Equity Fund As nye posisjoner inkluderer XP Inc. (US:XP) , Nu Holdings Ltd. (US:NU) , Axon Enterprise, Inc. (US:AXON) , .
De største økningene dette kvartalet
Vi bruker endringen i porteføljeallokeringen fordi dette er det mest meningsfulle målet. Endringer kan skyldes handler eller endringer i aksjekursene.
| Verdipapirer | Aksjer (MM) |
Verdi (MM$) |
Portefølje % | ΔPortefølje % |
|---|---|---|---|---|
| 0,00 | 0,47 | 3,0596 | 1,0635 | |
| 0,00 | 0,41 | 2,6677 | 0,8137 | |
| 0,00 | 0,12 | 0,7892 | 0,7892 | |
| 0,02 | 0,26 | 1,7094 | 0,6479 | |
| 0,00 | 0,10 | 0,6444 | 0,6444 | |
| 0,00 | 0,11 | 0,7231 | 0,6085 | |
| 0,00 | 0,19 | 1,2092 | 0,5564 | |
| 0,00 | 0,14 | 0,9035 | 0,5541 | |
| 0,00 | 0,25 | 1,6357 | 0,4998 | |
| 0,00 | 0,43 | 2,8085 | 0,4696 |
De største reduksjonene dette kvartalet
Vi bruker endringen i porteføljeallokeringen fordi dette er det mest meningsfulle målet. Endringer kan skyldes handler eller endringer i aksjekurser.
| Verdipapirer | Aksjer (MM) |
Verdi (MM$) |
Portefølje % | ΔPortefølje % |
|---|---|---|---|---|
| 0,13 | 0,13 | 0,8385 | −0,8515 | |
| 0,00 | 0,12 | 0,7814 | −0,5779 | |
| 0,00 | 0,02 | 0,1510 | −0,5667 | |
| 0,00 | 0,24 | 1,5535 | −0,5099 | |
| 0,00 | 0,11 | 0,7387 | −0,4773 | |
| 0,00 | 0,32 | 2,0866 | −0,4682 | |
| 0,00 | 0,04 | 0,2556 | −0,4262 | |
| 0,00 | 0,07 | 0,4287 | −0,4202 | |
| 0,01 | 0,26 | 1,7256 | −0,3837 | |
| 0,00 | 0,07 | 0,4656 | −0,3772 |
13F- og Fondsarkiveringer
Dette skjemaet ble sendt inn den 2023-11-24 for rapporteringsperioden 2023-09-30. Klikk på lenkeikonet for å se hele transaksjonshistorikken.
Oppgradere for å låse opp premiedata og eksportere til Excel![]() .
.
| Verdipapirer | Type | Gjennomsnittlig aksjekurs | Aksjer (MM) |
ΔAksjer (%) |
ΔAksjer (%) |
Verdi ($MM) |
Portefølje (%) |
ΔPortefølje (%) |
|
|---|---|---|---|---|---|---|---|---|---|
| ABBV / AbbVie Inc. | 0,00 | 28,97 | 0,47 | 42,55 | 3,0596 | 1,0635 | |||
| KR / The Kroger Co. | 0,01 | −3,86 | 0,45 | −8,40 | 2,9147 | −0,0495 | |||
| MRK / Merck & Co., Inc. | 0,00 | −1,60 | 0,44 | −12,10 | 2,8868 | −0,1742 | |||
| K / Kellanova | 0,01 | 3,94 | 0,44 | −8,30 | 2,8844 | −0,0414 | |||
| VZ / Verizon Communications Inc. | 0,01 | 20,71 | 0,44 | 5,25 | 2,8740 | 0,3307 | |||
| JNJ / Johnson & Johnson | 0,00 | 18,79 | 0,43 | 11,95 | 2,8085 | 0,4696 | |||
| LLY / Eli Lilly and Company | 0,00 | −26,40 | 0,43 | −15,72 | 2,7983 | −0,2920 | |||
| GIS / General Mills, Inc. | 0,01 | 14,54 | 0,43 | −4,45 | 2,7961 | 0,0724 | |||
| PFE / Pfizer Inc. | 0,01 | 0,08 | 0,41 | −9,45 | 2,6871 | −0,0768 | |||
| HUM / Humana Inc. | 0,00 | 23,10 | 0,41 | 34,10 | 2,6677 | 0,8137 | |||
| CLX / The Clorox Company | 0,00 | 1,19 | 0,40 | −16,60 | 2,6193 | −0,3048 | |||
| YUMC / Yum China Holdings, Inc. | 0,01 | 11,88 | 0,40 | 10,34 | 2,5770 | 0,4028 | |||
| UTHR / United Therapeutics Corporation | 0,00 | −11,44 | 0,39 | −9,35 | 2,5270 | −0,0691 | |||
| NEM / Newmont Corporation | 0,01 | 2,49 | 0,39 | −11,21 | 2,5268 | −0,1229 | |||
| HRL / Hormel Foods Corporation | 0,01 | −3,99 | 0,38 | −9,29 | 2,4837 | −0,0632 | |||
| TTWO / Take-Two Interactive Software, Inc. | 0,00 | −12,95 | 0,35 | −16,95 | 2,2682 | −0,2742 | |||
| SLB / Schlumberger Limited | 0,01 | −20,39 | 0,33 | −5,44 | 2,1492 | 0,0318 | |||
| SJM / The J. M. Smucker Company | 0,00 | −8,65 | 0,32 | −23,99 | 2,0866 | −0,4682 | |||
| BMY / Bristol-Myers Squibb Company | 0,00 | 2,81 | 0,28 | −6,67 | 1,8237 | 0,0043 | |||
| NLOK / NortonLifeLock Inc | 0,01 | −20,10 | 0,26 | −23,92 | 1,7256 | −0,3837 | |||
| T / AT&T Inc. | 0,02 | 59,19 | 0,26 | 49,71 | 1,7094 | 0,6479 | |||
| META / Meta Platforms, Inc. | 0,00 | −16,62 | 0,25 | −12,76 | 1,6481 | −0,1108 | |||
| FCNCA / First Citizens BancShares, Inc. | 0,00 | 24,66 | 0,25 | 34,22 | 1,6357 | 0,4998 | |||
| LVS / Las Vegas Sands Corp. | 0,01 | −2,47 | 0,24 | −22,78 | 1,5905 | −0,3303 | |||
| DLTR / Dollar Tree, Inc. | 0,00 | −5,52 | 0,24 | −30,00 | 1,5535 | −0,5099 | |||
| CHD / Church & Dwight Co., Inc. | 0,00 | −13,57 | 0,24 | −21,07 | 1,5395 | −0,2742 | |||
| FSLR / First Solar, Inc. | 0,00 | 4,56 | 0,23 | −11,07 | 1,5206 | −0,0720 | |||
| EPAM / EPAM Systems, Inc. | 0,00 | 3,53 | 0,23 | 17,80 | 1,4653 | 0,3072 | |||
| CPB / The Campbell's Company | 0,01 | 15,61 | 0,22 | 3,85 | 1,4087 | 0,1466 | |||
| KHC / The Kraft Heinz Company | 0,01 | −7,16 | 0,20 | −12,23 | 1,3120 | −0,0763 | |||
| REGN / Regeneron Pharmaceuticals, Inc. | 0,00 | −18,79 | 0,20 | −7,01 | 1,2969 | −0,0011 | |||
| UNH / UnitedHealth Group Incorporated | 0,00 | 28,62 | 0,20 | 34,93 | 1,2838 | 0,3980 | |||
| OXY / Occidental Petroleum Corporation | 0,00 | −7,49 | 0,19 | 2,12 | 1,2574 | 0,1107 | |||
| ALNY / Alnylam Pharmaceuticals, Inc. | 0,00 | −13,90 | 0,19 | −20,08 | 1,2502 | −0,1995 | |||
| PANW / Palo Alto Networks, Inc. | 0,00 | 37,84 | 0,19 | 26,49 | 1,2458 | 0,3288 | |||
| MRNA / Moderna, Inc. | 0,00 | −2,19 | 0,19 | −16,74 | 1,2309 | −0,1471 | |||
| MCK / McKesson Corporation | 0,00 | 69,44 | 0,19 | 72,90 | 1,2092 | 0,5564 | |||
| SMCI / Super Micro Computer, Inc. | 0,00 | 37,76 | 0,19 | 51,64 | 1,2054 | 0,4650 | |||
| KMB / Kimberly-Clark Corporation | 0,00 | −17,24 | 0,18 | −27,64 | 1,1639 | −0,3316 | |||
| ED / Consolidated Edison, Inc. | 0,00 | −17,37 | 0,18 | −22,03 | 1,1580 | −0,2208 | |||
| CBOE / Cboe Global Markets, Inc. | 0,00 | −17,30 | 0,17 | −6,08 | 1,1088 | 0,0061 | |||
| BAX / Baxter International Inc. | 0,00 | −4,56 | 0,16 | −20,79 | 1,0433 | −0,1852 | |||
| BJ / BJ's Wholesale Club Holdings, Inc. | 0,00 | 20,53 | 0,14 | 37,14 | 0,9388 | 0,2987 | |||
| HSY / The Hershey Company | 0,00 | 23,10 | 0,14 | −1,39 | 0,9303 | 0,0524 | |||
| RNR / RenaissanceRe Holdings Ltd. | 0,00 | 126,86 | 0,14 | 142,11 | 0,9035 | 0,5541 | |||
| SNAP / Snap Inc. | 0,02 | −7,55 | 0,13 | −30,21 | 0,8738 | −0,2953 | |||
| DGCXX / Dreyfus Government Cash Management Funds - Dreyfus Government Cash Management Fund Institutional Shares | 0,13 | −53,81 | 0,13 | −53,96 | 0,8385 | −0,8515 | |||
| PGR / The Progressive Corporation | 0,00 | 0,12 | 0,7892 | 0,7892 | |||||
| CAG / Conagra Brands, Inc. | 0,00 | −34,20 | 0,12 | −46,87 | 0,7814 | −0,5779 | |||
| CHRW / C.H. Robinson Worldwide, Inc. | 0,00 | −38,05 | 0,11 | −43,50 | 0,7387 | −0,4773 | |||
| SRPT / Sarepta Therapeutics, Inc. | 0,00 | 455,15 | 0,11 | 516,67 | 0,7231 | 0,6085 | |||
| LNG / Cheniere Energy, Inc. | 0,00 | 14,36 | 0,11 | 25,00 | 0,6884 | 0,1740 | |||
| NVDA / NVIDIA Corporation | 0,00 | 17,73 | 0,10 | 21,18 | 0,6770 | 0,1564 | |||
| FIS / Fidelity National Information Services, Inc. | 0,00 | −4,48 | 0,10 | −3,74 | 0,6756 | 0,0240 | |||
| ANET / Arista Networks Inc | 0,00 | 0,10 | 0,6444 | 0,6444 | |||||
| EOG / EOG Resources, Inc. | 0,00 | −25,83 | 0,10 | −17,95 | 0,6307 | −0,0839 | |||
| UBER / Uber Technologies, Inc. | 0,00 | −29,74 | 0,09 | −25,40 | 0,6155 | −0,1500 | |||
| DG / Dollar General Corporation | 0,00 | 264,66 | 0,09 | 128,21 | 0,5829 | 0,3441 | |||
| PXD / Pioneer Natural Resources Company | 0,00 | −15,22 | 0,08 | −5,68 | 0,5411 | 0,0049 | |||
| NBIX / Neurocrine Biosciences, Inc. | 0,00 | −32,50 | 0,08 | −19,61 | 0,5370 | −0,0838 | |||
| CME / CME Group Inc. | 0,00 | 46,04 | 0,08 | 57,14 | 0,5046 | 0,2069 | |||
| RBLX / Roblox Corporation | 0,00 | −28,43 | 0,07 | −48,92 | 0,4656 | −0,3772 | |||
| FANG / Diamondback Energy, Inc. | 0,00 | −60,13 | 0,07 | −53,57 | 0,4287 | −0,4202 | |||
| IBM / International Business Machines Corporation | 0,00 | −4,64 | 0,06 | 0,00 | 0,3947 | 0,0272 | |||
| PLTR / Palantir Technologies Inc. | 0,00 | 154,26 | 0,06 | 176,19 | 0,3794 | 0,2463 | |||
| SNOW / Snowflake Inc. | 0,00 | 11,61 | 0,06 | −3,39 | 0,3731 | 0,0146 | |||
| GOOG / Alphabet Inc. | 0,00 | 17,86 | 0,06 | 27,27 | 0,3683 | 0,1014 | |||
| CVX / Chevron Corporation | 0,00 | −13,77 | 0,06 | −8,33 | 0,3646 | −0,0027 | |||
| OKTA / Okta, Inc. | 0,00 | −14,54 | 0,05 | 0,00 | 0,3307 | 0,0242 | |||
| GOOGL / Alphabet Inc. | 0,00 | 9,71 | 0,05 | 21,95 | 0,3272 | 0,0733 | |||
| XP / XP Inc. | 0,00 | 0,05 | 0,3218 | 0,3218 | |||||
| NU / Nu Holdings Ltd. | 0,01 | 0,04 | 0,2689 | 0,2689 | |||||
| PCG / PG&E Corporation | 0,00 | −62,62 | 0,04 | −65,18 | 0,2556 | −0,4262 | |||
| CF / CF Industries Holdings, Inc. | 0,00 | −20,12 | 0,04 | 0,00 | 0,2306 | 0,0130 | |||
| ORCL / Oracle Corporation | 0,00 | 3,42 | 0,03 | −8,82 | 0,2083 | −0,0025 | |||
| AXON / Axon Enterprise, Inc. | 0,00 | 0,03 | 0,1892 | 0,1892 | |||||
| VLO / Valero Energy Corporation | 0,00 | 0,00 | 0,03 | 21,74 | 0,1864 | 0,0428 | |||
| MSFT / Microsoft Corporation | 0,00 | −42,31 | 0,03 | −47,17 | 0,1851 | −0,1370 | |||
| SEDG / SolarEdge Technologies, Inc. | 0,00 | −59,32 | 0,02 | −80,51 | 0,1510 | −0,5667 | |||
| BG / Bunge Global SA | 0,00 | −42,12 | 0,02 | 53,33 | 0,1502 | 0,0943 |