Grunnleggende statistikk
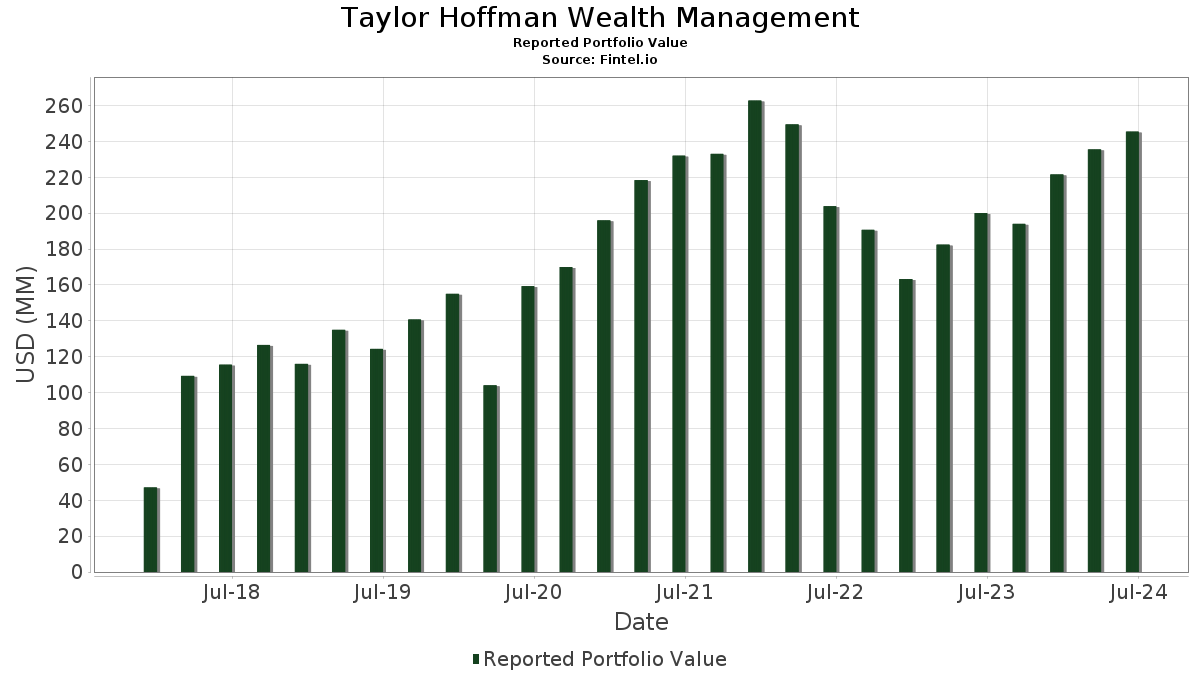
| Porteføljeverdi | $ 245 480 702 |
| Nåværende posisjoner | 111 |
Siste beholdninger, prestasjoner, forvaltet kapital (fra 13F, 13D)
Taylor Hoffman Wealth Management har oppgitt 111 totale beholdninger i sine siste SEC-arkiveringer. Siste porteføljeverdi er beregnet til 245 480 702 USD. Faktisk forvaltet kapital (AUM) er denne verdien pluss kontanter (som ikke er oppgitt). Taylor Hoffman Wealth Managements største beholdninger er Apple Inc. (US:AAPL) , Arista Networks Inc (US:ANET) , Applied Materials, Inc. (US:AMAT) , Meta Platforms, Inc. (US:META) , and Lam Research Corporation (US:LRCX) . Taylor Hoffman Wealth Managements nye posisjoner inkluderer NVR, Inc. (US:NVR) , .
De største økningene dette kvartalet
Vi bruker endringen i porteføljeallokeringen fordi dette er det mest meningsfulle målet. Endringer kan skyldes handler eller endringer i aksjekursene.
| Verdipapirer | Aksjer (MM) |
Verdi (MM$) |
Portefølje % | ΔPortefølje % |
|---|---|---|---|---|
| 0,10 | 20,96 | 8,5383 | 1,5196 | |
| 0,02 | 2,85 | 1,1614 | 1,1614 | |
| 0,04 | 12,76 | 5,1988 | 0,7378 | |
| 0,04 | 7,05 | 2,8732 | 0,4639 | |
| 0,01 | 8,36 | 3,4054 | 0,4478 | |
| 0,04 | 10,61 | 4,3201 | 0,4088 | |
| 0,01 | 6,43 | 2,6175 | 0,2035 | |
| 0,01 | 9,30 | 3,7888 | 0,1690 | |
| 0,00 | 2,83 | 1,1533 | 0,1390 | |
| 0,00 | 0,33 | 0,1341 | 0,1341 |
De største reduksjonene dette kvartalet
Vi bruker endringen i porteføljeallokeringen fordi dette er det mest meningsfulle målet. Endringer kan skyldes handler eller endringer i aksjekurser.
| Verdipapirer | Aksjer (MM) |
Verdi (MM$) |
Portefølje % | ΔPortefølje % |
|---|---|---|---|---|
| 0,00 | 0,00 | −1,6792 | ||
| 0,02 | 5,90 | 2,4054 | −0,3933 | |
| 0,02 | 5,10 | 2,0759 | −0,3145 | |
| 0,04 | 3,30 | 1,3449 | −0,3062 | |
| 0,02 | 3,55 | 1,4469 | −0,2405 | |
| 0,06 | 4,35 | 1,7739 | −0,2271 | |
| 0,06 | 4,05 | 1,6506 | −0,2196 | |
| 0,05 | 2,49 | 1,0145 | −0,2014 | |
| 0,02 | 4,01 | 1,6354 | −0,1990 | |
| 0,06 | 4,23 | 1,7226 | −0,1895 |
13F- og Fondsarkiveringer
Dette skjemaet ble sendt inn den 2024-08-09 for rapporteringsperioden 2024-06-30. Klikk på lenkeikonet for å se hele transaksjonshistorikken.
Oppgradere for å låse opp premiedata og eksportere til Excel![]() .
.
| Verdipapirer | Type | Gjennomsnittlig aksjekurs | Aksjer (MM) |
ΔAksjer (%) |
ΔAksjer (%) |
Verdi ($MM) |
Portefølje (%) |
ΔPortefølje (%) |
|
|---|---|---|---|---|---|---|---|---|---|
| AAPL / Apple Inc. | 0,10 | 0,30 | 20,96 | 26,77 | 8,5383 | 1,5196 | |||
| ANET / Arista Networks Inc | 0,04 | −1,27 | 12,76 | 21,45 | 5,1988 | 0,7378 | |||
| AMAT / Applied Materials, Inc. | 0,04 | −0,01 | 10,61 | 15,11 | 4,3201 | 0,4088 | |||
| META / Meta Platforms, Inc. | 0,02 | 0,64 | 10,46 | 4,60 | 4,2604 | 0,0157 | |||
| LRCX / Lam Research Corporation | 0,01 | −0,08 | 9,30 | 9,08 | 3,7888 | 0,1690 | |||
| FICO / Fair Isaac Corporation | 0,01 | 0,20 | 8,36 | 20,00 | 3,4054 | 0,4478 | |||
| GOOGL / Alphabet Inc. | 0,04 | 2,51 | 7,05 | 24,28 | 2,8732 | 0,4639 | |||
| ADBE / Adobe Inc. | 0,01 | 1,82 | 6,43 | 13,00 | 2,6175 | 0,2035 | |||
| DE / Deere & Company | 0,02 | 1,91 | 5,90 | −10,44 | 2,4054 | −0,3933 | |||
| VEA / Vanguard Tax-Managed Funds - Vanguard FTSE Developed Markets ETF | 0,11 | 0,85 | 5,35 | −0,58 | 2,1804 | −0,1051 | |||
| SNA / Snap-on Incorporated | 0,02 | 4,36 | 5,10 | −9,50 | 2,0759 | −0,3145 | |||
| GJR / Strats Trust For Procter & Gambel Security - Preferred Security | 0,03 | 1,47 | 5,04 | 1,78 | 2,0544 | −0,0495 | |||
| EBAY / eBay Inc. | 0,10 | 2,39 | 5,03 | 2,20 | 2,0476 | −0,0404 | |||
| MSFT / Microsoft Corporation | 0,01 | 2,00 | 5,02 | 10,73 | 2,0436 | 0,1202 | |||
| CSCO / Cisco Systems, Inc. | 0,10 | 4,33 | 4,80 | −0,66 | 1,9544 | −0,0960 | |||
| AWI / Armstrong World Industries, Inc. | 0,04 | 6,67 | 4,76 | −4,30 | 1,9399 | −0,1728 | |||
| GNTX / Gentex Corporation | 0,13 | 5,60 | 4,51 | −1,74 | 1,8365 | −0,1113 | |||
| PAYX / Paychex, Inc. | 0,04 | 2,28 | 4,48 | −2,54 | 1,8267 | −0,1269 | |||
| BND / Vanguard Bond Index Funds - Vanguard Total Bond Market ETF | 0,06 | −6,09 | 4,35 | −7,62 | 1,7739 | −0,2271 | |||
| CNS / Cohen & Steers, Inc. | 0,06 | 1,84 | 4,23 | −6,13 | 1,7226 | −0,1895 | |||
| TROW / T. Rowe Price Group, Inc. | 0,04 | 2,50 | 4,18 | −4,29 | 1,7009 | −0,1509 | |||
| SPGI / S&P Global Inc. | 0,01 | 1,78 | 4,17 | 6,75 | 1,7003 | 0,0408 | |||
| MCO / Moody's Corporation | 0,01 | 1,70 | 4,11 | 9,07 | 1,6760 | 0,0745 | |||
| SEIC / SEI Investments Company | 0,06 | 2,43 | 4,05 | −8,04 | 1,6506 | −0,2196 | |||
| UNP / Union Pacific Corporation | 0,02 | 1,62 | 4,01 | −7,08 | 1,6354 | −0,1990 | |||
| CHD / Church & Dwight Co., Inc. | 0,04 | 1,01 | 3,81 | 1,55 | 1,5507 | −0,0407 | |||
| JNJ / Johnson & Johnson | 0,02 | 3,65 | 3,64 | −4,03 | 1,4824 | −0,1276 | |||
| QLYS / Qualys, Inc. | 0,02 | 4,80 | 3,55 | −10,64 | 1,4469 | −0,2405 | |||
| ALSN / Allison Transmission Holdings, Inc. | 0,05 | 4,28 | 3,49 | −3,68 | 1,4201 | −0,1165 | |||
| EA / Electronic Arts Inc. | 0,02 | 2,89 | 3,39 | 6,50 | 1,3824 | 0,0297 | |||
| GGG / Graco Inc. | 0,04 | 1,95 | 3,30 | −15,12 | 1,3449 | −0,3062 | |||
| VRSN / VeriSign, Inc. | 0,02 | 2,85 | 1,1614 | 1,1614 | |||||
| FTXP / Foothills Exploration, Inc. | 0,00 | 0,00 | 2,83 | 18,50 | 1,1533 | 0,1390 | |||
| MNST / Monster Beverage Corporation | 0,05 | 3,30 | 2,49 | −13,06 | 1,0145 | −0,2014 | |||
| VOO / Vanguard Index Funds - Vanguard S&P 500 ETF | 0,00 | 7,45 | 2,40 | 12,05 | 0,9773 | 0,0684 | |||
| BKFOF / Brookfield Corporation - Preferred Stock | 0,05 | 0,65 | 1,93 | −1,64 | 0,7845 | −0,0464 | |||
| VUG / Vanguard Index Funds - Vanguard Growth ETF | 0,01 | −2,08 | 1,92 | 7,16 | 0,7805 | 0,0215 | |||
| CBOE / Cboe Global Markets, Inc. | 0,01 | 0,00 | 1,47 | −6,45 | 0,5974 | −0,0679 | |||
| NVDD / Direxion Shares ETF Trust - Direxion Daily NVDA Bear 1X Shares | 0,01 | 846,37 | 1,43 | 30,14 | 0,5808 | 0,1159 | |||
| PEP / PepsiCo, Inc. | 0,01 | 0,54 | 1,38 | −6,39 | 0,5610 | −0,0638 | |||
| NOW / ServiceNow, Inc. | 0,00 | −0,77 | 1,32 | 2,73 | 0,5358 | −0,0080 | |||
| VTV / Vanguard Index Funds - Vanguard Value ETF | 0,01 | −0,39 | 1,31 | −2,31 | 0,5347 | −0,0356 | |||
| GOOGL / Alphabet Inc. | 0,01 | 0,00 | 1,28 | 21,21 | 0,5216 | 0,0730 | |||
| PM / Philip Morris International Inc. | 0,01 | 0,00 | 1,20 | 10,55 | 0,4869 | 0,0277 | |||
| DUK / Duke Energy Corporation | 0,01 | 0,00 | 1,19 | 2,77 | 0,4836 | −0,0070 | |||
| VTEB / Vanguard Municipal Bond Funds - Vanguard Tax-Exempt Bond ETF | 0,02 | 0,00 | 1,17 | −1,27 | 0,4751 | −0,0267 | |||
| ZTS / Zoetis Inc. | 0,01 | 0,00 | 1,11 | 2,03 | 0,4511 | −0,0098 | |||
| UNH / UnitedHealth Group Incorporated | 0,00 | 4,76 | 1,09 | 4,82 | 0,4433 | 0,0023 | |||
| MCD / McDonald's Corporation | 0,00 | 0,00 | 1,07 | −11,32 | 0,4373 | −0,0767 | |||
| CSX / CSX Corporation | 0,03 | −0,18 | 1,06 | −9,54 | 0,4328 | −0,0659 | |||
| XOM / Exxon Mobil Corporation | 0,01 | 3,37 | 1,06 | 2,22 | 0,4315 | −0,0084 | |||
| NSC / Norfolk Southern Corporation | 0,00 | 2,80 | 1,05 | −13,68 | 0,4295 | −0,0889 | |||
| JPM / JPMorgan Chase & Co. | 0,00 | 5,78 | 1,01 | 8,51 | 0,4103 | 0,0162 | |||
| UPS / United Parcel Service, Inc. | 0,01 | 0,00 | 1,01 | −8,55 | 0,4100 | −0,0571 | |||
| MDLZ / Mondelez International, Inc. | 0,01 | 1,03 | 0,96 | −5,88 | 0,3917 | −0,0418 | |||
| BRK.A / Berkshire Hathaway Inc. | 0,00 | 18,11 | 0,89 | 13,81 | 0,3628 | 0,0306 | |||
| MO / Altria Group, Inc. | 0,02 | 0,00 | 0,89 | 5,60 | 0,3615 | 0,0045 | |||
| D / Dominion Energy, Inc. | 0,02 | 0,00 | 0,81 | −2,42 | 0,3293 | −0,0223 | |||
| ELV / Elevance Health, Inc. | 0,00 | 0,00 | 0,78 | 3,05 | 0,3173 | −0,0035 | |||
| KEYS / Keysight Technologies, Inc. | 0,01 | −0,12 | 0,77 | −13,90 | 0,3156 | −0,0661 | |||
| MRK / Merck & Co., Inc. | 0,01 | 2,23 | 0,74 | −0,94 | 0,3010 | −0,0156 | |||
| ITW / Illinois Tool Works Inc. | 0,00 | −2,17 | 0,71 | −14,94 | 0,2878 | −0,0646 | |||
| LLY / Eli Lilly and Company | 0,00 | 15,90 | 0,67 | 36,20 | 0,2715 | 0,0638 | |||
| KO / The Coca-Cola Company | 0,01 | 0,00 | 0,63 | 3,45 | 0,2565 | −0,0019 | |||
| IVOO / Vanguard Admiral Funds - Vanguard S&P Mid-Cap 400 ETF | 0,01 | 0,07 | 0,59 | −4,84 | 0,2408 | −0,0226 | |||
| GIS / General Mills, Inc. | 0,01 | 0,00 | 0,59 | −9,54 | 0,2398 | −0,0364 | |||
| CAT / Caterpillar Inc. | 0,00 | −0,35 | 0,56 | −10,49 | 0,2294 | −0,0377 | |||
| MU / Micron Technology, Inc. | 0,00 | 10,51 | 0,55 | 23,44 | 0,2254 | 0,0349 | |||
| NKSH / National Bankshares, Inc. | 0,02 | 0,00 | 0,53 | −12,71 | 0,2155 | −0,0419 | |||
| VTI / Vanguard Index Funds - Vanguard Total Stock Market ETF | 0,00 | 0,00 | 0,51 | 3,26 | 0,2067 | −0,0022 | |||
| MKL / Markel Group Inc. | 0,00 | 0,00 | 0,50 | 3,70 | 0,2054 | −0,0013 | |||
| SYY / Sysco Corporation | 0,01 | 0,00 | 0,50 | −13,91 | 0,2019 | −0,0425 | |||
| CHH / Choice Hotels International, Inc. | 0,00 | 0,00 | 0,47 | −5,80 | 0,1919 | −0,0206 | |||
| FAST / Fastenal Company | 0,01 | 0,00 | 0,46 | −19,48 | 0,1887 | −0,0556 | |||
| EFA / iShares Trust - iShares MSCI EAFE ETF | 0,01 | 0,00 | 0,46 | −1,71 | 0,1879 | −0,0114 | |||
| BAM / Brookfield Asset Management Ltd. | 0,01 | 0,03 | 0,45 | −10,76 | 0,1829 | −0,0306 | |||
| EMR / Emerson Electric Co. | 0,00 | 0,00 | 0,44 | −4,77 | 0,1791 | −0,0168 | |||
| AMGN / Amgen Inc. | 0,00 | 0,00 | 0,43 | 9,23 | 0,1738 | 0,0082 | |||
| CVX / Chevron Corporation | 0,00 | 11,24 | 0,41 | 10,43 | 0,1685 | 0,0094 | |||
| BKNG / Booking Holdings Inc. | 0,00 | 10,64 | 0,40 | 18,48 | 0,1646 | 0,0198 | |||
| TFC / Truist Financial Corporation | 0,01 | 0,00 | 0,40 | 0,50 | 0,1629 | −0,0057 | |||
| LIN / Linde plc | 0,00 | 0,00 | 0,40 | −7,66 | 0,1623 | −0,0208 | |||
| DOV / Dover Corporation | 0,00 | 0,00 | 0,40 | 0,00 | 0,1609 | −0,0070 | |||
| UVV / Universal Corporation | 0,01 | 0,00 | 0,39 | −8,02 | 0,1592 | −0,0209 | |||
| NEE.PRN / NextEra Energy Capital Holdings, Inc. - Corporate Bond/Note | 0,01 | −1,54 | 0,39 | 7,76 | 0,1586 | 0,0051 | |||
| GE / General Electric Company | 0,00 | 0,00 | 0,34 | −9,57 | 0,1388 | −0,0209 | |||
| ADI / Analog Devices, Inc. | 0,00 | 0,00 | 0,34 | 13,71 | 0,1387 | 0,0117 | |||
| VIOO / Vanguard Admiral Funds - Vanguard S&P Small-Cap 600 ETF | 0,00 | 0,23 | 0,34 | −3,68 | 0,1385 | −0,0116 | |||
| NVO / Novo Nordisk A/S - Depositary Receipt (Common Stock) | 0,00 | 4,27 | 0,34 | 18,25 | 0,1374 | 0,0162 | |||
| KMX / CarMax, Inc. | 0,00 | −2,97 | 0,33 | −20,85 | 0,1364 | −0,0428 | |||
| WSO / Watsco, Inc. | 0,00 | 0,00 | 0,33 | 7,05 | 0,1362 | 0,0035 | |||
| NVR / NVR, Inc. | 0,00 | 0,33 | 0,1341 | 0,1341 | |||||
| AMZN / Amazon.com, Inc. | 0,00 | 37,49 | 0,33 | 50,46 | 0,1338 | 0,0410 | |||
| AEP / American Electric Power Company, Inc. | 0,00 | 0,00 | 0,33 | 1,24 | 0,1332 | −0,0037 | |||
| ORLY / O'Reilly Automotive, Inc. | 0,00 | 0,00 | 0,31 | −10,20 | 0,1259 | −0,0198 | |||
| ORCL / Oracle Corporation | 0,00 | 0,00 | 0,31 | 14,23 | 0,1243 | 0,0106 | |||
| SHW / The Sherwin-Williams Company | 0,00 | 22,31 | 0,28 | 4,12 | 0,1136 | −0,0001 | |||
| CHKP / Check Point Software Technologies Ltd. | 0,00 | 5,91 | 0,26 | 6,91 | 0,1071 | 0,0024 | |||
| TXN / Texas Instruments Incorporated | 0,00 | 0,25 | 0,1025 | 0,1025 | |||||
| WMT / Walmart Inc. | 0,00 | 5,75 | 0,25 | 18,57 | 0,1017 | 0,0123 | |||
| BDX / Becton, Dickinson and Company | 0,00 | 7,04 | 0,23 | −0,85 | 0,0952 | −0,0048 | |||
| KMB / Kimberly-Clark Corporation | 0,00 | 0,00 | 0,23 | 6,45 | 0,0944 | 0,0021 | |||
| VZ / Verizon Communications Inc. | 0,01 | 0,00 | 0,22 | −0,45 | 0,0910 | −0,0043 | |||
| V / Visa Inc. | 0,00 | 10,74 | 0,22 | 4,83 | 0,0885 | 0,0002 | |||
| TFI / SPDR Series Trust - SPDR Nuveen ICE Municipal Bond ETF | 0,00 | 0,00 | 0,21 | −1,85 | 0,0865 | −0,0054 | |||
| SBUX / Starbucks Corporation | 0,00 | 0,00 | 0,21 | −15,66 | 0,0857 | −0,0201 | |||
| SO / The Southern Company | 0,00 | 0,21 | 0,0845 | 0,0845 | |||||
| VEEV / Veeva Systems Inc. | 0,00 | 0,00 | 0,21 | −21,59 | 0,0844 | −0,0278 | |||
| HRB / H&R Block, Inc. | 0,00 | 0,21 | 0,0841 | 0,0841 | |||||
| HSY / The Hershey Company | 0,00 | 0,00 | 0,20 | −6,48 | 0,0826 | −0,0092 | |||
| NBB / Nuveen Taxable Municipal Income Fund | 0,01 | 0,00 | 0,17 | 0,58 | 0,0708 | −0,0026 | |||
| INTC / Intel Corporation | 0,00 | −100,00 | 0,00 | −100,00 | −1,6792 | ||||
| SWKS / Skyworks Solutions, Inc. | 0,00 | −100,00 | 0,00 | 0,0000 |