Grunnleggende statistikk
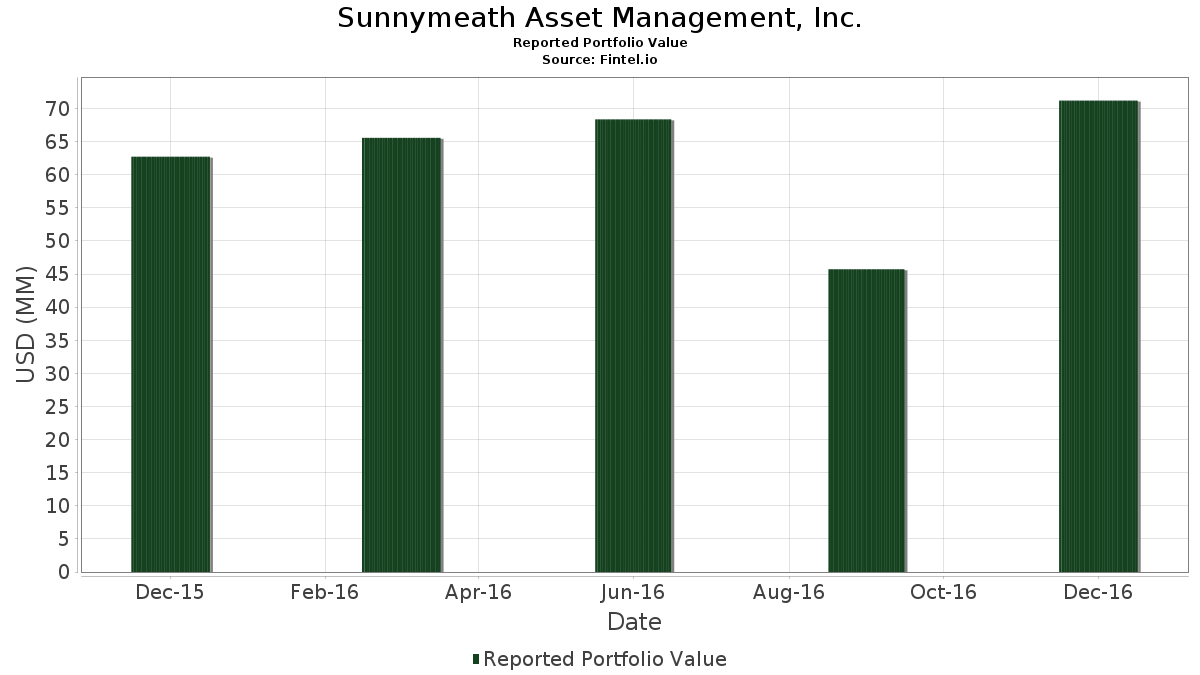
| Porteføljeverdi | $ 71 193 000 |
| Nåværende posisjoner | 144 |
Siste beholdninger, prestasjoner, forvaltet kapital (fra 13F, 13D)
Sunnymeath Asset Management, Inc. har oppgitt 144 totale beholdninger i sine siste SEC-arkiveringer. Siste porteføljeverdi er beregnet til 71 193 000 USD. Faktisk forvaltet kapital (AUM) er denne verdien pluss kontanter (som ikke er oppgitt). Sunnymeath Asset Management, Inc.s største beholdninger er Apple Inc. (US:AAPL) , Chevron Corporation (US:CVX) , AT&T Inc. (US:T) , The PNC Financial Services Group, Inc. (US:PNC) , and Solidion Technology, Inc. (US:STI) . Sunnymeath Asset Management, Inc.s nye posisjoner inkluderer CSRA Inc. (US:CSRA) , Hanesbrands Inc. (US:HBI) , Modine Manufacturing Company (US:MOD) , SPDR S&P 500 ETF (US:SPY) , and SAExploration Holdings, Inc. (US:SAEXW) .
De største økningene dette kvartalet
Vi bruker endringen i porteføljeallokeringen fordi dette er det mest meningsfulle målet. Endringer kan skyldes handler eller endringer i aksjekursene.
| Verdipapirer | Aksjer (MM) |
Verdi (MM$) |
Portefølje % | ΔPortefølje % |
|---|---|---|---|---|
| 0,02 | 1,71 | 2,4019 | 2,4019 | |
| 0,03 | 1,64 | 2,3036 | 2,3036 | |
| 0,04 | 1,60 | 2,2502 | 2,2502 | |
| 0,02 | 1,86 | 2,6168 | 2,2210 | |
| 0,02 | 1,45 | 2,0311 | 2,0311 | |
| 0,03 | 1,42 | 1,9974 | 1,9974 | |
| 0,10 | 1,25 | 1,7600 | 1,7600 | |
| 0,02 | 1,23 | 1,7333 | 1,7333 | |
| 0,04 | 1,23 | 1,7263 | 1,7263 | |
| 0,03 | 1,22 | 1,7122 | 1,7122 |
De største reduksjonene dette kvartalet
Vi bruker endringen i porteføljeallokeringen fordi dette er det mest meningsfulle målet. Endringer kan skyldes handler eller endringer i aksjekurser.
| Verdipapirer | Aksjer (MM) |
Verdi (MM$) |
Portefølje % | ΔPortefølje % |
|---|---|---|---|---|
| 0,00 | 0,05 | 0,0744 | −2,1235 | |
| 0,00 | 0,00 | −1,8284 | ||
| 0,01 | 0,94 | 1,3133 | −0,6353 | |
| 0,02 | 1,32 | 1,8541 | −0,6347 | |
| 0,00 | 0,00 | −0,5555 | ||
| 0,01 | 0,74 | 1,0436 | −0,4895 | |
| 0,02 | 0,87 | 1,2220 | −0,4314 | |
| 0,02 | 1,66 | 2,3261 | −0,3815 | |
| 0,00 | 1,56 | 2,1954 | −0,3568 | |
| 0,03 | 0,87 | 1,2262 | −0,3506 |
13F- og Fondsarkiveringer
Dette skjemaet ble sendt inn den 2017-01-13 for rapporteringsperioden 2016-12-31. Klikk på lenkeikonet for å se hele transaksjonshistorikken.
Oppgradere for å låse opp premiedata og eksportere til Excel![]() .
.
| Verdipapirer | Type | Gjennomsnittlig aksjekurs | Aksjer (MM) |
ΔAksjer (%) |
ΔAksjer (%) |
Verdi ($MM) |
Portefølje (%) |
ΔPortefølje (%) |
|
|---|---|---|---|---|---|---|---|---|---|
| AAPL / Apple Inc. | 0,02 | 14,01 | 2,08 | 57,08 | 2,9146 | 0,0255 | |||
| CVX / Chevron Corporation | 0,02 | 6,32 | 1,98 | 63,13 | 2,7840 | 0,1267 | |||
| T / AT&T Inc. | 0,04 | 53,41 | 1,87 | 141,60 | 2,6267 | 0,9339 | |||
| PNC / The PNC Financial Services Group, Inc. | 0,02 | 222,67 | 1,86 | 929,28 | 2,6168 | 2,2210 | |||
| STI / Solidion Technology, Inc. | 0,03 | −3,09 | 1,72 | 55,71 | 2,4146 | 0,0001 | |||
| STT / State Street Corporation | 0,02 | 2 100,00 | 1,71 | 2 092,31 | 2,4019 | 2,4019 | |||
| CELG / Celgene Corp. | 0,01 | 5,91 | 1,66 | 160,03 | 2,3303 | 0,9350 | |||
| XOM / Exxon Mobil Corporation | 0,02 | 2,61 | 1,66 | 33,76 | 2,3261 | −0,3815 | |||
| OSK / Oshkosh Corporation | 0,03 | 7,19 | 1,64 | 60,00 | 2,3036 | 2,3036 | |||
| TSRA / Tessera Technologies, Inc. | 0,04 | 7,74 | 1,60 | 54,19 | 2,2502 | 2,2502 | |||
| GOOGL / Alphabet Inc. | 0,00 | 13,23 | 1,56 | 33,93 | 2,1954 | −0,3568 | |||
| BK / The Bank of New York Mellon Corporation | 0,03 | 3,25 | 1,51 | 60,15 | 2,1168 | 0,0588 | |||
| JBSS / John B. Sanfilippo & Son, Inc. | 0,02 | 22,69 | 1,45 | 118,76 | 2,0311 | 2,0311 | |||
| DKS / DICK'S Sporting Goods, Inc. | 0,03 | 15,02 | 1,42 | 43,20 | 1,9974 | 1,9974 | |||
| TWX / Warner Media LLC | 0,01 | 16,06 | 1,40 | 103,65 | 1,9595 | 0,4613 | |||
| RDS.A / Shell Plc - ADR (Representing Ordinary Shares - Class A) | 0,03 | 113,46 | 1,39 | 159,74 | 1,9482 | 0,7803 | |||
| PFE / Pfizer Inc. | 0,04 | 8,08 | 1,35 | 40,94 | 1,9005 | −0,1991 | |||
| MSFT / Microsoft Corporation | 0,02 | 431,45 | 1,34 | 464,71 | 1,8878 | 1,3673 | |||
| US0325111070 / Anadarko Petroleum Corp. | 0,02 | 2,16 | 1,32 | 15,99 | 1,8541 | −0,6347 | |||
| GPK / Graphic Packaging Holding Company | 0,10 | 61,60 | 1,25 | 106,43 | 1,7600 | 1,7600 | |||
| PF / Pinnacle Foods, Inc. | 0,02 | 0,00 | 1,23 | 1,7333 | 1,7333 | ||||
| PLOW / Douglas Dynamics, Inc. | 0,04 | 34,19 | 1,23 | 149,80 | 1,7263 | 1,7263 | |||
| GNRC / Generac Holdings Inc. | 0,03 | 16,80 | 1,22 | 52,57 | 1,7122 | 1,7122 | |||
| CSRA / CSRA Inc. | 0,03 | 1,06 | 1,4847 | 1,4847 | |||||
| TACO / Berto Acquisition Corp. | 0,07 | 12,42 | 1,05 | 83,25 | 1,4749 | 1,4749 | |||
| RSG / Republic Services, Inc. | 0,02 | 15,05 | 1,05 | 65,93 | 1,4707 | 0,0906 | |||
| EVTC / EVERTEC, Inc. | 0,06 | 0,00 | 0,98 | 1,3793 | 1,3793 | ||||
| LFUS / Littelfuse, Inc. | 0,01 | 13,16 | 0,98 | 38,22 | 1,3765 | 1,3765 | |||
| AEM / Agnico Eagle Mines Limited | 0,02 | −13,38 | 0,98 | −13,13 | 1,3751 | 1,3751 | |||
| CASY / Casey's General Stores, Inc. | 0,01 | −1,81 | 0,97 | 24,07 | 1,3611 | 1,3611 | |||
| RDS.B / Shell Plc - ADR | 0,01 | 1 112,50 | 0,95 | 1 414,29 | 1,3400 | 1,3400 | |||
| TFX / Teleflex Incorporated | 0,01 | −8,66 | 0,94 | 4,94 | 1,3133 | −0,6353 | |||
| ELY / Topgolf Callaway Brands Corp | 0,08 | 1,20 | 0,93 | 14,34 | 1,2993 | 1,2993 | |||
| SEE / Sealed Air Corporation | 0,02 | 20,77 | 0,92 | 54,87 | 1,2965 | −0,0070 | |||
| BSX / Boston Scientific Corporation | 0,04 | 10,57 | 0,91 | 33,48 | 1,2712 | −0,2116 | |||
| COST / Costco Wholesale Corporation | 0,01 | 16,75 | 0,89 | 67,42 | 1,2557 | 0,0879 | |||
| HD / The Home Depot, Inc. | 0,01 | 244,29 | 0,89 | 98,22 | 1,2529 | 0,2688 | |||
| MAS / Masco Corporation | 0,03 | −6,76 | 0,87 | 21,08 | 1,2262 | −0,3506 | |||
| PYPL / PayPal Holdings, Inc. | 0,02 | −13,73 | 0,87 | 15,08 | 1,2220 | −0,4314 | |||
| LUV / Southwest Airlines Co. | 0,02 | 0,00 | 0,83 | 41,85 | 1,1616 | −0,1134 | |||
| TRMB / Trimble Inc. | 0,03 | −1,80 | 0,82 | 31,05 | 1,1560 | −0,2174 | |||
| DLX / Deluxe Corporation | 0,01 | −18,57 | 0,82 | 22,16 | 1,1462 | 1,1462 | |||
| AXP / American Express Company | 0,01 | 34,15 | 0,81 | 205,24 | 1,1448 | 0,5608 | |||
| BP / BP p.l.c. - Depositary Receipt (Common Stock) | 0,02 | 60,97 | 0,80 | 164,69 | 1,1265 | 0,4638 | |||
| DIS / The Walt Disney Company | 0,01 | −3,75 | 0,80 | 43,21 | 1,1265 | −0,0982 | |||
| TMO / Thermo Fisher Scientific Inc. | 0,01 | −2,00 | 0,76 | 25,95 | 1,0703 | −0,2528 | |||
| LOW / Lowe's Companies, Inc. | 0,01 | −11,81 | 0,74 | 5,99 | 1,0436 | −0,4895 | |||
| PEP / PepsiCo, Inc. | 0,01 | 83,22 | 0,74 | 169,34 | 1,0366 | 0,4374 | |||
| HCA / HCA Healthcare, Inc. | 0,04 | 333,79 | 0,69 | 22,57 | 0,9762 | −0,2638 | |||
| APA / APA Corporation | 0,01 | 17,44 | 0,64 | 67,62 | 0,9018 | 0,0641 | |||
| VZ / Verizon Communications Inc. | 0,01 | 36,00 | 0,63 | 65,17 | 0,8793 | 0,0504 | |||
| URI / United Rentals, Inc. | 0,01 | 0,00 | 0,59 | 34,32 | 0,8301 | −0,1322 | |||
| HBI / Hanesbrands Inc. | 0,03 | 0,56 | 0,7866 | 0,7866 | |||||
| BMY / Bristol-Myers Squibb Company | 0,01 | −10,58 | 0,54 | 24,26 | 0,7627 | −0,1930 | |||
| MOD / Modine Manufacturing Company | 0,04 | 0,54 | 0,7557 | 0,7557 | |||||
| AVNT / Avient Corporation | 0,02 | 2,56 | 0,51 | −0,77 | 0,7206 | 0,7206 | |||
| JPM / JPMorgan Chase & Co. | 0,01 | 113,21 | 0,49 | 149,74 | 0,6841 | 0,2576 | |||
| PWR / Quanta Services, Inc. | 0,01 | −3,29 | 0,46 | 24,26 | 0,6475 | −0,1639 | |||
| SIMA / SIM Acquisition Corp. I | 0,02 | −3,59 | 0,43 | 16,35 | 0,5998 | 0,5998 | |||
| HCCI / Heritage-Crystal Clean Inc | 0,00 | −91,62 | 0,42 | 11,83 | 0,5843 | 0,5843 | |||
| DOW / Dow Inc. | 0,01 | 33,73 | 0,41 | 84,62 | 0,5731 | 0,0898 | |||
| SPY / SPDR S&P 500 ETF | 0,00 | 0,39 | 0,5492 | 0,5492 | |||||
| CVA / Covanta Holding Corporation | 0,02 | 0,00 | 0,38 | 0,5366 | 0,5366 | ||||
| DFS.PRB / Discover Financial Services, 6.50% Preferred Stock B | 0,01 | 0,00 | 0,32 | 0,4509 | 0,4509 | ||||
| NEM / Newmont Corporation | 0,01 | 45,38 | 0,30 | 153,39 | 0,4200 | 0,1619 | |||
| ANDV / Andeavor Corp. | 0,00 | 0,00 | 0,30 | 24,27 | 0,4172 | −0,1055 | |||
| EXP / Eagle Materials Inc. | 0,00 | −42,53 | 0,25 | −13,99 | 0,3455 | 0,3455 | |||
| WAB / Westinghouse Air Brake Technologies Corporation | 0,00 | 107,14 | 0,24 | 127,36 | 0,3385 | 0,1067 | |||
| VIAB / Viacom, Inc. | 0,01 | 404,58 | 0,23 | 439,53 | 0,3259 | 0,2318 | |||
| BIG / Big Lots, Inc. | 0,00 | −32,06 | 0,22 | −8,94 | 0,3146 | 0,3146 | |||
| LAMR / Lamar Advertising Company | 0,00 | 0,00 | 0,20 | 0,2739 | 0,2739 | ||||
| ARMK / Aramark | 0,01 | −64,08 | 0,18 | −39,93 | 0,2556 | 0,2556 | |||
| GE / General Electric Company | 0,01 | −32,21 | 0,17 | −19,35 | 0,2458 | −0,2288 | |||
| TACOW / Berto Acquisition Corp. - Equity Warrant | 0,04 | 0,00 | 0,17 | 25,93 | 0,2388 | −0,0565 | |||
| HUM / Humana Inc. | 0,00 | 0,00 | 0,16 | 1,88 | 0,2290 | 0,2290 | |||
| BRK.B / Berkshire Hathaway Inc. | 0,00 | 0,00 | 0,15 | 13,24 | 0,2163 | −0,0811 | |||
| AIG / American International Group, Inc. | 0,00 | 0,00 | 0,15 | 1,38 | 0,2065 | −0,1106 | |||
| USB / U.S. Bancorp | 0,00 | 0,00 | 0,15 | 6,57 | 0,2051 | −0,0945 | |||
| WFC / Wells Fargo & Company | 0,00 | 0,00 | 0,13 | 6,61 | 0,1812 | −0,0834 | |||
| SAEXW / SAExploration Holdings, Inc. | 0,02 | 0,12 | 0,1742 | 0,1742 | |||||
| LLL / JX Luxventure Limited | 0,00 | 0,00 | 0,12 | 0,87 | 0,1629 | −0,0886 | |||
| RIO / Rio Tinto Group - Depositary Receipt (Common Stock) | 0,00 | 0,12 | 0,1615 | 0,1615 | |||||
| EEM / iShares, Inc. - iShares MSCI Emerging Markets ETF | 0,00 | 0,00 | 0,11 | 0,1517 | 0,1517 | ||||
| MRK / Merck & Co., Inc. | 0,00 | −62,37 | 0,11 | −28,19 | 0,1503 | −0,1756 | |||
| NVR / NVR, Inc. | 0,00 | 0,00 | 0,10 | 7,53 | 0,1405 | −0,0629 | |||
| MO / Altria Group, Inc. | 0,00 | 0,00 | 0,10 | 8,99 | 0,1362 | −0,0584 | |||
| CSX / CSX Corporation | 0,00 | 1,66 | 0,09 | 5,88 | 0,1264 | −0,0595 | |||
| ABC / Amerisource Bergen Corp. | 0,00 | −11,18 | 0,09 | −12,12 | 0,1222 | −0,0943 | |||
| TOL / Toll Brothers, Inc. | 0,00 | 10,64 | 0,08 | 36,67 | 0,1152 | 0,1152 | |||
| FCN / FTI Consulting, Inc. | 0,00 | −89,41 | 0,08 | −85,61 | 0,1082 | 0,1082 | |||
| ABM / ABM Industries Incorporated | 0,00 | 0,00 | 0,07 | 0,1039 | 0,1039 | ||||
| CNI / Canadian National Railway Company | 0,00 | 0,00 | 0,07 | 0,1039 | 0,1039 | ||||
| EMR / Emerson Electric Co. | 0,00 | 0,00 | 0,06 | 1,61 | 0,0885 | −0,0471 | |||
| GILD / Gilead Sciences, Inc. | 0,00 | 0,00 | 0,06 | −6,15 | 0,0857 | −0,0565 | |||
| CB / Chubb Limited | 0,00 | −96,08 | 0,05 | −94,73 | 0,0744 | −2,1235 | |||
| SU / Suncor Energy Inc. | 0,00 | 0,00 | 0,04 | 0,0632 | 0,0632 | ||||
| LLY / Eli Lilly and Company | 0,00 | −96,50 | 0,04 | −96,21 | 0,0618 | 0,0618 | |||
| MET / MetLife, Inc. | 0,00 | 0,00 | 0,04 | 0,0604 | 0,0604 | ||||
| GLW / Corning Incorporated | 0,00 | 0,00 | 0,04 | 2,38 | 0,0604 | −0,0315 | |||
| HCC / Warrior Met Coal, Inc. | 0,00 | 0,00 | 0,04 | 0,0590 | 0,0590 | ||||
| AEP / American Electric Power Company, Inc. | 0,00 | 1,33 | 0,04 | 5,00 | 0,0590 | −0,0285 | |||
| EXK / Endeavour Silver Corp. | 0,00 | 0,00 | 0,04 | 0,0590 | 0,0590 | ||||
| D / Dominion Energy, Inc. | 0,00 | 0,00 | 0,04 | 8,33 | 0,0548 | 0,0548 | |||
| KSS / Kohl's Corporation | 0,00 | 0,00 | 0,04 | 0,0534 | 0,0534 | ||||
| TFX / Teleflex Incorporated | Put | 0,00 | 0,00 | 0,04 | 8,82 | 0,0520 | −0,0224 | ||
| NRG / NRG Energy, Inc. | 0,00 | −88,46 | 0,04 | −74,66 | 0,0520 | 0,0520 | |||
| PSX / Phillips 66 | 0,00 | 0,00 | 0,04 | 2,94 | 0,0492 | −0,0252 | |||
| SF / Stifel Financial Corp. | 0,00 | 0,00 | 0,04 | 0,0492 | 0,0492 | ||||
| SLB / Schlumberger Limited | 0,00 | 0,00 | 0,03 | 6,25 | 0,0478 | −0,0222 | |||
| PEG / Public Service Enterprise Group Incorporated | 0,00 | 0,00 | 0,03 | 6,25 | 0,0478 | −0,0222 | |||
| LBRDA / Liberty Broadband Corporation | 0,00 | 0,00 | 0,03 | 10,00 | 0,0464 | −0,0193 | |||
| GSK / GSK plc - Depositary Receipt (Common Stock) | 0,00 | −96,65 | 0,03 | −95,83 | 0,0435 | 0,0435 | |||
| RXN / Rexnord Corp | 0,00 | −95,48 | 0,03 | −94,22 | 0,0407 | 0,0407 | |||
| HON / Honeywell International Inc. | 0,00 | 0,00 | 0,03 | 0,0393 | 0,0393 | ||||
| META / Meta Platforms, Inc. | 0,00 | 0,00 | 0,02 | 0,0323 | 0,0323 | ||||
| OXY / Occidental Petroleum Corporation | 0,00 | 0,00 | 0,02 | 4,55 | 0,0323 | −0,0158 | |||
| SHLD / Global X Funds - Global X Defense Tech ETF | Put | 0,00 | 0,02 | 0,0267 | 0,0267 | ||||
| MYJ / BlackRock MuniYield New Jersey Fund Inc | 0,00 | 0,00 | 0,02 | 0,0253 | 0,0253 | ||||
| PFF / iShares Trust - iShares Preferred and Income Securities ETF | 0,00 | 0,00 | 0,02 | 0,0239 | 0,0239 | ||||
| AFL / Aflac Incorporated | 0,00 | 0,00 | 0,01 | 0,0197 | 0,0197 | ||||
| GOOG / Alphabet Inc. | 0,00 | 0,01 | 0,0169 | 0,0169 | |||||
| OSK / Oshkosh Corporation | Put | 0,00 | 0,01 | 0,0169 | 0,0169 | ||||
| ALV / Autoliv, Inc. | 0,00 | 0,00 | 0,01 | 0,0155 | 0,0155 | ||||
| 61166W101 / Monsanto Co. | 0,00 | 0,00 | 0,01 | 0,0155 | 0,0155 | ||||
| VNQ / Vanguard Specialized Funds - Vanguard Real Estate ETF | 0,00 | 0,00 | 0,01 | 0,0126 | 0,0126 | ||||
| / BMC Stock Holdings, Inc. | Call | 0,00 | 0,01 | 0,0126 | 0,0126 | ||||
| EFA / iShares Trust - iShares MSCI EAFE ETF | 0,00 | 0,00 | 0,01 | 0,0112 | 0,0112 | ||||
| ALLY / Ally Financial Inc. | Call | 0,00 | 0,01 | 0,0112 | 0,0112 | ||||
| AN / AutoNation, Inc. | Call | 0,00 | 0,00 | 0,01 | 16,67 | 0,0098 | 0,0098 | ||
| XLB / The Select Sector SPDR Trust - The Materials Select Sector SPDR Fund | Put | 0,00 | 0,01 | 0,0070 | 0,0070 | ||||
| CASY / Casey's General Stores, Inc. | Put | 0,00 | 0,01 | 0,0070 | 0,0070 | ||||
| RIO / Rio Tinto Group - Depositary Receipt (Common Stock) | Call | 0,00 | 0,00 | 0,0056 | 0,0056 | ||||
| PEI / Pennsylvania Real Estate Investment Trust | Call | 0,00 | 0,00 | 0,00 | 300,00 | 0,0056 | 0,0034 | ||
| GM / General Motors Company | Call | 0,00 | 0,00 | 0,0056 | 0,0056 | ||||
| GNOG / Golden Nugget Online Gaming Inc - Class A | Call | 0,00 | 0,00 | 0,0042 | 0,0042 | ||||
| 887228104 / Time Inc. | 0,00 | 0,00 | 0,00 | 0,0042 | 0,0042 | ||||
| ARRS / ARRIS International plc | Call | 0,00 | 0,00 | 0,0042 | 0,0042 | ||||
| EXP / Eagle Materials Inc. | Put | 0,00 | 0,00 | 0,0028 | 0,0028 | ||||
| JPS / Nuveen Preferred & Income Securities Fund | 0,00 | 0,00 | 0,00 | 0,0028 | 0,0028 | ||||
| BWX / SPDR Series Trust - SPDR Bloomberg International Treasury Bond ETF | 0,00 | 0,00 | 0,00 | 0,0028 | 0,0028 | ||||
| PEI / Pennsylvania Real Estate Investment Trust | Call | 0,00 | 0,00 | 0,0014 | −0,0008 | ||||
| / Chase Packaging Corp. | 0,08 | 0,00 | 0,00 | 0,0014 | 0,0014 | ||||
| BLL / Ball Corp. | Call | 0,00 | 0,00 | 0,0014 | 0,0014 | ||||
| LOW / Lowe's Companies, Inc. | Put | 0,00 | 0,00 | 0,0014 | 0,0014 | ||||
| SLGN / Silgan Holdings Inc. | Call | 0,00 | −100,00 | 0,00 | −100,00 | 0,0000 | |||
| CAMP / Camp4 Therapeutics Corporation | Call | 0,00 | −100,00 | 0,00 | −100,00 | 0,0000 | |||
| HD / The Home Depot, Inc. | Put | 0,00 | 0,00 | 0,0000 | 0,0000 | ||||
| VAC / Marriott Vacations Worldwide Corporation | Call | 0,00 | −100,00 | 0,00 | −100,00 | 0,0000 | |||
| BIG / Big Lots, Inc. | Call | 0,00 | −100,00 | 0,00 | −100,00 | 0,0000 | |||
| FN / Fabrinet | 0,00 | −100,00 | 0,00 | −100,00 | 0,0000 | ||||
| / BMC Stock Holdings, Inc. | 0,00 | −100,00 | 0,00 | −100,00 | 0,0000 | ||||
| DIS / The Walt Disney Company | Put | 0,00 | −100,00 | 0,00 | −100,00 | −0,0109 | |||
| BELFB / Bel Fuse Inc. | 0,00 | −100,00 | 0,00 | −100,00 | 0,0000 | ||||
| BAC / Bank of America Corporation | 0,00 | −100,00 | 0,00 | −100,00 | −0,1006 | ||||
| CAT / Caterpillar Inc. | Call | 0,00 | −100,00 | 0,00 | −100,00 | −0,0765 | |||
| LEN / Lennar Corporation | 0,00 | −100,00 | 0,00 | −100,00 | −0,5555 | ||||
| HI / Hillenbrand, Inc. | Call | 0,00 | −100,00 | 0,00 | −100,00 | 0,0000 | |||
| ROST / Ross Stores, Inc. | 0,00 | −100,00 | 0,00 | −100,00 | −1,8284 | ||||
| DISCA / Discovery Inc - Class A | 0,00 | −100,00 | 0,00 | −100,00 | 0,0000 | ||||
| CELG / Celgene Corp. | Call | 0,00 | −100,00 | 0,00 | −100,00 | −0,0044 | |||
| DLX / Deluxe Corporation | Put | 0,00 | −100,00 | 0,00 | −100,00 | 0,0000 | |||
| GPS / The Gap, Inc. | Call | 0,00 | −100,00 | 0,00 | −100,00 | 0,0000 | |||
| Alphabet Inc Cap Stock Cl C / CL C (020796107) | 0,00 | −100,00 | 0,00 | −100,00 | 0,0000 | ||||
| WU / The Western Union Company | Put | 0,00 | −100,00 | 0,00 | −100,00 | −0,0131 |