Grunnleggende statistikk
| Porteføljeverdi | $ 77 501 000 |
| Nåværende posisjoner | 56 |
Siste beholdninger, prestasjoner, forvaltet kapital (fra 13F, 13D)
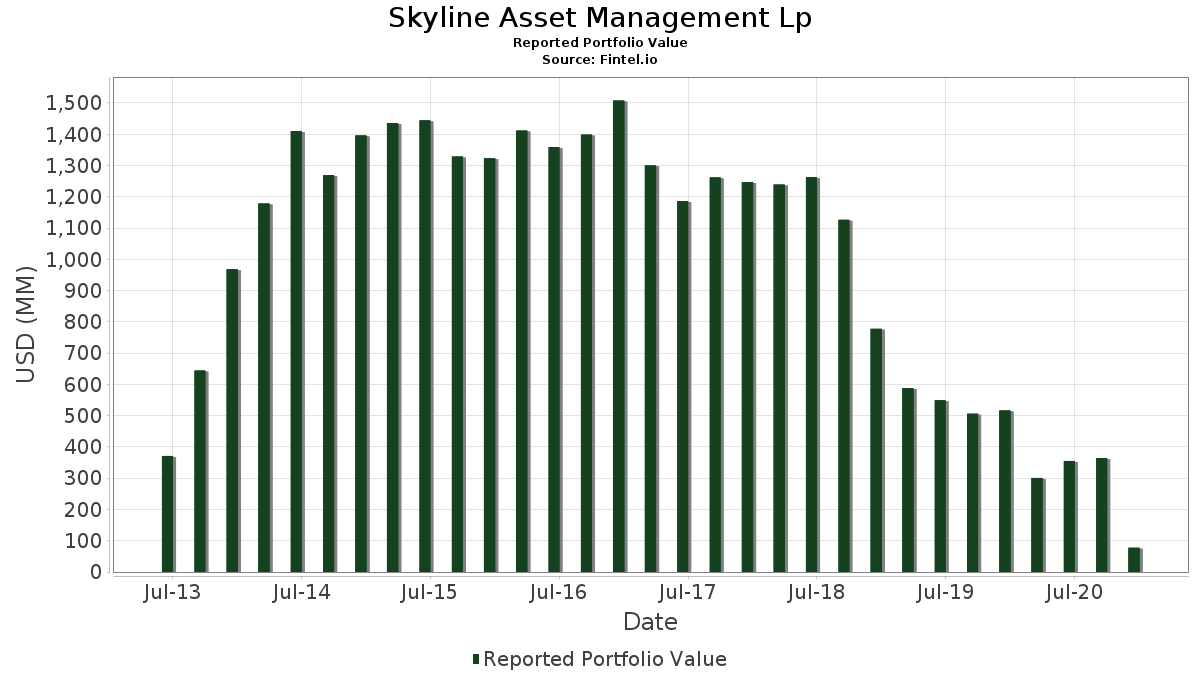
Skyline Asset Management Lp har oppgitt 56 totale beholdninger i sine siste SEC-arkiveringer. Siste porteføljeverdi er beregnet til 77 501 000 USD. Faktisk forvaltet kapital (AUM) er denne verdien pluss kontanter (som ikke er oppgitt). Skyline Asset Management Lps største beholdninger er Welbilt Inc (US:WBT) , The Children's Place, Inc. (US:PLCE) , Hillenbrand, Inc. (US:HI) , WSFS Financial Corporation (US:WSFS) , and BMC Stock Holdings, Inc. (US:) . Skyline Asset Management Lps nye posisjoner inkluderer Bed Bath & Beyond, Inc. (US:BBBY) , Bloomin' Brands, Inc. (US:BLMN) , Masonite International Corporation (US:DOOR) , PROG Holdings, Inc. (US:PRG) , and .
De største økningene dette kvartalet
Vi bruker endringen i porteføljeallokeringen fordi dette er det mest meningsfulle målet. Endringer kan skyldes handler eller endringer i aksjekursene.
| Verdipapirer | Aksjer (MM) |
Verdi (MM$) |
Portefølje % | ΔPortefølje % |
|---|---|---|---|---|
| 0,03 | 1,30 | 1,6748 | 1,6748 | |
| 0,07 | 1,30 | 1,6722 | 1,6722 | |
| 0,06 | 1,25 | 1,6064 | 1,6064 | |
| 0,02 | 0,97 | 1,2503 | 1,2503 | |
| 0,01 | 0,90 | 1,1548 | 1,1548 | |
| 0,04 | 1,93 | 2,4955 | 1,0364 | |
| 0,01 | 0,68 | 0,8826 | 0,8826 | |
| 0,16 | 2,07 | 2,6658 | 0,8566 | |
| 0,09 | 1,67 | 2,1548 | 0,5456 | |
| 0,04 | 1,89 | 2,4322 | 0,5237 |
De største reduksjonene dette kvartalet
Vi bruker endringen i porteføljeallokeringen fordi dette er det mest meningsfulle målet. Endringer kan skyldes handler eller endringer i aksjekurser.
| Verdipapirer | Aksjer (MM) |
Verdi (MM$) |
Portefølje % | ΔPortefølje % |
|---|---|---|---|---|
| 0,00 | 0,00 | −2,1376 | ||
| 0,00 | 0,00 | −1,2739 | ||
| 0,00 | 0,00 | −1,1531 | ||
| 0,00 | 0,00 | −0,7590 | ||
| 0,05 | 1,29 | 1,6658 | −0,6371 | |
| 0,02 | 1,25 | 1,6090 | −0,4852 | |
| 0,03 | 1,82 | 2,3548 | −0,4775 | |
| 0,05 | 1,24 | 1,6038 | −0,4511 | |
| 0,03 | 1,44 | 1,8632 | −0,3996 | |
| 0,03 | 1,38 | 1,7845 | −0,3451 |
13F- og Fondsarkiveringer
Dette skjemaet ble sendt inn den 2021-01-26 for rapporteringsperioden 2020-12-31. Klikk på lenkeikonet for å se hele transaksjonshistorikken.
Oppgradere for å låse opp premiedata og eksportere til Excel![]() .
.
| Verdipapirer | Type | Gjennomsnittlig aksjekurs | Aksjer (MM) |
ΔAksjer (%) |
ΔAksjer (%) |
Verdi ($MM) |
Portefølje (%) |
ΔPortefølje (%) |
|
|---|---|---|---|---|---|---|---|---|---|
| WBT / Welbilt Inc | 0,16 | −85,37 | 2,07 | −68,64 | 2,6658 | 0,8566 | |||
| PLCE / The Children's Place, Inc. | 0,04 | −79,40 | 1,93 | −63,60 | 2,4955 | 1,0364 | |||
| HI / Hillenbrand, Inc. | 0,05 | −83,48 | 1,89 | −76,81 | 2,4348 | 0,2006 | |||
| WSFS / WSFS Financial Corporation | 0,04 | −83,70 | 1,89 | −72,88 | 2,4322 | 0,5237 | |||
| / BMC Stock Holdings, Inc. | 0,03 | −85,88 | 1,82 | −82,31 | 2,3548 | −0,4775 | |||
| OEC / Orion S.A. | 0,10 | −83,49 | 1,78 | −77,38 | 2,2916 | 0,1356 | |||
| DIN / Dine Brands Global, Inc. | 0,03 | −81,30 | 1,77 | −80,13 | 2,2903 | −0,1622 | |||
| ACHC / Acadia Healthcare Company, Inc. | 0,03 | −85,49 | 1,68 | −75,26 | 2,1664 | 0,3029 | |||
| STL / Sterling Bancorp. | 0,09 | −83,32 | 1,67 | −71,50 | 2,1548 | 0,5456 | |||
| ESNT / Essent Group Ltd. | 0,04 | −84,24 | 1,61 | −81,61 | 2,0787 | −0,3274 | |||
| US7846351044 / SPX Corp | 0,03 | −83,81 | 1,59 | −80,96 | 2,0555 | −0,2422 | |||
| BUSE / First Busey Corporation | 0,07 | −83,26 | 1,57 | −77,30 | 2,0245 | 0,1267 | |||
| TRS / TriMas Corporation | 0,05 | −83,66 | 1,57 | −77,30 | 2,0232 | 0,1267 | |||
| FOCS / Focus Financial Partners Inc - Class A | 0,04 | −83,42 | 1,55 | −78,00 | 1,9987 | 0,0654 | |||
| BXS / BancorpSouth Bank | 0,06 | −83,23 | 1,54 | −76,26 | 1,9897 | 0,2058 | |||
| UMPQ / Umpqua Holdings Corp | 0,10 | −83,35 | 1,53 | −76,26 | 1,9780 | 0,2046 | |||
| UMBF / UMB Financial Corporation | 0,02 | −83,42 | 1,48 | −76,67 | 1,9135 | 0,1678 | |||
| MAN / ManpowerGroup Inc. | 0,02 | −81,88 | 1,48 | −77,71 | 1,9084 | 0,0861 | |||
| SANM / Sanmina Corporation | 0,05 | −84,16 | 1,48 | −81,31 | 1,9058 | −0,2647 | |||
| KN / Knowles Corporation | 0,08 | −84,24 | 1,47 | −80,51 | 1,8929 | −0,1738 | |||
| LCII / LCI Industries | 0,01 | −83,50 | 1,45 | −79,87 | 1,8735 | −0,1075 | |||
| MTX / Minerals Technologies Inc. | 0,02 | −84,05 | 1,45 | −80,62 | 1,8671 | −0,1832 | |||
| PRFT / Perficient, Inc. | 0,03 | −84,28 | 1,44 | −82,48 | 1,8632 | −0,3996 | |||
| KLIC / Kulicke and Soffa Industries, Inc. | 0,04 | −83,49 | 1,43 | −76,56 | 1,8426 | 0,1699 | |||
| KFY / Korn Ferry | 0,03 | −81,57 | 1,42 | −72,36 | 1,8348 | 0,4219 | |||
| RGA / Reinsurance Group of America, Incorporated | 0,01 | −84,03 | 1,40 | −80,55 | 1,8090 | −0,1709 | |||
| NBHC / National Bank Holdings Corporation | 0,04 | −83,27 | 1,40 | −79,13 | 1,8051 | −0,0353 | |||
| BC / Brunswick Corporation | 0,02 | −83,96 | 1,40 | −79,25 | 1,8000 | −0,0460 | |||
| TTMI / TTM Technologies, Inc. | 0,10 | −84,18 | 1,38 | −80,87 | 1,7858 | −0,2005 | |||
| BECN / Beacon Roofing Supply, Inc. | 0,03 | −86,22 | 1,38 | −82,17 | 1,7845 | −0,3451 | |||
| FOE / Ferro Corp. | 0,09 | −84,24 | 1,38 | −81,41 | 1,7780 | −0,2579 | |||
| ROCK / Gibraltar Industries, Inc. | 0,02 | −83,39 | 1,37 | −81,66 | 1,7729 | −0,2842 | |||
| RXN / Rexnord Corp | 0,03 | −83,90 | 1,35 | −78,69 | 1,7380 | 0,0022 | |||
| AMWD / American Woodmark Corporation | 0,01 | −84,32 | 1,34 | −81,26 | 1,7316 | −0,2354 | |||
| KMPR / Kemper Corporation | 0,02 | −84,20 | 1,31 | −81,83 | 1,6903 | −0,2899 | |||
| WGO / Winnebago Industries, Inc. | 0,02 | −81,05 | 1,30 | −78,01 | 1,6787 | 0,0541 | |||
| JRVR / James River Group Holdings, Ltd. | 0,03 | −31,07 | 1,30 | −23,87 | 1,6748 | 1,6748 | |||
| BBBY / Bed Bath & Beyond, Inc. | 0,07 | 1,30 | 1,6722 | 1,6722 | |||||
| SHYF / The Shyft Group, Inc. | 0,05 | −89,76 | 1,29 | −84,61 | 1,6658 | −0,6371 | |||
| NCR / NCR Corp. | 0,03 | −83,81 | 1,27 | −72,52 | 1,6438 | 0,3708 | |||
| CMP / Compass Minerals International, Inc. | 0,02 | −84,28 | 1,25 | −83,65 | 1,6090 | −0,4852 | |||
| BLMN / Bloomin' Brands, Inc. | 0,06 | 1,25 | 1,6064 | 1,6064 | |||||
| JELD / JELD-WEN Holding, Inc. | 0,05 | −85,20 | 1,24 | −83,39 | 1,6038 | −0,4511 | |||
| BHE / Benchmark Electronics, Inc. | 0,04 | −84,18 | 1,21 | −78,80 | 1,5626 | −0,0063 | |||
| FMBI / First Midwest Bancorp, Inc. | 0,08 | −84,15 | 1,21 | −76,58 | 1,5600 | 0,1422 | |||
| SIMO / Silicon Motion Technology Corporation - Depositary Receipt (Common Stock) | 0,02 | −83,89 | 1,17 | −79,46 | 1,5097 | −0,0548 | |||
| TPIC / TPI Composites, Inc. | 0,02 | −90,38 | 1,12 | −82,47 | 1,4503 | −0,3105 | |||
| CMCO / Columbus McKinnon Corporation | 0,03 | −84,43 | 1,12 | −81,93 | 1,4477 | −0,2571 | |||
| R / Ryder System, Inc. | 0,02 | −84,11 | 1,10 | −76,77 | 1,4180 | 0,1189 | |||
| WNS / WNS (Holdings) Limited | 0,02 | −84,03 | 1,09 | −82,02 | 1,4129 | −0,2592 | |||
| NPO / Enpro Inc. | 0,01 | −84,39 | 1,08 | −79,10 | 1,3935 | −0,0254 | |||
| THS / TreeHouse Foods, Inc. | 0,02 | −79,27 | 0,97 | −78,26 | 1,2503 | 1,2503 | |||
| DOOR / Masonite International Corporation | 0,01 | 0,90 | 1,1548 | 1,1548 | |||||
| AMN / AMN Healthcare Services, Inc. | 0,01 | −83,84 | 0,87 | −81,14 | 1,1187 | −0,1434 | |||
| PRG / PROG Holdings, Inc. | 0,01 | 0,68 | 0,8826 | 0,8826 | |||||
| PBH / Prestige Consumer Healthcare Inc. | 0,01 | −84,05 | 0,51 | −84,72 | 0,6529 | −0,2563 | |||
| AAN / The Aaron's Company, Inc. | 0,00 | −100,00 | 0,00 | −100,00 | −2,1376 | ||||
| VREX / Varex Imaging Corporation | 0,00 | −100,00 | 0,00 | −100,00 | −0,7590 | ||||
| NP / Neenah Inc | 0,00 | −100,00 | 0,00 | −100,00 | −1,2739 | ||||
| US4989042001 / Knoll Inc | 0,00 | −100,00 | 0,00 | −100,00 | −1,1531 |