Grunnleggende statistikk
| Innsiderprofil | REAVES W H & CO INC |
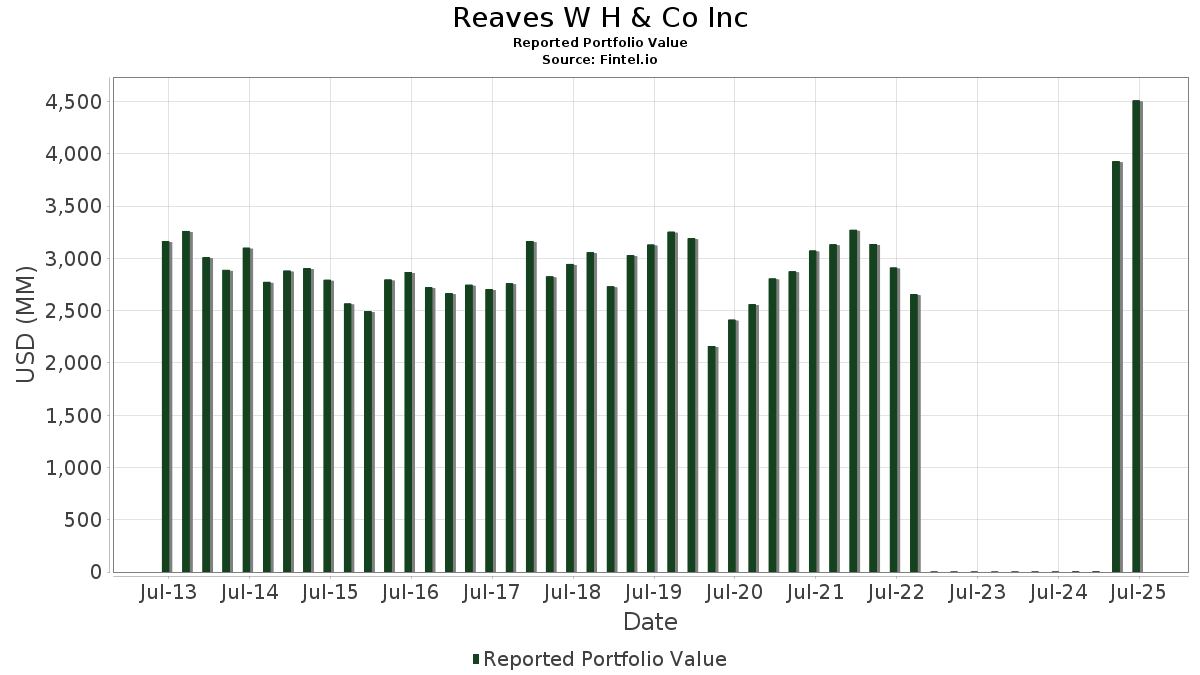
| Porteføljeverdi | $ 4 510 788 821 |
| Nåværende posisjoner | 77 |
Siste beholdninger, prestasjoner, forvaltet kapital (fra 13F, 13D)
Reaves W H & Co Inc har oppgitt 77 totale beholdninger i sine siste SEC-arkiveringer. Siste porteføljeverdi er beregnet til 4 510 788 821 USD. Faktisk forvaltet kapital (AUM) er denne verdien pluss kontanter (som ikke er oppgitt). Reaves W H & Co Incs største beholdninger er Talen Energy Corporation (US:TLN) , Vistra Corp. (US:VST) , Constellation Energy Corporation (US:CEG) , CenterPoint Energy, Inc. (US:CNP) , and IDACORP, Inc. (US:IDA) . Reaves W H & Co Incs nye posisjoner inkluderer MP Materials Corp. (US:MP) , .
De største økningene dette kvartalet
Vi bruker endringen i porteføljeallokeringen fordi dette er det mest meningsfulle målet. Endringer kan skyldes handler eller endringer i aksjekursene.
| Verdipapirer | Aksjer (MM) |
Verdi (MM$) |
Portefølje % | ΔPortefølje % |
|---|---|---|---|---|
| 1,57 | 303,94 | 6,7382 | 2,3020 | |
| 1,87 | 129,73 | 1,9081 | 1,2174 | |
| 6,26 | 229,90 | 5,0966 | 1,0531 | |
| 0,45 | 43,58 | 0,9662 | 0,9662 | |
| 0,96 | 32,11 | 0,7118 | 0,7118 | |
| 0,20 | 80,54 | 1,7856 | 0,4806 | |
| 1,15 | 69,70 | 1,5452 | 0,4775 | |
| 0,27 | 102,78 | 2,2785 | 0,4571 | |
| 0,67 | 34,54 | 0,5080 | 0,3582 | |
| 0,33 | 19,16 | 0,4247 | 0,2716 |
De største reduksjonene dette kvartalet
Vi bruker endringen i porteføljeallokeringen fordi dette er det mest meningsfulle målet. Endringer kan skyldes handler eller endringer i aksjekurser.
| Verdipapirer | Aksjer (MM) |
Verdi (MM$) |
Portefølje % | ΔPortefølje % |
|---|---|---|---|---|
| 3,82 | 129,49 | 1,9045 | −1,8998 | |
| 0,31 | 48,24 | 0,7095 | −1,8794 | |
| 1,49 | 133,12 | 1,9580 | −1,7009 | |
| 3,59 | 111,45 | 1,6392 | −1,4832 | |
| 1,98 | 164,39 | 3,6444 | −1,4178 | |
| 0,01 | 0,34 | 0,0075 | −1,1557 | |
| 1,57 | 180,89 | 2,6606 | −1,0302 | |
| 0,02 | 1,93 | 0,0284 | −1,0215 | |
| 0,15 | 36,76 | 0,5407 | −0,9114 | |
| 3,72 | 150,14 | 3,3285 | −0,9089 |
13F- og Fondsarkiveringer
Dette skjemaet ble sendt inn den 2025-08-11 for rapporteringsperioden 2025-06-30. Klikk på lenkeikonet for å se hele transaksjonshistorikken.
Oppgradere for å låse opp premiedata og eksportere til Excel![]() .
.
| Verdipapirer | Type | Gjennomsnittlig aksjekurs | Aksjer (MM) |
ΔAksjer (%) |
ΔAksjer (%) |
Verdi ($MM) |
Portefølje (%) |
ΔPortefølje (%) |
|
|---|---|---|---|---|---|---|---|---|---|
| TLN / Talen Energy Corporation | 1,25 | 3,25 | 364,19 | 50,37 | 5,3566 | −0,8070 | |||
| VST / Vistra Corp. | 1,57 | 5,65 | 303,94 | 74,36 | 6,7382 | 2,3020 | |||
| CEG / Constellation Energy Corporation | 0,82 | 13,71 | 265,74 | 82,02 | 3,9085 | 0,1933 | |||
| CNP / CenterPoint Energy, Inc. | 6,26 | 42,68 | 229,90 | 44,69 | 5,0966 | 1,0531 | |||
| IDA / IDACORP, Inc. | 1,57 | 25,56 | 180,89 | 24,72 | 2,6606 | −1,0302 | |||
| XEL / Xcel Energy Inc. | 2,52 | 9,38 | 171,36 | 5,22 | 3,7989 | −0,3454 | |||
| ETR / Entergy Corporation | 1,98 | −15,00 | 164,39 | −17,36 | 3,6444 | −1,4178 | |||
| NI / NiSource Inc. | 3,72 | −10,39 | 150,14 | −9,83 | 3,3285 | −0,9089 | |||
| TXNM / TXNM Energy, Inc. | 2,57 | −14,93 | 144,84 | −10,42 | 3,2109 | −0,9035 | |||
| PEG / Public Service Enterprise Group Incorporated | 1,58 | 20,69 | 133,32 | 23,44 | 1,9609 | −0,7875 | |||
| PNW / Pinnacle West Capital Corporation | 1,49 | −1,43 | 133,12 | −7,41 | 1,9580 | −1,7009 | |||
| CMS / CMS Energy Corporation | 1,87 | 418,17 | 129,73 | 377,95 | 1,9081 | 1,2174 | |||
| PPL / PPL Corporation | 3,82 | −7,71 | 129,49 | −13,38 | 1,9045 | −1,8998 | |||
| EQIX / Equinix, Inc. | 0,16 | 0,71 | 126,29 | −1,75 | 2,7998 | −0,4714 | |||
| SRE / Sempra | 1,54 | −18,57 | 116,89 | −13,54 | 2,5914 | −0,8492 | |||
| CCJ / Cameco Corporation | 1,56 | −2,89 | 115,54 | 75,14 | 1,6993 | 0,0206 | |||
| EPD / Enterprise Products Partners L.P. - Limited Partnership | 3,59 | 0,00 | 111,45 | −9,17 | 1,6392 | −1,4832 | |||
| PWR / Quanta Services, Inc. | 0,27 | −3,46 | 102,78 | 43,60 | 2,2785 | 0,4571 | |||
| SBAC / SBA Communications Corporation | 0,43 | 6,26 | 101,60 | 13,43 | 2,2524 | −0,0271 | |||
| CHTR / Charter Communications, Inc. | 0,20 | 41,59 | 80,54 | 57,06 | 1,7856 | 0,4806 | |||
| DTM / DT Midstream, Inc. | 0,70 | −7,56 | 76,77 | 5,31 | 1,1291 | −0,7259 | |||
| DTE / DTE Energy Company | 0,56 | −6,52 | 74,28 | −10,45 | 1,6466 | −0,4640 | |||
| LNT / Alliant Energy Corporation | 1,15 | 76,78 | 69,70 | 66,12 | 1,5452 | 0,4775 | |||
| UNP / Union Pacific Corporation | 0,30 | −0,56 | 69,17 | −3,16 | 1,5334 | −0,2842 | |||
| CMCSA / Comcast Corporation | 1,86 | −6,73 | 66,33 | −9,79 | 0,9757 | −0,8956 | |||
| NEE / NextEra Energy, Inc. | 0,89 | −11,40 | 62,06 | −13,23 | 1,3759 | −0,4444 | |||
| NSC / Norfolk Southern Corporation | 0,22 | 0,00 | 56,13 | 8,07 | 0,8256 | −0,4962 | |||
| OGE / OGE Energy Corp. | 1,24 | 1,86 | 55,13 | −1,64 | 1,2222 | −0,2042 | |||
| ATO / Atmos Energy Corporation | 0,31 | −52,44 | 48,24 | −52,58 | 0,7095 | −1,8794 | |||
| OKE / ONEOK, Inc. | 0,58 | 68,78 | 47,70 | 38,86 | 1,0576 | 0,1833 | |||
| WMB / The Williams Companies, Inc. | 0,75 | 11,09 | 46,97 | 16,76 | 1,0412 | 0,0176 | |||
| VRT / Vertiv Holdings Co | 0,35 | 11,12 | 44,92 | 97,63 | 0,6607 | 0,0823 | |||
| AEE / Ameren Corporation | 0,45 | 43,58 | 0,9662 | 0,9662 | |||||
| AMT / American Tower Corporation | 0,19 | 0,00 | 42,67 | 1,57 | 0,9458 | −0,1231 | |||
| CCOI / Cogent Communications Holdings, Inc. | 0,82 | 1,47 | 39,53 | −20,21 | 0,5814 | −0,6793 | |||
| LEU / Centrus Energy Corp. | 0,21 | −8,64 | 38,27 | 169,01 | 0,5629 | 0,2009 | |||
| TMUS / T-Mobile US, Inc. | 0,15 | −27,88 | 36,76 | −35,58 | 0,5407 | −0,9114 | |||
| MPLX / MPLX LP - Limited Partnership | 0,67 | 509,55 | 34,54 | 486,67 | 0,5080 | 0,3582 | |||
| MP / MP Materials Corp. | 0,96 | 32,11 | 0,7118 | 0,7118 | |||||
| PCG / PG&E Corporation | 2,18 | −32,70 | 30,38 | −45,39 | 0,6735 | −0,7423 | |||
| DY / Dycom Industries, Inc. | 0,12 | −13,78 | 29,73 | 38,32 | 0,6592 | 0,1121 | |||
| FYBR / Frontier Communications Parent, Inc. | 0,71 | −0,18 | 25,76 | 1,32 | 0,3788 | −0,2681 | |||
| MPC / Marathon Petroleum Corporation | 0,15 | 0,00 | 24,92 | 14,02 | 0,5524 | −0,0038 | |||
| AWK / American Water Works Company, Inc. | 0,16 | −38,22 | 21,72 | −41,75 | 0,4815 | −0,4674 | |||
| NRG / NRG Energy, Inc. | 0,13 | 97,22 | 21,29 | 231,75 | 0,3132 | 0,1498 | |||
| EQT / EQT Corporation | 0,33 | 191,70 | 19,16 | 218,40 | 0,4247 | 0,2716 | |||
| DLR / Digital Realty Trust, Inc. | 0,07 | 84,13 | 13,03 | 124,02 | 0,2889 | 0,1408 | |||
| ODFL / Old Dominion Freight Line, Inc. | 0,07 | 82,01 | 12,04 | 78,55 | 0,1771 | 0,0055 | |||
| GEV / GE Vernova Inc. | 0,02 | 0,00 | 10,58 | 73,35 | 0,1557 | 0,0003 | |||
| LIN / Linde plc | 0,02 | 0,96 | 9,99 | 1,72 | 0,1469 | −0,1029 | |||
| BRK.A / Berkshire Hathaway Inc. | 0,02 | 0,00 | 8,90 | −8,79 | 0,1310 | −0,1175 | |||
| JCI / Johnson Controls International plc | 0,05 | 1,10 | 5,34 | 33,29 | 0,0785 | −0,0234 | |||
| T / AT&T Inc. | 0,18 | −38,44 | 5,23 | −37,00 | 0,1160 | −0,0954 | |||
| CPK / Chesapeake Utilities Corporation | 0,03 | 0,00 | 3,61 | −6,39 | 0,0800 | −0,0181 | |||
| UTG / Reaves Utility Income Fund | 0,09 | 1,64 | 3,21 | 13,01 | 0,0472 | −0,0250 | |||
| CNI / Canadian National Railway Company | 0,03 | −1,73 | 3,04 | 4,90 | 0,0447 | −0,0290 | |||
| LAMR / Lamar Advertising Company | 0,03 | 0,00 | 3,03 | 6,68 | 0,0673 | −0,0051 | |||
| SO / The Southern Company | 0,03 | −12,65 | 2,76 | −12,75 | 0,0612 | −0,0193 | |||
| XOM / Exxon Mobil Corporation | 0,02 | −94,84 | 1,93 | −95,32 | 0,0284 | −1,0215 | |||
| CVX / Chevron Corporation | 0,01 | −0,49 | 1,59 | −14,83 | 0,0353 | −0,0123 | |||
| SCE.PRJ / SCE Trust IV - Preferred Stock | 0,06 | 0,00 | 1,44 | 1,55 | 0,0212 | −0,0149 | |||
| DTEGY / Deutsche Telekom AG - Depositary Receipt (Common Stock) | 0,04 | −1,68 | 1,38 | −3,30 | 0,0202 | −0,0160 | |||
| AAPL / Apple Inc. | 0,00 | 0,00 | 0,98 | −7,69 | 0,0218 | −0,0053 | |||
| DUK / Duke Energy Corporation | 0,01 | −1,69 | 0,96 | −4,84 | 0,0214 | −0,0044 | |||
| PM / Philip Morris International Inc. | 0,01 | 0,00 | 0,91 | 14,75 | 0,0202 | −0,0000 | |||
| MDU / MDU Resources Group, Inc. | 0,05 | 0,00 | 0,83 | −1,42 | 0,0123 | −0,0093 | |||
| ECG / Everus Construction Group, Inc. | 0,01 | 0,00 | 0,79 | 71,49 | 0,0117 | −0,0001 | |||
| PLD / Prologis, Inc. | 0,01 | 0,00 | 0,77 | −5,96 | 0,0171 | −0,0038 | |||
| CP / Canadian Pacific Kansas City Limited | 0,01 | 0,00 | 0,74 | 12,80 | 0,0109 | −0,0058 | |||
| EXC / Exelon Corporation | 0,02 | −5,61 | 0,73 | −11,07 | 0,0162 | −0,0047 | |||
| NJR / New Jersey Resources Corporation | 0,02 | −68,10 | 0,67 | −70,87 | 0,0099 | −0,0489 | |||
| PPG / PPG Industries, Inc. | 0,01 | 0,00 | 0,57 | 4,03 | 0,0126 | −0,0013 | |||
| JNJ / Johnson & Johnson | 0,00 | 0,00 | 0,50 | −7,73 | 0,0111 | −0,0027 | |||
| MO / Altria Group, Inc. | 0,01 | 0,00 | 0,47 | −2,29 | 0,0104 | −0,0018 | |||
| EIX / Edison International | 0,01 | −99,15 | 0,34 | −99,26 | 0,0075 | −1,1557 | |||
| NWN / Northwest Natural Holding Company | 0,01 | −77,22 | 0,23 | −78,88 | 0,0035 | −0,0248 | |||
| VZ / Verizon Communications Inc. | 0,00 | −98,36 | 0,20 | −98,44 | 0,0045 | −0,3241 | |||
| USM / United States Cellular Corporation | 0,00 | −100,00 | 0,00 | 0,0000 | |||||
| AEP / American Electric Power Company, Inc. | 0,00 | −100,00 | 0,00 | 0,0000 | |||||
| GOOGL / Alphabet Inc. | 0,00 | −100,00 | 0,00 | 0,0000 | |||||
| GOOG / Alphabet Inc. | 0,00 | −100,00 | 0,00 | 0,0000 |