Grunnleggende statistikk
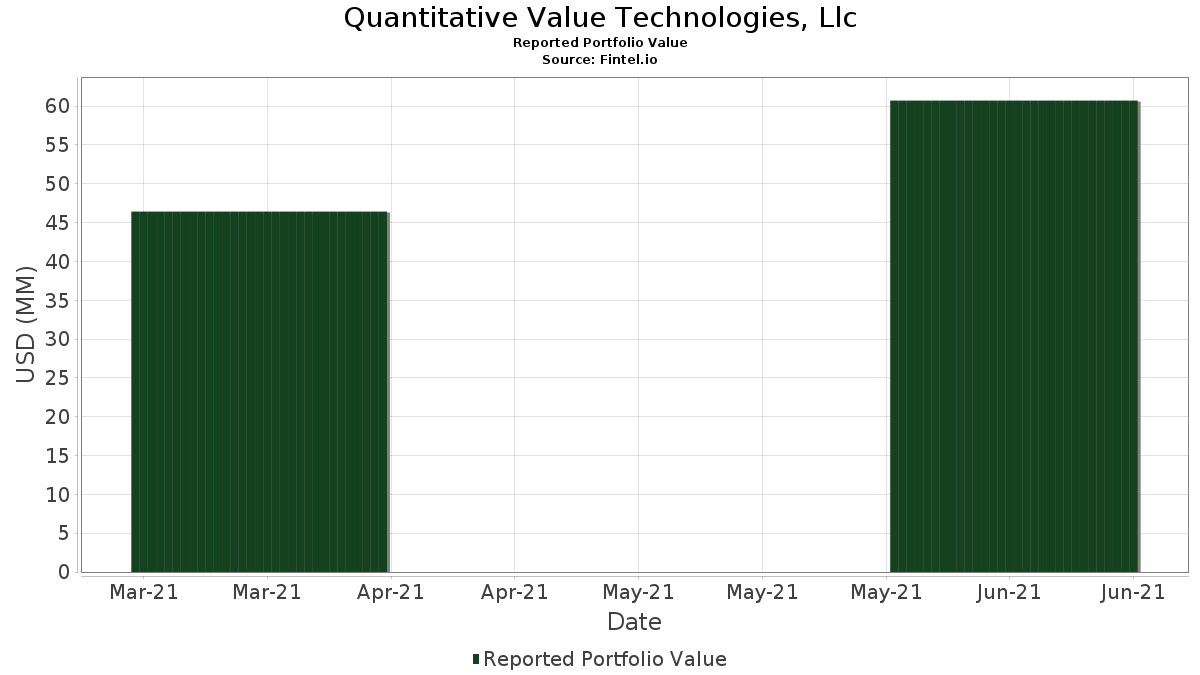
| Porteføljeverdi | $ 60 718 000 |
| Nåværende posisjoner | 97 |
Siste beholdninger, prestasjoner, forvaltet kapital (fra 13F, 13D)
Quantitative Value Technologies, Llc har oppgitt 97 totale beholdninger i sine siste SEC-arkiveringer. Siste porteføljeverdi er beregnet til 60 718 000 USD. Faktisk forvaltet kapital (AUM) er denne verdien pluss kontanter (som ikke er oppgitt). Quantitative Value Technologies, Llcs største beholdninger er Apple Inc. (US:AAPL) , The Coca-Cola Company (US:KO) , Alphabet Inc. (US:GOOGL) , Berkshire Hathaway Inc. (US:BRK.B) , and Microsoft Corporation (US:MSFT) . Quantitative Value Technologies, Llcs nye posisjoner inkluderer The Coca-Cola Company (US:KO) , SPDR S&P 500 ETF (US:SPY) , Union Pacific Corporation (US:UNP) , International Business Machines Corporation (US:IBM) , and Commerce Bancshares, Inc. (US:CBSH) .
De største økningene dette kvartalet
Vi bruker endringen i porteføljeallokeringen fordi dette er det mest meningsfulle målet. Endringer kan skyldes handler eller endringer i aksjekursene.
| Verdipapirer | Aksjer (MM) |
Verdi (MM$) |
Portefølje % | ΔPortefølje % |
|---|---|---|---|---|
| 0,05 | 2,68 | 4,4073 | 4,4073 | |
| 0,01 | 1,95 | 3,2116 | 2,5050 | |
| 0,00 | 1,27 | 2,0867 | 2,0867 | |
| 0,00 | 1,01 | 1,6618 | 1,6618 | |
| 0,01 | 0,83 | 1,3637 | 1,3637 | |
| 0,01 | 0,45 | 0,7444 | 0,7444 | |
| 0,03 | 3,63 | 5,9801 | 0,7197 | |
| 0,01 | 0,91 | 1,4954 | 0,6833 | |
| 0,00 | 0,38 | 0,6226 | 0,6226 | |
| 0,00 | 0,84 | 1,3818 | 0,5977 |
De største reduksjonene dette kvartalet
Vi bruker endringen i porteføljeallokeringen fordi dette er det mest meningsfulle målet. Endringer kan skyldes handler eller endringer i aksjekurser.
| Verdipapirer | Aksjer (MM) |
Verdi (MM$) |
Portefølje % | ΔPortefølje % |
|---|---|---|---|---|
| 0,00 | 0,00 | −0,8057 | ||
| 0,00 | 0,00 | −0,8057 | ||
| 0,00 | 0,00 | −0,8035 | ||
| 0,00 | 0,00 | −0,7238 | ||
| 0,00 | 0,00 | −0,7216 | ||
| 0,01 | 1,97 | 3,2494 | −0,7013 | |
| 0,00 | 0,00 | −0,6936 | ||
| 0,00 | 0,30 | 0,5023 | −0,6372 | |
| 0,02 | 1,03 | 1,6980 | −0,5897 | |
| 0,00 | 1,60 | 2,6384 | −0,5002 |
13F- og Fondsarkiveringer
Dette skjemaet ble sendt inn den 2021-08-13 for rapporteringsperioden 2021-06-30. Klikk på lenkeikonet for å se hele transaksjonshistorikken.
Oppgradere for å låse opp premiedata og eksportere til Excel![]() .
.
| Verdipapirer | Type | Gjennomsnittlig aksjekurs | Aksjer (MM) |
ΔAksjer (%) |
ΔAksjer (%) |
Verdi ($MM) |
Portefølje (%) |
ΔPortefølje (%) |
|
|---|---|---|---|---|---|---|---|---|---|
| AAPL / Apple Inc. | 0,03 | 32,61 | 3,63 | 48,69 | 5,9801 | 0,7197 | |||
| KO / The Coca-Cola Company | 0,05 | 2,68 | 4,4073 | 4,4073 | |||||
| GOOGL / Alphabet Inc. | 0,00 | 3,40 | 2,45 | 22,39 | 4,0416 | −0,2774 | |||
| BRK.B / Berkshire Hathaway Inc. | 0,01 | −1,13 | 1,97 | 7,58 | 3,2494 | −0,7013 | |||
| MSFT / Microsoft Corporation | 0,01 | 417,91 | 1,95 | 494,51 | 3,2116 | 2,5050 | |||
| PG / The Procter & Gamble Company | 0,01 | 39,59 | 1,90 | 39,08 | 3,1358 | 0,1868 | |||
| COST / Costco Wholesale Corporation | 0,00 | −2,01 | 1,60 | 9,95 | 2,6384 | −0,5002 | |||
| ORCL / Oracle Corporation | 0,02 | −0,57 | 1,48 | 10,34 | 2,4424 | −0,4527 | |||
| SPY / SPDR S&P 500 ETF | 0,00 | 1,27 | 2,0867 | 2,0867 | |||||
| CSCO / Cisco Systems, Inc. | 0,02 | 11,60 | 1,21 | 14,38 | 1,9912 | −0,2858 | |||
| DIS / The Walt Disney Company | 0,01 | 15,30 | 1,13 | 9,85 | 1,8545 | −0,3535 | |||
| CL / Colgate-Palmolive Company | 0,01 | −0,26 | 1,11 | 2,96 | 1,8314 | −0,4951 | |||
| MDLZ / Mondelez International, Inc. | 0,02 | 7,80 | 1,03 | 15,00 | 1,7046 | −0,2341 | |||
| VZ / Verizon Communications Inc. | 0,02 | 0,72 | 1,03 | −2,92 | 1,6980 | −0,5897 | |||
| UNP / Union Pacific Corporation | 0,00 | 1,01 | 1,6618 | 1,6618 | |||||
| EMR / Emerson Electric Co. | 0,01 | 0,00 | 1,00 | 6,59 | 1,6519 | −0,3752 | |||
| DVA / DaVita Inc. | 0,01 | 0,00 | 0,98 | 11,73 | 1,6157 | −0,2757 | |||
| MDT / Medtronic plc | 0,01 | 1,95 | 0,94 | 7,14 | 1,5564 | −0,3436 | |||
| JNJ / Johnson & Johnson | 0,01 | 139,84 | 0,91 | 140,85 | 1,4954 | 0,6833 | |||
| LLY / Eli Lilly and Company | 0,00 | 87,97 | 0,84 | 130,49 | 1,3818 | 0,5977 | |||
| GILD / Gilead Sciences, Inc. | 0,01 | −2,24 | 0,83 | 4,13 | 1,3703 | −0,3509 | |||
| IBM / International Business Machines Corporation | 0,01 | 0,83 | 1,3637 | 1,3637 | |||||
| MMM / 3M Company | 0,00 | 14,84 | 0,79 | 18,47 | 1,2994 | −0,1352 | |||
| LYB / LyondellBasell Industries N.V. | 0,01 | 0,00 | 0,66 | −1,06 | 1,0788 | −0,3473 | |||
| GIS / General Mills, Inc. | 0,01 | 48,07 | 0,55 | 47,04 | 0,9009 | 0,0995 | |||
| PEP / PepsiCo, Inc. | 0,00 | 36,45 | 0,53 | 42,74 | 0,8745 | 0,0732 | |||
| TMO / Thermo Fisher Scientific Inc. | 0,00 | 34,06 | 0,50 | 48,06 | 0,8169 | 0,0953 | |||
| WFC / Wells Fargo & Company | 0,01 | 0,00 | 0,49 | 15,93 | 0,8152 | −0,1046 | |||
| UNH / UnitedHealth Group Incorporated | 0,00 | 19,44 | 0,49 | 28,80 | 0,8103 | −0,0126 | |||
| DHR / Danaher Corporation | 0,00 | 20,50 | 0,48 | 44,01 | 0,7922 | 0,0727 | |||
| KDP / Keurig Dr Pepper Inc. | 0,01 | 0,00 | 0,48 | 2,56 | 0,7905 | −0,2176 | |||
| KMB / Kimberly-Clark Corporation | 0,00 | 31,70 | 0,47 | 26,61 | 0,7757 | −0,0256 | |||
| CBSH / Commerce Bancshares, Inc. | 0,01 | 0,45 | 0,7444 | 0,7444 | |||||
| BIIB / Biogen Inc. | 0,00 | −1,22 | 0,45 | 22,40 | 0,7378 | −0,0506 | |||
| MO / Altria Group, Inc. | 0,01 | 23,74 | 0,44 | 15,40 | 0,7280 | −0,0971 | |||
| RMD / ResMed Inc. | 0,00 | 2,13 | 0,44 | 29,97 | 0,7214 | −0,0046 | |||
| ATVI / Activision Blizzard Inc | 0,00 | 8,88 | 0,41 | 11,59 | 0,6818 | −0,1173 | |||
| PSA / Public Storage | 0,00 | −12,10 | 0,41 | 7,12 | 0,6687 | −0,1478 | |||
| MSI / Motorola Solutions, Inc. | 0,00 | −6,51 | 0,40 | 7,77 | 0,6621 | −0,1414 | |||
| INTC / Intel Corporation | 0,01 | 23,16 | 0,40 | 7,77 | 0,6621 | −0,1414 | |||
| EXPD / Expeditors International of Washington, Inc. | 0,00 | −9,17 | 0,40 | 6,97 | 0,6571 | −0,1464 | |||
| CBOE / Cboe Global Markets, Inc. | 0,00 | −13,24 | 0,40 | 4,49 | 0,6522 | −0,1642 | |||
| REGN / Regeneron Pharmaceuticals, Inc. | 0,00 | −6,47 | 0,40 | 10,34 | 0,6505 | −0,1206 | |||
| T / AT&T Inc. | 0,01 | 10,66 | 0,39 | 5,12 | 0,6423 | −0,1569 | |||
| ICE / Intercontinental Exchange, Inc. | 0,00 | −2,99 | 0,39 | 3,18 | 0,6407 | −0,1714 | |||
| STE / STERIS plc | 0,00 | −1,80 | 0,38 | 6,67 | 0,6324 | −0,1431 | |||
| DG / Dollar General Corporation | 0,00 | −4,48 | 0,38 | 1,86 | 0,6308 | −0,1792 | |||
| LW / Lamb Weston Holdings, Inc. | 0,00 | −1,58 | 0,38 | 2,41 | 0,6308 | −0,1749 | |||
| WAT / Waters Corporation | 0,00 | 0,38 | 0,6226 | 0,6226 | |||||
| JKHY / Jack Henry & Associates, Inc. | 0,00 | 0,09 | 0,38 | 7,71 | 0,6209 | −0,1330 | |||
| CPB / The Campbell's Company | 0,01 | 12,00 | 0,38 | 1,62 | 0,6193 | −0,1778 | |||
| AKAM / Akamai Technologies, Inc. | 0,00 | −11,47 | 0,38 | 1,08 | 0,6193 | −0,1821 | |||
| DPZ / Domino's Pizza, Inc. | 0,00 | −13,23 | 0,38 | 9,94 | 0,6193 | −0,1175 | |||
| RSG / Republic Services, Inc. | 0,00 | −10,55 | 0,37 | −0,80 | 0,6160 | −0,1962 | |||
| BMY / Bristol-Myers Squibb Company | 0,01 | −5,95 | 0,37 | −0,53 | 0,6143 | −0,1935 | |||
| KR / The Kroger Co. | 0,01 | −2,55 | 0,37 | 3,61 | 0,6143 | −0,1612 | |||
| TTWO / Take-Two Interactive Software, Inc. | 0,00 | −1,59 | 0,37 | −1,33 | 0,6127 | −0,1994 | |||
| WM / Waste Management, Inc. | 0,00 | −10,18 | 0,37 | −2,62 | 0,6110 | −0,2097 | |||
| HSY / The Hershey Company | 0,00 | −10,67 | 0,37 | −1,86 | 0,6077 | −0,2022 | |||
| ZTS / Zoetis Inc. | 0,00 | −4,36 | 0,37 | 13,58 | 0,6061 | −0,0919 | |||
| HRL / Hormel Foods Corporation | 0,01 | 1,52 | 0,37 | 1,66 | 0,6044 | −0,1732 | |||
| POOL / Pool Corporation | 0,00 | −17,68 | 0,37 | 9,55 | 0,6044 | −0,1172 | |||
| CERN / Cerner Corp. | 0,00 | −7,87 | 0,37 | 0,00 | 0,6028 | −0,1856 | |||
| VRSN / VeriSign, Inc. | 0,00 | −8,29 | 0,36 | 5,19 | 0,6011 | −0,1464 | |||
| CTXS / Citrix Systems, Inc. | 0,00 | 18,14 | 0,36 | −1,36 | 0,5962 | −0,1944 | |||
| CME / CME Group Inc. | 0,00 | −4,19 | 0,36 | −0,28 | 0,5929 | −0,1847 | |||
| ABBV / AbbVie Inc. | 0,00 | −7,36 | 0,36 | −3,49 | 0,5929 | −0,2106 | |||
| AMGN / Amgen Inc. | 0,00 | 3,65 | 0,36 | 1,69 | 0,5929 | −0,1697 | |||
| AJG / Arthur J. Gallagher & Co. | 0,00 | −16,36 | 0,36 | −6,02 | 0,5913 | −0,2316 | |||
| MCD / McDonald's Corporation | 0,00 | −4,90 | 0,36 | −2,19 | 0,5896 | −0,1988 | |||
| XOM / Exxon Mobil Corporation | 0,01 | 0,36 | 0,5880 | 0,5880 | |||||
| CLX / The Clorox Company | 0,00 | 3,02 | 0,36 | −4,04 | 0,5863 | −0,2129 | |||
| WBA / Walgreens Boots Alliance, Inc. | 0,01 | −1,08 | 0,35 | −5,33 | 0,5847 | −0,2231 | |||
| COG / Cabot Oil & Gas Corp. | 0,02 | 2,27 | 0,35 | −5,09 | 0,5830 | −0,2205 | |||
| CHD / Church & Dwight Co., Inc. | 0,00 | −2,95 | 0,35 | −5,11 | 0,5814 | −0,2200 | |||
| CNC / Centene Corporation | 0,00 | −10,17 | 0,35 | 2,62 | 0,5814 | −0,1597 | |||
| VRSK / Verisk Analytics, Inc. | 0,00 | 4,33 | 0,35 | 2,92 | 0,5814 | −0,1575 | |||
| CVS / CVS Health Corporation | 0,00 | −15,76 | 0,35 | −6,63 | 0,5797 | −0,2324 | |||
| CHRW / C.H. Robinson Worldwide, Inc. | 0,00 | −3,29 | 0,35 | −5,12 | 0,5797 | −0,2195 | |||
| PGR / The Progressive Corporation | 0,00 | −10,33 | 0,35 | −8,14 | 0,5764 | −0,2443 | |||
| CB / Chubb Limited | 0,00 | 0,35 | 0,5748 | 0,5748 | |||||
| AES / The AES Corporation | 0,01 | 0,35 | 0,5748 | 0,5748 | |||||
| K / Kellanova | 0,01 | −5,70 | 0,35 | −4,13 | 0,5731 | −0,2088 | |||
| MKC / McCormick & Company, Incorporated | 0,00 | −0,10 | 0,35 | −0,86 | 0,5698 | −0,1820 | |||
| CINF / Cincinnati Financial Corporation | 0,00 | −10,92 | 0,34 | 0,58 | 0,5682 | −0,1707 | |||
| SJM / The J. M. Smucker Company | 0,00 | −3,36 | 0,34 | −0,88 | 0,5583 | −0,1784 | |||
| DTE / DTE Energy Company | 0,00 | −3,45 | 0,34 | −6,13 | 0,5550 | −0,2183 | |||
| VRTX / Vertex Pharmaceuticals Incorporated | 0,00 | 0,24 | 0,33 | −5,93 | 0,5484 | −0,2141 | |||
| TRV / The Travelers Companies, Inc. | 0,00 | 0,00 | 0,33 | −0,61 | 0,5386 | −0,1702 | |||
| ROL / Rollins, Inc. | 0,01 | 0,33 | 0,5386 | 0,5386 | |||||
| AMCR / Amcor plc | 0,03 | 0,32 | 0,5303 | 0,5303 | |||||
| PPL / PPL Corporation | 0,01 | −0,99 | 0,32 | −3,90 | 0,5270 | −0,1903 | |||
| RE / Everest Re Group Ltd | 0,00 | 0,32 | 0,5270 | 0,5270 | |||||
| WMT / Walmart Inc. | 0,00 | −44,45 | 0,30 | −42,34 | 0,5023 | −0,6372 | |||
| SNPS / Synopsys, Inc. | 0,00 | 0,22 | 0,3673 | 0,3673 | |||||
| META / Meta Platforms, Inc. | 0,00 | 0,22 | 0,3590 | 0,3590 | |||||
| UMBF / UMB Financial Corporation | 0,00 | 0,21 | 0,3459 | 0,3459 | |||||
| ABC / Amerisource Bergen Corp. | 0,00 | −100,00 | 0,00 | −100,00 | −0,7216 | ||||
| NOC / Northrop Grumman Corporation | 0,00 | −100,00 | 0,00 | −100,00 | −0,8057 | ||||
| TSN / Tyson Foods, Inc. | 0,00 | −100,00 | 0,00 | −100,00 | −0,8035 | ||||
| EVRG / Evergy, Inc. | 0,00 | −100,00 | 0,00 | −100,00 | −0,7238 | ||||
| WTW / Willis Towers Watson Public Limited Company | 0,00 | −100,00 | 0,00 | −100,00 | −0,8057 | ||||
| BF.B / Brown-Forman Corporation | 0,00 | −100,00 | 0,00 | −100,00 | −0,6936 |