Grunnleggende statistikk
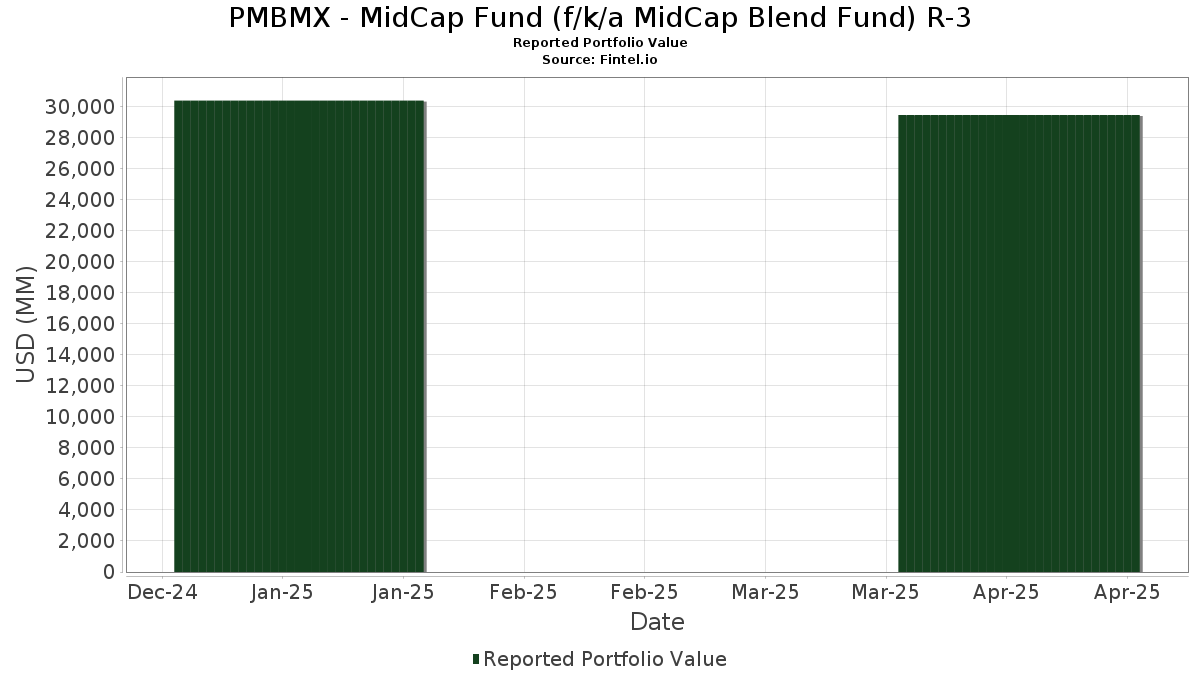
| Porteføljeverdi | $ 29 481 138 387 |
| Nåværende posisjoner | 73 |
Siste beholdninger, prestasjoner, forvaltet kapital (fra 13F, 13D)
PMBMX - MidCap Fund (f/k/a MidCap Blend Fund) R-3 har oppgitt 73 totale beholdninger i sine siste SEC-arkiveringer. Siste porteføljeverdi er beregnet til 29 481 138 387 USD. Faktisk forvaltet kapital (AUM) er denne verdien pluss kontanter (som ikke er oppgitt). PMBMX - MidCap Fund (f/k/a MidCap Blend Fund) R-3s største beholdninger er TransDigm Group Incorporated (US:TDG) , Copart, Inc. (US:CPRT) , Brookfield Corporation (US:BN) , Heico Corp. - Class A (US:HEIA) , and O'Reilly Automotive, Inc. (US:ORLY) . PMBMX - MidCap Fund (f/k/a MidCap Blend Fund) R-3s nye posisjoner inkluderer Toast, Inc. (US:TOST) , .
De største økningene dette kvartalet
Vi bruker endringen i porteføljeallokeringen fordi dette er det mest meningsfulle målet. Endringer kan skyldes handler eller endringer i aksjekursene.
| Verdipapirer | Aksjer (MM) |
Verdi (MM$) |
Portefølje % | ΔPortefølje % |
|---|---|---|---|---|
| 4,25 | 151,21 | 0,5128 | 0,5128 | |
| 24,51 | 1 495,90 | 5,0730 | 0,5107 | |
| 0,99 | 315,65 | 1,0704 | 0,4527 | |
| 0,57 | 246,01 | 0,8343 | 0,3973 | |
| 0,99 | 1 399,14 | 4,7449 | 0,3931 | |
| 7,04 | 1 415,44 | 4,8001 | 0,3215 | |
| 1,09 | 1 542,06 | 5,2295 | 0,3038 | |
| 4,41 | 1 156,50 | 3,9220 | 0,2593 | |
| 3,49 | 250,10 | 0,8481 | 0,2462 | |
| 2,37 | 169,19 | 0,5738 | 0,2376 |
De største reduksjonene dette kvartalet
Vi bruker endringen i porteføljeallokeringen fordi dette er det mest meningsfulle målet. Endringer kan skyldes handler eller endringer i aksjekurser.
| Verdipapirer | Aksjer (MM) |
Verdi (MM$) |
Portefølje % | ΔPortefølje % |
|---|---|---|---|---|
| 9,67 | 1 104,84 | 3,7468 | −1,3740 | |
| 3,97 | 256,82 | 0,8710 | −0,9403 | |
| 0,00 | 0,00 | −0,5699 | ||
| 1,27 | 533,99 | 1,8109 | −0,4568 | |
| 2,61 | 397,91 | 1,3494 | −0,2228 | |
| 5,70 | 1 285,38 | 4,3591 | −0,1982 | |
| 0,71 | 119,84 | 0,4064 | −0,1486 | |
| 0,23 | 241,79 | 0,8200 | −0,1455 | |
| 0,90 | 487,04 | 1,6517 | −0,1303 | |
| 0,20 | 88,64 | 0,3006 | −0,1205 |
13F- og Fondsarkiveringer
Dette skjemaet ble sendt inn den 2025-06-23 for rapporteringsperioden 2025-04-30. Klikk på lenkeikonet for å se hele transaksjonshistorikken.
Oppgradere for å låse opp premiedata og eksportere til Excel![]() .
.
| Verdipapirer | Type | Gjennomsnittlig aksjekurs | Aksjer (MM) |
ΔAksjer (%) |
ΔAksjer (%) |
Verdi ($MM) |
Portefølje (%) |
ΔPortefølje (%) |
|
|---|---|---|---|---|---|---|---|---|---|
| TDG / TransDigm Group Incorporated | 1,09 | −1,42 | 1 542,06 | 2,93 | 5,2295 | 0,3038 | |||
| CPRT / Copart, Inc. | 24,51 | 2,33 | 1 495,90 | 7,81 | 5,0730 | 0,5107 | |||
| BN / Brookfield Corporation | 27,84 | 9,54 | 1 494,38 | −3,94 | 5,0678 | −0,0469 | |||
| HEIA / Heico Corp. - Class A | 7,04 | −1,57 | 1 415,44 | 3,91 | 4,8001 | 0,3215 | |||
| ORLY / O'Reilly Automotive, Inc. | 0,99 | −3,31 | 1 399,14 | 5,71 | 4,7449 | 0,3931 | |||
| HLT / Hilton Worldwide Holdings Inc. | 5,70 | 5,32 | 1 285,38 | −7,26 | 4,3591 | −0,1982 | |||
| VMC / Vulcan Materials Company | 4,41 | 8,49 | 1 156,50 | 3,82 | 3,9220 | 0,2593 | |||
| KKR / KKR & Co. Inc. | 9,67 | 3,72 | 1 104,84 | −29,06 | 3,7468 | −1,3740 | |||
| BRO / Brown & Brown, Inc. | 9,48 | −2,64 | 1 048,34 | 2,89 | 3,5552 | 0,2050 | |||
| CSGP / CoStar Group, Inc. | 10,95 | −0,43 | 811,80 | −3,58 | 2,7530 | −0,0153 | |||
| MLM / Martin Marietta Materials, Inc. | 1,46 | 8,99 | 763,99 | 4,96 | 2,5909 | 0,1976 | |||
| LYV / Live Nation Entertainment, Inc. | 5,71 | 4,83 | 756,83 | −4,03 | 2,5666 | −0,0263 | |||
| CBRE / CBRE Group, Inc. | 6,19 | 10,09 | 756,26 | −7,07 | 2,5647 | −0,1109 | |||
| BIP / Brookfield Infrastructure Partners L.P. - Limited Partnership | 25,06 | 5,34 | 752,00 | −3,65 | 2,5502 | −0,0158 | |||
| MKL / Markel Group Inc. | 0,41 | −0,63 | 747,93 | −1,18 | 2,5364 | 0,0479 | |||
| ROP / Roper Technologies, Inc. | 1,27 | −0,40 | 711,46 | −3,10 | 2,4128 | −0,0012 | |||
| CSU / Constellation Software Inc. | 0,17 | −0,39 | 599,19 | 8,94 | 2,0320 | 0,2235 | |||
| DPZ / Domino's Pizza, Inc. | 1,19 | −0,37 | 583,45 | 8,78 | 1,9786 | 0,2151 | |||
| MSCI / MSCI Inc. | 1,02 | 1,40 | 555,17 | −7,38 | 1,8827 | −0,0880 | |||
| IT / Gartner, Inc. | 1,27 | −0,19 | 533,99 | −22,58 | 1,8109 | −0,4568 | |||
| ACGL / Arch Capital Group Ltd. | 5,80 | −2,19 | 525,63 | −4,71 | 1,7826 | −0,0310 | |||
| VEEV / Veeva Systems Inc. | 2,21 | 6,05 | 516,94 | 6,25 | 1,7531 | 0,1534 | |||
| FWONK / Formula One Group | 5,50 | −0,27 | 487,52 | −7,60 | 1,6533 | −0,0815 | |||
| TYL / Tyler Technologies, Inc. | 0,90 | −0,49 | 487,04 | −10,14 | 1,6517 | −0,1303 | |||
| FICO / Fair Isaac Corporation | 0,22 | 7,64 | 446,46 | 14,32 | 1,5141 | 0,2300 | |||
| ARES / Ares Management Corporation | 2,61 | 8,14 | 397,91 | −16,79 | 1,3494 | −0,2228 | |||
| AJG / Arthur J. Gallagher & Co. | 1,12 | 0,24 | 359,11 | 6,51 | 1,2179 | 0,1093 | |||
| FAST / Fastenal Company | 4,34 | 0,00 | 351,26 | 10,55 | 1,1912 | 0,1466 | |||
| NVR / NVR, Inc. | 0,05 | 6,02 | 324,27 | −5,76 | 1,0997 | −0,0316 | |||
| PGR / The Progressive Corporation | 1,14 | −6,34 | 320,70 | 7,08 | 1,0876 | 0,1028 | |||
| LPLA / LPL Financial Holdings Inc. | 0,99 | 92,75 | 315,65 | 68,01 | 1,0704 | 0,4527 | |||
| WCN / Waste Connections, Inc. | 1,48 | −4,07 | 292,23 | 3,16 | 0,9910 | 0,0597 | |||
| ENTG / Entegris, Inc. | 3,50 | 58,64 | 277,31 | 23,61 | 0,9404 | 0,2028 | |||
| BAM / Brookfield Asset Management Ltd. | 4,91 | 1,01 | 261,91 | −9,96 | 0,8882 | −0,0682 | |||
| KMX / CarMax, Inc. | 3,97 | −38,26 | 256,82 | −53,38 | 0,8710 | −0,9403 | |||
| WRB / W. R. Berkley Corporation | 3,49 | 12,10 | 250,10 | 36,61 | 0,8481 | 0,2462 | |||
| IDXX / IDEXX Laboratories, Inc. | 0,57 | 80,55 | 246,01 | 85,08 | 0,8343 | 0,3973 | |||
| H / Hyatt Hotels Corporation | 2,16 | 26,58 | 243,78 | −9,86 | 0,8267 | −0,0625 | |||
| MTD / Mettler-Toledo International Inc. | 0,23 | 4,95 | 241,79 | −17,66 | 0,8200 | −0,1455 | |||
| APD / Air Products and Chemicals, Inc. | 0,85 | 19,10 | 230,88 | −3,70 | 0,7830 | −0,0053 | |||
| LEN / Lennar Corporation | 2,11 | 4,73 | 228,94 | −13,33 | 0,7764 | −0,0921 | |||
| VRSK / Verisk Analytics, Inc. | 0,73 | 0,00 | 215,28 | 3,13 | 0,7301 | 0,0437 | |||
| AME / AMETEK, Inc. | 1,26 | 10,84 | 213,35 | 1,84 | 0,7235 | 0,0348 | |||
| CCCS / CCC Intelligent Solutions Holdings Inc. | 20,80 | 3,14 | 192,65 | −14,04 | 0,6533 | −0,0835 | |||
| ROST / Ross Stores, Inc. | 1,26 | 3,16 | 175,74 | −4,76 | 0,5960 | −0,0107 | |||
| BEP / Brookfield Renewable Partners L.P. - Limited Partnership | 7,55 | 6,39 | 173,93 | 11,98 | 0,5898 | 0,0792 | |||
| WAT / Waters Corporation | 0,49 | 1,27 | 171,25 | −15,24 | 0,5808 | −0,0835 | |||
| FND / Floor & Decor Holdings, Inc. | 2,37 | 131,89 | 169,19 | 65,50 | 0,5738 | 0,2376 | |||
| MTN / Vail Resorts, Inc. | 1,20 | 0,00 | 166,57 | −18,18 | 0,5649 | −0,1044 | |||
| RYAN / Ryan Specialty Holdings, Inc. | 2,34 | 25,88 | 153,49 | 23,85 | 0,5205 | 0,1131 | |||
| TOST / Toast, Inc. | 4,25 | 151,21 | 0,5128 | 0,5128 | |||||
| PCOR / Procore Technologies, Inc. | 2,13 | 2,32 | 136,68 | −17,57 | 0,4635 | −0,0817 | |||
| GGG / Graco Inc. | 1,49 | 0,86 | 121,31 | −2,21 | 0,4114 | 0,0035 | |||
| WIX / Wix.com Ltd. | 0,71 | 0,00 | 119,84 | −29,01 | 0,4064 | −0,1486 | |||
| ANSS / ANSYS, Inc. | 0,35 | 0,00 | 112,00 | −8,16 | 0,3798 | −0,0212 | |||
| SHW / The Sherwin-Williams Company | 0,31 | 0,00 | 109,11 | −1,46 | 0,3700 | 0,0060 | |||
| MCO / Moody's Corporation | 0,20 | −23,72 | 88,64 | −30,80 | 0,3006 | −0,1205 | |||
| APPF / AppFolio, Inc. | 0,40 | 302,64 | 82,85 | 255,50 | 0,2810 | 0,2043 | |||
| PRM / Perimeter Solutions, Inc. | 8,06 | 0,00 | 81,61 | −18,96 | 0,2768 | −0,0543 | |||
| BEPC / Brookfield Renewable Corporation | 2,48 | 3,83 | 70,59 | 10,72 | 0,2394 | 0,0298 | |||
| VLTO / Veralto Corporation | 0,61 | 0,00 | 58,02 | −7,25 | 0,1968 | −0,0089 | |||
| FWONA / Formula One Group | 0,51 | −2,42 | 40,73 | −10,70 | 0,1381 | −0,0118 | |||
| JKHY / Jack Henry & Associates, Inc. | 0,19 | 0,00 | 33,25 | −0,38 | 0,1128 | 0,0030 | |||
| MRP / Millrose Properties, Inc. | 1,02 | 1,93 | 25,54 | 130,78 | 0,0866 | 0,0502 | |||
| LLYVK / Liberty Live Group | 0,16 | 0,00 | 11,27 | −2,83 | 0,0382 | 0,0001 | |||
| LMN / Lumine Group Inc. | 0,33 | 0,00 | 10,67 | 24,30 | 0,0362 | 0,0080 | |||
| BNT / Brookfield Wealth Solutions Ltd. | 0,16 | 0,00 | 8,39 | −12,38 | 0,0284 | −0,0030 | |||
| LENB / Lennar Corp. - Class B | 0,04 | 0,00 | 3,99 | −17,84 | 0,0135 | −0,0024 | |||
| US74257B6395 / Principal Government Money Market Fund - Class R-6 | 3,33 | −76,60 | 3,33 | −76,60 | 0,0113 | −0,0355 | |||
| VRSN / VeriSign, Inc. | 0,01 | −95,67 | 2,04 | −94,31 | 0,0069 | −0,1108 | |||
| LLYVA / Liberty Live Group | 0,02 | 0,00 | 1,53 | −2,80 | 0,0052 | 0,0000 | |||
| TFDXX / Blackrock Liquidity Funds - BlackRock Liquidity Funds FedFund Portfolio Institutional Class | 0,40 | −52,92 | 0,40 | −52,98 | 0,0014 | −0,0014 | |||
| SEG / Seaport Entertainment Group Inc. | 0,02 | 0,00 | 0,32 | −28,19 | 0,0011 | −0,0004 | |||
| ADSK / Autodesk, Inc. | 0,00 | −100,00 | 0,00 | −100,00 | −0,5699 | ||||
| CA21037X1345 / CONSTELLATION SOFTWARE INC | 0,14 | 0,00 | 0,00 | 0,0000 | 0,0000 |