Grunnleggende statistikk
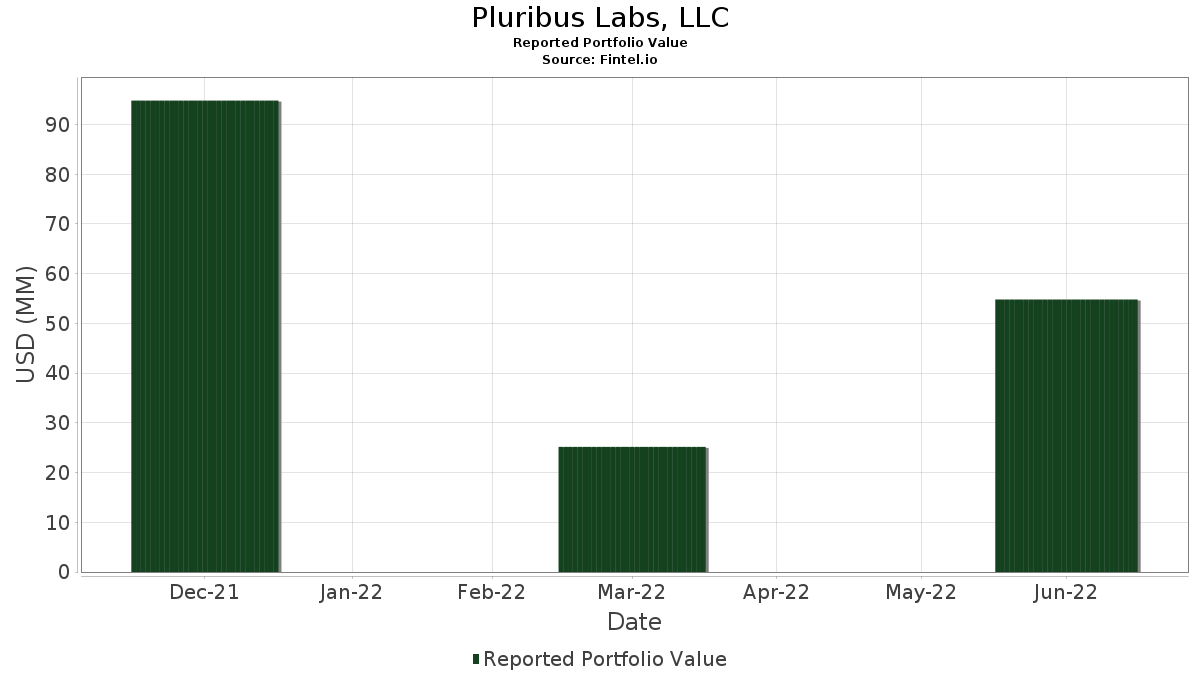
| Porteføljeverdi | $ 54 810 000 |
| Nåværende posisjoner | 86 |
Siste beholdninger, prestasjoner, forvaltet kapital (fra 13F, 13D)
Pluribus Labs, LLC har oppgitt 86 totale beholdninger i sine siste SEC-arkiveringer. Siste porteføljeverdi er beregnet til 54 810 000 USD. Faktisk forvaltet kapital (AUM) er denne verdien pluss kontanter (som ikke er oppgitt). Pluribus Labs, LLCs største beholdninger er Apple Inc. (US:AAPL) , Microsoft Corporation (US:MSFT) , Alphabet Inc. (US:GOOGL) , Amazon.com, Inc. (US:AMZN) , and Berkshire Hathaway Inc. (US:BRK.B) . Pluribus Labs, LLCs nye posisjoner inkluderer Cisco Systems, Inc. (US:CSCO) , Mondelez International, Inc. (US:MDLZ) , Northrop Grumman Corporation (US:NOC) , Bristol-Myers Squibb Company (US:BMY) , and Intuitive Surgical, Inc. (US:ISRG) .
De største økningene dette kvartalet
Vi bruker endringen i porteføljeallokeringen fordi dette er det mest meningsfulle målet. Endringer kan skyldes handler eller endringer i aksjekursene.
| Verdipapirer | Aksjer (MM) |
Verdi (MM$) |
Portefølje % | ΔPortefølje % |
|---|---|---|---|---|
| 0,02 | 0,71 | 1,2936 | 1,2936 | |
| 0,01 | 0,69 | 1,2680 | 1,2680 | |
| 0,00 | 0,59 | 1,0783 | 1,0783 | |
| 0,01 | 0,48 | 0,8758 | 0,8758 | |
| 0,00 | 0,47 | 0,8612 | 0,8612 | |
| 0,00 | 0,46 | 0,8466 | 0,8466 | |
| 0,00 | 0,41 | 0,7553 | 0,7553 | |
| 0,00 | 0,40 | 0,7261 | 0,7261 | |
| 0,00 | 0,40 | 0,7243 | 0,7243 | |
| 0,02 | 0,36 | 0,6532 | 0,6532 |
De største reduksjonene dette kvartalet
Vi bruker endringen i porteføljeallokeringen fordi dette er det mest meningsfulle målet. Endringer kan skyldes handler eller endringer i aksjekurser.
| Verdipapirer | Aksjer (MM) |
Verdi (MM$) |
Portefølje % | ΔPortefølje % |
|---|---|---|---|---|
| 0,02 | 3,98 | 7,2614 | −4,4479 | |
| 0,02 | 2,59 | 4,7199 | −4,2955 | |
| 0,01 | 1,12 | 2,0379 | −1,9870 | |
| 0,04 | 5,37 | 9,8011 | −1,8843 | |
| 0,00 | 3,53 | 6,4331 | −1,5890 | |
| 0,00 | 0,00 | −1,4105 | ||
| 0,00 | 1,12 | 2,0489 | −1,1814 | |
| 0,00 | 0,00 | −1,1483 | ||
| 0,00 | 0,56 | 1,0162 | −1,0777 | |
| 0,00 | 0,00 | −1,0132 |
13F- og Fondsarkiveringer
Dette skjemaet ble sendt inn den 2022-08-12 for rapporteringsperioden 2022-06-30. Klikk på lenkeikonet for å se hele transaksjonshistorikken.
Oppgradere for å låse opp premiedata og eksportere til Excel![]() .
.
| Verdipapirer | Type | Gjennomsnittlig aksjekurs | Aksjer (MM) |
ΔAksjer (%) |
ΔAksjer (%) |
Verdi ($MM) |
Portefølje (%) |
ΔPortefølje (%) |
|
|---|---|---|---|---|---|---|---|---|---|
| AAPL / Apple Inc. | 0,04 | 133,22 | 5,37 | 82,66 | 9,8011 | −1,8843 | |||
| MSFT / Microsoft Corporation | 0,02 | 62,12 | 3,98 | 35,05 | 7,2614 | −4,4479 | |||
| GOOGL / Alphabet Inc. | 0,00 | 122,87 | 3,53 | 74,64 | 6,4331 | −1,5890 | |||
| AMZN / Amazon.com, Inc. | 0,02 | 3 400,00 | 2,59 | 14,01 | 4,7199 | −4,2955 | |||
| BRK.B / Berkshire Hathaway Inc. | 0,01 | 135,47 | 1,92 | 82,15 | 3,4994 | −0,6845 | |||
| MRK / Merck & Co., Inc. | 0,02 | 141,73 | 1,41 | 168,44 | 2,5762 | 0,4862 | |||
| LLY / Eli Lilly and Company | 0,00 | 151,78 | 1,19 | 184,73 | 2,1766 | 0,5118 | |||
| TSLA / Tesla, Inc. | 0,00 | 121,09 | 1,12 | 38,13 | 2,0489 | −1,1814 | |||
| NVDA / NVIDIA Corporation | 0,01 | 98,44 | 1,12 | 10,27 | 2,0379 | −1,9870 | |||
| COST / Costco Wholesale Corporation | 0,00 | 169,01 | 1,10 | 123,98 | 2,0106 | 0,0557 | |||
| HD / The Home Depot, Inc. | 0,00 | 148,63 | 1,04 | 128,01 | 1,9011 | 0,0853 | |||
| AMJ / JPMorgan Alerian MLP Index ETN - Corporate Bond/Note | 0,01 | 123,88 | 0,98 | 84,80 | 1,7971 | −0,3207 | |||
| T / AT&T Inc. | 0,05 | 173,54 | 0,95 | 142,46 | 1,7296 | 0,1761 | |||
| HON / Honeywell International Inc. | 0,00 | 110,82 | 0,87 | 88,48 | 1,5818 | −0,2459 | |||
| JNJ / Johnson & Johnson | 0,00 | 48,46 | 0,83 | 48,57 | 1,5180 | −0,7071 | |||
| LMT / Lockheed Martin Corporation | 0,00 | 144,90 | 0,80 | 138,58 | 1,4669 | 0,1279 | |||
| CSCO / Cisco Systems, Inc. | 0,02 | 0,71 | 1,2936 | 1,2936 | |||||
| C.WSA / Citigroup, Inc. | 0,00 | 142,56 | 0,70 | 93,15 | 1,2863 | −0,1640 | |||
| MDLZ / Mondelez International, Inc. | 0,01 | 0,69 | 1,2680 | 1,2680 | |||||
| BAC.PRB / Bank of America Corporation - Preferred Stock | 0,02 | 121,83 | 0,68 | 67,32 | 1,2425 | −0,3747 | |||
| CB / Chubb Limited | 0,00 | 127,13 | 0,68 | 108,98 | 1,2315 | −0,0518 | |||
| ADI / Analog Devices, Inc. | 0,00 | 95,47 | 0,62 | 72,85 | 1,1385 | −0,2959 | |||
| NFLX / Netflix, Inc. | 0,00 | 497,80 | 0,62 | 179,64 | 1,1275 | 0,2494 | |||
| NOC / Northrop Grumman Corporation | 0,00 | 0,59 | 1,0783 | 1,0783 | |||||
| REGN / Regeneron Pharmaceuticals, Inc. | 0,00 | 102,77 | 0,56 | 71,65 | 1,0272 | −0,2761 | |||
| MMM / 3M Company | 0,00 | 211,10 | 0,56 | 170,19 | 1,0254 | 0,1989 | |||
| WMT / Walmart Inc. | 0,00 | 29,47 | 0,56 | 5,69 | 1,0162 | −1,0777 | |||
| CMCSA / Comcast Corporation | 0,01 | 200,37 | 0,54 | 152,11 | 0,9797 | 0,1334 | |||
| MDT / Medtronic plc | 0,01 | 178,43 | 0,49 | 125,57 | 0,9013 | 0,0311 | |||
| MCK / McKesson Corporation | 0,00 | 81,59 | 0,49 | 93,70 | 0,8976 | −0,1116 | |||
| BMY / Bristol-Myers Squibb Company | 0,01 | 0,48 | 0,8758 | 0,8758 | |||||
| ISRG / Intuitive Surgical, Inc. | 0,00 | 0,47 | 0,8612 | 0,8612 | |||||
| SNPS / Synopsys, Inc. | 0,00 | 0,46 | 0,8466 | 0,8466 | |||||
| APD / Air Products and Chemicals, Inc. | 0,00 | 135,21 | 0,46 | 125,98 | 0,8411 | 0,0305 | |||
| IBM / International Business Machines Corporation | 0,00 | 20,06 | 0,42 | 30,31 | 0,7608 | −0,5106 | |||
| HCA / HCA Healthcare, Inc. | 0,00 | 0,41 | 0,7553 | 0,7553 | |||||
| NXPI / NXP Semiconductors N.V. | 0,00 | 105,82 | 0,40 | 64,49 | 0,7353 | −0,2382 | |||
| MSI / Motorola Solutions, Inc. | 0,00 | 0,40 | 0,7261 | 0,7261 | |||||
| WELL / Welltower Inc. | 0,00 | 0,40 | 0,7243 | 0,7243 | |||||
| RMD / ResMed Inc. | 0,00 | 106,74 | 0,38 | 79,25 | 0,6933 | −0,1490 | |||
| DXCM / DexCom, Inc. | 0,00 | 802,17 | 0,37 | 31,80 | 0,6805 | −0,4439 | |||
| PLD / Prologis, Inc. | 0,00 | 32,54 | 0,37 | −3,43 | 0,6678 | −0,8381 | |||
| KMI / Kinder Morgan, Inc. | 0,02 | 0,36 | 0,6532 | 0,6532 | |||||
| ECL / Ecolab Inc. | 0,00 | 0,35 | 0,6331 | 0,6331 | |||||
| KEYS / Keysight Technologies, Inc. | 0,00 | 0,34 | 0,6294 | 0,6294 | |||||
| DG / Dollar General Corporation | 0,00 | 0,34 | 0,6221 | 0,6221 | |||||
| AEE / Ameren Corporation | 0,00 | 0,34 | 0,6167 | 0,6167 | |||||
| ROK / Rockwell Automation, Inc. | 0,00 | 0,33 | 0,6057 | 0,6057 | |||||
| DE / Deere & Company | 0,00 | 0,33 | 0,5984 | 0,5984 | |||||
| ABC / Amerisource Bergen Corp. | 0,00 | 0,33 | 0,5948 | 0,5948 | |||||
| EA / Electronic Arts Inc. | 0,00 | 0,32 | 0,5911 | 0,5911 | |||||
| AME / AMETEK, Inc. | 0,00 | 0,32 | 0,5857 | 0,5857 | |||||
| CMI / Cummins Inc. | 0,00 | 0,32 | 0,5802 | 0,5802 | |||||
| ANSS / ANSYS, Inc. | 0,00 | 0,32 | 0,5802 | 0,5802 | |||||
| VTR / Ventas, Inc. | 0,01 | 0,32 | 0,5784 | 0,5784 | |||||
| TTWO / Take-Two Interactive Software, Inc. | 0,00 | 0,31 | 0,5619 | 0,5619 | |||||
| SE / Sea Limited - Depositary Receipt (Common Stock) | 0,00 | 116,27 | 0,30 | 20,56 | 0,5455 | −0,4399 | |||
| MMC / Marsh & McLennan Companies, Inc. | 0,00 | 0,29 | 0,5291 | 0,5291 | |||||
| J / Jacobs Solutions Inc. | 0,00 | 0,29 | 0,5273 | 0,5273 | |||||
| ADM / Archer-Daniels-Midland Company | 0,00 | 0,29 | 0,5236 | 0,5236 | |||||
| EXPD / Expeditors International of Washington, Inc. | 0,00 | 0,29 | 0,5236 | 0,5236 | |||||
| INTC / Intel Corporation | 0,01 | 0,29 | 0,5218 | 0,5218 | |||||
| BAH / Booz Allen Hamilton Holding Corporation | 0,00 | 0,28 | 0,5200 | 0,5200 | |||||
| AES / The AES Corporation | 0,01 | 0,28 | 0,5163 | 0,5163 | |||||
| DGX / Quest Diagnostics Incorporated | 0,00 | 0,28 | 0,5145 | 0,5145 | |||||
| AKAM / Akamai Technologies, Inc. | 0,00 | 0,28 | 0,5127 | 0,5127 | |||||
| SUI / Sun Communities, Inc. | 0,00 | 0,28 | 0,5036 | 0,5036 | |||||
| LDOS / Leidos Holdings, Inc. | 0,00 | 0,28 | 0,5036 | 0,5036 | |||||
| TXT / Textron Inc. | 0,00 | 0,27 | 0,4999 | 0,4999 | |||||
| DLTR / Dollar Tree, Inc. | 0,00 | 0,27 | 0,4999 | 0,4999 | |||||
| XOM / Exxon Mobil Corporation | 0,00 | 8,57 | 0,27 | 12,40 | 0,4963 | −0,4653 | |||
| GD / General Dynamics Corporation | 0,00 | 0,27 | 0,4908 | 0,4908 | |||||
| ABBV / AbbVie Inc. | 0,00 | −17,03 | 0,27 | −21,57 | 0,4908 | −0,8721 | |||
| TWLO / Twilio Inc. | 0,00 | 0,26 | 0,4744 | 0,4744 | |||||
| BG / Bunge Global SA | 0,00 | 0,26 | 0,4671 | 0,4671 | |||||
| TDY / Teledyne Technologies Incorporated | 0,00 | 0,26 | 0,4652 | 0,4652 | |||||
| BBY / Best Buy Co., Inc. | 0,00 | 0,25 | 0,4488 | 0,4488 | |||||
| CME / CME Group Inc. | 0,00 | 37,96 | 0,24 | 18,45 | 0,4452 | −0,3733 | |||
| CVX / Chevron Corporation | 0,00 | 0,91 | 0,24 | −10,41 | 0,4397 | −0,6291 | |||
| TDOC / Teladoc Health, Inc. | 0,01 | 0,23 | 0,4269 | 0,4269 | |||||
| CVS / CVS Health Corporation | 0,00 | 0,23 | 0,4215 | 0,4215 | |||||
| CHRW / C.H. Robinson Worldwide, Inc. | 0,00 | 0,23 | 0,4178 | 0,4178 | |||||
| WRK / WestRock Company | 0,01 | 0,23 | 0,4160 | 0,4160 | |||||
| KO / The Coca-Cola Company | 0,00 | 0,22 | 0,4050 | 0,4050 | |||||
| CG / The Carlyle Group Inc. | 0,01 | 0,22 | 0,3996 | 0,3996 | |||||
| GL / Globe Life Inc. | 0,00 | 0,21 | 0,3813 | 0,3813 | |||||
| TEL / TE Connectivity plc | 0,00 | −100,00 | 0,00 | −100,00 | −0,9059 | ||||
| DIS / The Walt Disney Company | 0,00 | −100,00 | 0,00 | −100,00 | −0,9099 | ||||
| META / Meta Platforms, Inc. | 0,00 | −100,00 | 0,00 | −100,00 | −0,8145 | ||||
| PFE / Pfizer Inc. | 0,00 | −100,00 | 0,00 | −100,00 | −1,0132 | ||||
| UPS / United Parcel Service, Inc. | 0,00 | −100,00 | 0,00 | −100,00 | −1,4105 | ||||
| V / Visa Inc. | 0,00 | −100,00 | 0,00 | −100,00 | −1,1483 |