Grunnleggende statistikk
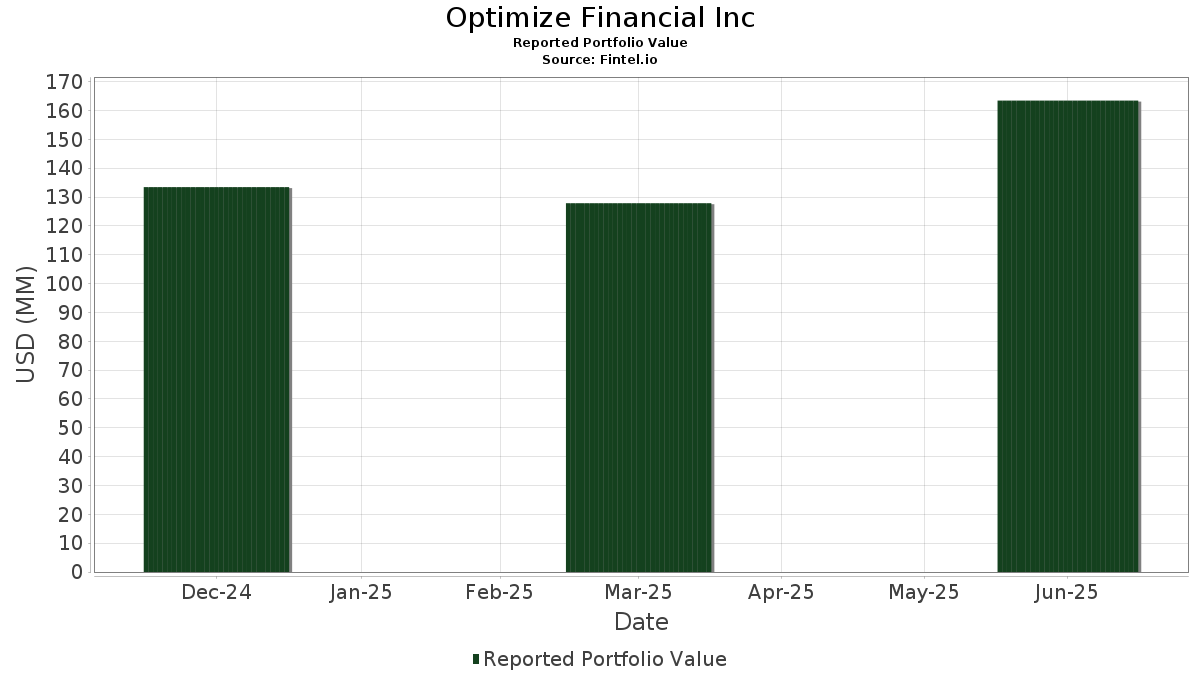
| Porteføljeverdi | $ 163 434 145 |
| Nåværende posisjoner | 231 |
Siste beholdninger, prestasjoner, forvaltet kapital (fra 13F, 13D)
Optimize Financial Inc har oppgitt 231 totale beholdninger i sine siste SEC-arkiveringer. Siste porteføljeverdi er beregnet til 163 434 145 USD. Faktisk forvaltet kapital (AUM) er denne verdien pluss kontanter (som ikke er oppgitt). Optimize Financial Incs største beholdninger er TTM Technologies, Inc. (US:TTMI) , Advanced Micro Devices, Inc. (US:AMD) , CommScope Holding Company, Inc. (US:COMM) , CrowdStrike Holdings, Inc. (US:CRWD) , and NVIDIA Corporation (US:NVDA) . Optimize Financial Incs nye posisjoner inkluderer Proficient Auto Logistics, Inc. (US:PAL) , Oklo Inc. (US:OKLO) , GRAIL, Inc. (US:GRAL) , Tenet Healthcare Corporation (US:THC) , and Tempus AI, Inc. (US:TEM) .
De største økningene dette kvartalet
Vi bruker endringen i porteføljeallokeringen fordi dette er det mest meningsfulle målet. Endringer kan skyldes handler eller endringer i aksjekursene.
| Verdipapirer | Aksjer (MM) |
Verdi (MM$) |
Portefølje % | ΔPortefølje % |
|---|---|---|---|---|
| 0,31 | 2,22 | 1,3614 | 1,3614 | |
| 0,08 | 3,33 | 2,0368 | 0,8155 | |
| 0,04 | 1,92 | 1,1777 | 0,4938 | |
| 0,32 | 2,65 | 1,6195 | 0,3801 | |
| 0,03 | 2,58 | 1,5812 | 0,3360 | |
| 0,02 | 2,63 | 1,6119 | 0,2925 | |
| 0,01 | 2,63 | 1,6121 | 0,2806 | |
| 0,01 | 0,44 | 0,2667 | 0,2667 | |
| 0,01 | 0,37 | 0,2256 | 0,2256 | |
| 0,02 | 2,69 | 1,6467 | 0,2239 |
De største reduksjonene dette kvartalet
Vi bruker endringen i porteføljeallokeringen fordi dette er det mest meningsfulle målet. Endringer kan skyldes handler eller endringer i aksjekurser.
| Verdipapirer | Aksjer (MM) |
Verdi (MM$) |
Portefølje % | ΔPortefølje % |
|---|---|---|---|---|
| 0,00 | 0,00 | −99,5274 | ||
| 0,01 | 1,82 | 1,1119 | −0,3234 | |
| 0,00 | 1,80 | 1,1037 | −0,2675 | |
| 0,09 | 2,05 | 1,2543 | −0,2633 | |
| 0,00 | 1,75 | 1,0700 | −0,2580 | |
| 0,01 | 1,89 | 1,1584 | −0,2244 | |
| 0,02 | 1,79 | 1,0953 | −0,2238 | |
| 0,02 | 1,74 | 1,0667 | −0,2117 | |
| 0,06 | 1,15 | 0,7052 | −0,2063 | |
| 0,04 | 1,34 | 0,8208 | −0,1919 |
13F- og Fondsarkiveringer
Dette skjemaet ble sendt inn den 2025-08-13 for rapporteringsperioden 2025-06-30. Klikk på lenkeikonet for å se hele transaksjonshistorikken.
Oppgradere for å låse opp premiedata og eksportere til Excel![]() .
.
| Verdipapirer | Type | Gjennomsnittlig aksjekurs | Aksjer (MM) |
ΔAksjer (%) |
ΔAksjer (%) |
Verdi ($MM) |
Portefølje (%) |
ΔPortefølje (%) |
|
|---|---|---|---|---|---|---|---|---|---|
| TTMI / TTM Technologies, Inc. | 0,08 | −0,71 | 3,33 | 97,62 | 2,0368 | 0,8155 | |||
| AMD / Advanced Micro Devices, Inc. | 0,02 | −0,71 | 2,69 | 37,16 | 1,6467 | 0,2239 | |||
| COMM / CommScope Holding Company, Inc. | 0,32 | −0,71 | 2,65 | 54,83 | 1,6195 | 0,3801 | |||
| CRWD / CrowdStrike Holdings, Inc. | 0,01 | −0,69 | 2,63 | 43,46 | 1,6121 | 0,2806 | |||
| NVDA / NVIDIA Corporation | 0,02 | −0,70 | 2,63 | 44,80 | 1,6119 | 0,2925 | |||
| ALAB / Astera Labs, Inc. | 0,03 | −0,71 | 2,58 | 50,50 | 1,5812 | 0,3360 | |||
| FSLR / First Solar, Inc. | 0,01 | −0,71 | 2,42 | 30,04 | 1,4808 | 0,1313 | |||
| DELL / Dell Technologies Inc. | 0,02 | −0,71 | 2,38 | 33,56 | 1,4542 | 0,1641 | |||
| CDNS / Cadence Design Systems, Inc. | 0,01 | −0,70 | 2,36 | 20,31 | 1,4469 | 0,0220 | |||
| SMTC / Semtech Corporation | 0,05 | −0,71 | 2,35 | 30,27 | 1,4384 | 0,1303 | |||
| ITRI / Itron, Inc. | 0,02 | −0,71 | 2,30 | 24,78 | 1,4051 | 0,0707 | |||
| ACLS / Axcelis Technologies, Inc. | 0,03 | −0,71 | 2,23 | 39,35 | 1,3654 | 0,2041 | |||
| PAL / Proficient Auto Logistics, Inc. | 0,31 | 2,22 | 1,3614 | 1,3614 | |||||
| AMAT / Applied Materials, Inc. | 0,01 | −0,70 | 2,22 | 25,30 | 1,3580 | 0,0735 | |||
| VRSN / VeriSign, Inc. | 0,01 | −0,71 | 2,19 | 12,98 | 1,3424 | −0,0657 | |||
| SNPS / Synopsys, Inc. | 0,00 | −0,71 | 2,14 | 18,73 | 1,3115 | 0,0023 | |||
| NOW / ServiceNow, Inc. | 0,00 | −0,67 | 2,13 | 28,32 | 1,3002 | 0,0991 | |||
| TEL / TE Connectivity plc | 0,01 | −0,71 | 2,09 | 18,56 | 1,2784 | 0,0003 | |||
| PANW / Palo Alto Networks, Inc. | 0,01 | −0,70 | 2,09 | 19,11 | 1,2777 | 0,0064 | |||
| INTC / Intel Corporation | 0,09 | −0,71 | 2,05 | −2,05 | 1,2543 | −0,2633 | |||
| QLYS / Qualys, Inc. | 0,01 | −0,71 | 2,01 | 12,69 | 1,2280 | −0,0636 | |||
| SGH / SMART Global Holdings, Inc. | 0,10 | −0,71 | 1,99 | 13,21 | 1,2169 | −0,0564 | |||
| FFIV / F5, Inc. | 0,01 | −0,69 | 1,93 | 9,76 | 1,1839 | −0,0940 | |||
| ASTS / AST SpaceMobile, Inc. | 0,04 | −0,71 | 1,92 | 104,03 | 1,1777 | 0,4938 | |||
| GDDY / GoDaddy Inc. | 0,01 | −0,70 | 1,89 | −0,73 | 1,1584 | −0,2244 | |||
| NFLX / Netflix, Inc. | 0,00 | −0,71 | 1,88 | 42,64 | 1,1504 | 0,1945 | |||
| SPOT / Spotify Technology S.A. | 0,00 | −0,65 | 1,87 | 38,64 | 1,1465 | 0,1664 | |||
| AAPL / Apple Inc. | 0,01 | −0,63 | 1,82 | −8,19 | 1,1119 | −0,3234 | |||
| CRUS / Cirrus Logic, Inc. | 0,02 | −0,71 | 1,81 | 3,85 | 1,1074 | −0,1558 | |||
| MSI / Motorola Solutions, Inc. | 0,00 | −0,69 | 1,80 | −4,65 | 1,1037 | −0,2675 | |||
| AKAM / Akamai Technologies, Inc. | 0,02 | −0,71 | 1,79 | −1,59 | 1,0953 | −0,2238 | |||
| CRM / Salesforce, Inc. | 0,01 | −0,71 | 1,77 | 0,91 | 1,0807 | −0,1884 | |||
| ROP / Roper Technologies, Inc. | 0,00 | −0,71 | 1,75 | −4,53 | 1,0700 | −0,2580 | |||
| BAH / Booz Allen Hamilton Holding Corporation | 0,02 | −0,71 | 1,74 | −1,13 | 1,0667 | −0,2117 | |||
| EA / Electronic Arts Inc. | 0,01 | −0,71 | 1,61 | 9,74 | 0,9858 | −0,0787 | |||
| APP / AppLovin Corporation | 0,00 | −0,70 | 1,58 | 31,17 | 0,9661 | 0,0936 | |||
| META / Meta Platforms, Inc. | 0,00 | −0,66 | 1,56 | 27,26 | 0,9570 | 0,0657 | |||
| DIS / The Walt Disney Company | 0,01 | −1,14 | 1,55 | 24,26 | 0,9497 | 0,0438 | |||
| IDCC / InterDigital, Inc. | 0,01 | −0,71 | 1,51 | 7,69 | 0,9255 | −0,0928 | |||
| T / AT&T Inc. | 0,05 | −0,71 | 1,48 | 1,58 | 0,9066 | −0,1506 | |||
| CMCSA / Comcast Corporation | 0,04 | −0,71 | 1,34 | −3,94 | 0,8208 | −0,1919 | |||
| WBTN / WEBTOON Entertainment Inc. | 0,15 | −0,71 | 1,33 | 17,49 | 0,8144 | −0,0066 | |||
| LUMN / Lumen Technologies, Inc. | 0,28 | −0,71 | 1,21 | 11,00 | 0,7411 | −0,0504 | |||
| CVNA / Carvana Co. | 0,00 | −0,68 | 1,18 | 60,16 | 0,7235 | 0,1879 | |||
| DJT / Trump Media & Technology Group Corp. | 0,06 | −0,71 | 1,15 | −8,35 | 0,7052 | −0,2063 | |||
| SIG / Signet Jewelers Limited | 0,01 | −0,71 | 1,14 | 36,12 | 0,6967 | 0,0899 | |||
| FIVE / Five Below, Inc. | 0,01 | −0,70 | 1,08 | 73,95 | 0,6623 | 0,2110 | |||
| RCL / Royal Caribbean Cruises Ltd. | 0,00 | −0,70 | 0,98 | 51,39 | 0,5986 | 0,1300 | |||
| ULTA / Ulta Beauty, Inc. | 0,00 | −0,69 | 0,94 | 26,75 | 0,5774 | 0,0377 | |||
| WWW / Wolverine World Wide, Inc. | 0,05 | −0,71 | 0,92 | 30,11 | 0,5606 | 0,0496 | |||
| CAKE / The Cheesecake Factory Incorporated | 0,01 | −0,71 | 0,89 | 27,83 | 0,5458 | 0,0400 | |||
| EAT / Brinker International, Inc. | 0,00 | −0,70 | 0,87 | 20,14 | 0,5294 | 0,0073 | |||
| TSLA / Tesla, Inc. | 0,00 | −2,30 | 0,85 | 19,86 | 0,5207 | 0,0055 | |||
| DAN / Dana Incorporated | 0,05 | −0,71 | 0,85 | 27,75 | 0,5186 | 0,0376 | |||
| ALV / Autoliv, Inc. | 0,01 | −0,69 | 0,80 | 25,67 | 0,4917 | 0,0280 | |||
| RL / Ralph Lauren Corporation | 0,00 | −0,69 | 0,79 | 23,43 | 0,4806 | 0,0191 | |||
| WHR / Whirlpool Corporation | 0,01 | −0,70 | 0,78 | 11,73 | 0,4780 | −0,0288 | |||
| AMZN / Amazon.com, Inc. | 0,00 | −0,69 | 0,76 | 14,59 | 0,4663 | −0,0161 | |||
| WYNN / Wynn Resorts, Limited | 0,01 | −0,71 | 0,74 | 11,50 | 0,4511 | −0,0287 | |||
| ETSY / Etsy, Inc. | 0,01 | −0,70 | 0,73 | 5,46 | 0,4497 | −0,0550 | |||
| APTV / Aptiv PLC | 0,01 | −0,70 | 0,73 | 13,86 | 0,4476 | −0,0182 | |||
| SBH / Sally Beauty Holdings, Inc. | 0,08 | −0,71 | 0,72 | 1,69 | 0,4436 | −0,0726 | |||
| CROX / Crocs, Inc. | 0,01 | −0,70 | 0,72 | −5,29 | 0,4386 | −0,1102 | |||
| MAR / Marriott International, Inc. | 0,00 | −0,69 | 0,71 | 13,96 | 0,4348 | −0,0175 | |||
| ORLY / O'Reilly Automotive, Inc. | 0,01 | 1 389,41 | 0,71 | −6,21 | 0,4345 | −0,1149 | |||
| BURL / Burlington Stores, Inc. | 0,00 | −0,66 | 0,70 | −3,07 | 0,4256 | −0,0945 | |||
| PVH / PVH Corp. | 0,01 | −0,71 | 0,69 | 5,37 | 0,4209 | −0,0524 | |||
| NCLH / Norwegian Cruise Line Holdings Ltd. | 0,03 | −0,71 | 0,68 | 6,23 | 0,4175 | −0,0483 | |||
| ANF / Abercrombie & Fitch Co. | 0,01 | −0,70 | 0,68 | 7,59 | 0,4166 | −0,0416 | |||
| LVS / Las Vegas Sands Corp. | 0,02 | −0,71 | 0,67 | 11,87 | 0,4095 | −0,0244 | |||
| DPZ / Domino's Pizza, Inc. | 0,00 | −0,68 | 0,66 | −2,66 | 0,4036 | −0,0873 | |||
| MCD / McDonald's Corporation | 0,00 | −0,70 | 0,66 | −7,18 | 0,4035 | −0,1113 | |||
| GRMN / Garmin Ltd. | 0,00 | −0,69 | 0,66 | −4,64 | 0,4032 | −0,0972 | |||
| YETI / YETI Holdings, Inc. | 0,02 | −0,71 | 0,65 | −5,50 | 0,3998 | −0,1012 | |||
| ROST / Ross Stores, Inc. | 0,01 | −0,70 | 0,65 | −0,91 | 0,3998 | −0,0780 | |||
| DKS / DICK'S Sporting Goods, Inc. | 0,00 | −0,67 | 0,65 | −2,41 | 0,3965 | −0,0854 | |||
| LOW / Lowe's Companies, Inc. | 0,00 | −0,69 | 0,64 | −5,59 | 0,3931 | −0,0999 | |||
| LNW / Light & Wonder, Inc. | 0,01 | −0,71 | 0,64 | 10,31 | 0,3930 | −0,0290 | |||
| CHDN / Churchill Downs Incorporated | 0,01 | −0,71 | 0,63 | −9,68 | 0,3825 | −0,1194 | |||
| MELI / MercadoLibre, Inc. | 0,00 | 0,00 | 0,62 | 34,05 | 0,3806 | 0,0440 | |||
| GIII / G-III Apparel Group, Ltd. | 0,03 | −0,71 | 0,62 | −18,66 | 0,3790 | −0,1732 | |||
| COIN / Coinbase Global, Inc. | 0,00 | −0,68 | 0,62 | 101,97 | 0,3774 | 0,1562 | |||
| DECK / Deckers Outdoor Corporation | 0,01 | −0,70 | 0,55 | −8,44 | 0,3387 | −0,0997 | |||
| HBI / Hanesbrands Inc. | 0,12 | −0,71 | 0,54 | −21,14 | 0,3312 | −0,1667 | |||
| BG / Bunge Global SA | 0,01 | −0,69 | 0,54 | 4,29 | 0,3275 | −0,0444 | |||
| SPNT / SiriusPoint Ltd. | 0,03 | −0,71 | 0,51 | 16,97 | 0,3124 | −0,0037 | |||
| WBA / Walgreens Boots Alliance, Inc. | 0,04 | −0,71 | 0,51 | 2,00 | 0,3123 | −0,0503 | |||
| COOP / Mr. Cooper Group Inc. | 0,00 | −0,70 | 0,51 | 24,02 | 0,3099 | 0,0135 | |||
| CVS / CVS Health Corporation | 0,01 | −0,69 | 0,50 | 1,22 | 0,3037 | −0,0522 | |||
| LULU / lululemon athletica inc. | 0,00 | −0,69 | 0,48 | −16,61 | 0,2950 | −0,1243 | |||
| CL / Colgate-Palmolive Company | 0,01 | −0,70 | 0,46 | −3,75 | 0,2830 | −0,0651 | |||
| ATEN / A10 Networks, Inc. | 0,02 | 0,00 | 0,46 | 18,35 | 0,2806 | −0,0001 | |||
| GSCE / GS Connect S&P GSCI Enhanced Commodity Total Return ETN | 0,00 | −0,62 | 0,46 | 28,90 | 0,2785 | 0,0222 | |||
| COST / Costco Wholesale Corporation | 0,00 | −0,43 | 0,45 | 4,13 | 0,2780 | −0,0381 | |||
| DOLE / Dole plc | 0,03 | −0,71 | 0,45 | −3,82 | 0,2774 | −0,0645 | |||
| OS / OneStream, Inc. | 0,02 | −0,71 | 0,45 | 31,49 | 0,2766 | 0,0277 | |||
| AX / Axos Financial, Inc. | 0,01 | −0,68 | 0,44 | 16,93 | 0,2710 | −0,0033 | |||
| OKLO / Oklo Inc. | 0,01 | 0,44 | 0,2667 | 0,2667 | |||||
| STZ / Constellation Brands, Inc. | 0,00 | −0,67 | 0,43 | −11,97 | 0,2658 | −0,0919 | |||
| NATL / NCR Atleos Corporation | 0,02 | −0,71 | 0,43 | 7,25 | 0,2629 | −0,0272 | |||
| NRG / NRG Energy, Inc. | 0,00 | −0,67 | 0,43 | 67,19 | 0,2624 | 0,0763 | |||
| AER / AerCap Holdings N.V. | 0,00 | −0,70 | 0,43 | 13,53 | 0,2624 | −0,0110 | |||
| XYZ / Block, Inc. | 0,01 | −0,70 | 0,43 | 24,27 | 0,2604 | 0,0119 | |||
| MKTX / MarketAxess Holdings Inc. | 0,00 | −0,63 | 0,42 | 2,66 | 0,2596 | −0,0402 | |||
| AXP / American Express Company | 0,00 | −0,60 | 0,42 | 17,88 | 0,2588 | −0,0014 | |||
| BFH / Bread Financial Holdings, Inc. | 0,01 | −0,70 | 0,42 | 13,51 | 0,2571 | −0,0119 | |||
| KKR / KKR & Co. Inc. | 0,00 | −0,70 | 0,41 | 14,36 | 0,2537 | −0,0094 | |||
| CHD / Church & Dwight Co., Inc. | 0,00 | −0,70 | 0,41 | −13,32 | 0,2509 | −0,0920 | |||
| BLK / BlackRock, Inc. | 0,00 | −0,51 | 0,41 | 10,24 | 0,2504 | −0,0186 | |||
| PRG / PROG Holdings, Inc. | 0,01 | −0,71 | 0,41 | 9,68 | 0,2499 | −0,0204 | |||
| FIHL / Fidelis Insurance Holdings Limited | 0,02 | −0,71 | 0,41 | 1,75 | 0,2493 | −0,0414 | |||
| CBOE / Cboe Global Markets, Inc. | 0,00 | −0,69 | 0,41 | 2,53 | 0,2479 | −0,0391 | |||
| TGT / Target Corporation | 0,00 | −0,68 | 0,40 | −6,05 | 0,2474 | −0,0648 | |||
| PEP / PepsiCo, Inc. | 0,00 | −0,65 | 0,40 | −12,64 | 0,2458 | −0,0871 | |||
| ICE / Intercontinental Exchange, Inc. | 0,00 | −0,64 | 0,40 | 5,56 | 0,2447 | −0,0296 | |||
| HIG / The Hartford Insurance Group, Inc. | 0,00 | −0,69 | 0,40 | 1,79 | 0,2444 | −0,0400 | |||
| UNFI / United Natural Foods, Inc. | 0,02 | −0,71 | 0,40 | −15,60 | 0,2421 | −0,0974 | |||
| MCO / Moody's Corporation | 0,00 | −0,51 | 0,40 | 7,34 | 0,2418 | −0,0255 | |||
| LC / LendingClub Corporation | 0,03 | −0,71 | 0,39 | 15,77 | 0,2385 | −0,0057 | |||
| NAVI / Navient Corporation | 0,03 | −0,71 | 0,39 | 10,83 | 0,2383 | −0,0164 | |||
| CINF / Cincinnati Financial Corporation | 0,00 | −0,69 | 0,39 | 0,26 | 0,2375 | −0,0436 | |||
| APO / Apollo Global Management, Inc. | 0,00 | −0,66 | 0,39 | 2,94 | 0,2356 | −0,0356 | |||
| TRV / The Travelers Companies, Inc. | 0,00 | −0,69 | 0,38 | 0,52 | 0,2352 | −0,0422 | |||
| SPGI / S&P Global Inc. | 0,00 | −0,55 | 0,38 | 3,25 | 0,2333 | −0,0345 | |||
| MSCI / MSCI Inc. | 0,00 | −0,60 | 0,38 | 1,33 | 0,2333 | −0,0394 | |||
| GEV / GE Vernova Inc. | 0,00 | −0,55 | 0,38 | 71,95 | 0,2331 | 0,0729 | |||
| SIGI / Selective Insurance Group, Inc. | 0,00 | −0,68 | 0,38 | −5,94 | 0,2329 | −0,0606 | |||
| V / Visa Inc. | 0,00 | −0,56 | 0,38 | 0,80 | 0,2311 | −0,0407 | |||
| TAP.A / Molson Coors Beverage Company | 0,01 | −0,71 | 0,38 | −21,67 | 0,2306 | −0,1177 | |||
| ALL / The Allstate Corporation | 0,00 | −0,64 | 0,38 | −3,34 | 0,2302 | −0,0522 | |||
| BR / Broadridge Financial Solutions, Inc. | 0,00 | −0,65 | 0,37 | −0,53 | 0,2281 | −0,0433 | |||
| CEG / Constellation Energy Corporation | 0,00 | −0,69 | 0,37 | 59,48 | 0,2265 | 0,0577 | |||
| TPC / Tutor Perini Corporation | 0,01 | 0,37 | 0,2256 | 0,2256 | |||||
| ACGL / Arch Capital Group Ltd. | 0,00 | −0,69 | 0,37 | −5,88 | 0,2253 | −0,0587 | |||
| RNR / RenaissanceRe Holdings Ltd. | 0,00 | −0,66 | 0,36 | 0,55 | 0,2228 | −0,0398 | |||
| TROW / T. Rowe Price Group, Inc. | 0,00 | −0,69 | 0,36 | 4,31 | 0,2221 | −0,0302 | |||
| WEX / WEX Inc. | 0,00 | −0,65 | 0,36 | −7,20 | 0,2214 | −0,0608 | |||
| PRU / Prudential Financial, Inc. | 0,00 | −0,71 | 0,36 | −4,26 | 0,2203 | −0,0530 | |||
| AIZ / Assurant, Inc. | 0,00 | −0,66 | 0,36 | −6,51 | 0,2199 | −0,0587 | |||
| HASI / HA Sustainable Infrastructure Capital, Inc. | 0,01 | −0,70 | 0,36 | −8,67 | 0,2193 | −0,0655 | |||
| BHF / Brighthouse Financial, Inc. | 0,01 | −0,69 | 0,36 | −7,97 | 0,2192 | −0,0628 | |||
| PGR / The Progressive Corporation | 0,00 | −0,59 | 0,36 | −6,05 | 0,2185 | −0,0577 | |||
| HLNE / Hamilton Lane Incorporated | 0,00 | −0,64 | 0,36 | −4,83 | 0,2173 | −0,0538 | |||
| VRT / Vertiv Holdings Co | 0,00 | 0,35 | 0,2159 | 0,2159 | |||||
| FIX / Comfort Systems USA, Inc. | 0,00 | −0,61 | 0,35 | 65,26 | 0,2156 | 0,0611 | |||
| EG / Everest Group, Ltd. | 0,00 | −0,58 | 0,35 | −6,90 | 0,2150 | −0,0589 | |||
| DY / Dycom Industries, Inc. | 0,00 | −0,70 | 0,35 | 59,63 | 0,2134 | 0,0547 | |||
| BRO / Brown & Brown, Inc. | 0,00 | −0,70 | 0,35 | −11,54 | 0,2113 | −0,0716 | |||
| WTW / Willis Towers Watson Public Limited Company | 0,00 | −0,71 | 0,34 | −10,00 | 0,2097 | −0,0662 | |||
| MMC / Marsh & McLennan Companies, Inc. | 0,00 | −0,64 | 0,34 | −10,97 | 0,2091 | −0,0692 | |||
| PWR / Quanta Services, Inc. | 0,00 | −0,66 | 0,34 | 47,83 | 0,2082 | 0,0413 | |||
| LINE / Lineage, Inc. | 0,01 | −0,70 | 0,34 | −26,21 | 0,2051 | −0,1246 | |||
| PMT / PennyMac Mortgage Investment Trust | 0,03 | −0,71 | 0,33 | −12,83 | 0,2038 | −0,0732 | |||
| ENR / Energizer Holdings, Inc. | 0,02 | −0,71 | 0,32 | −33,13 | 0,1979 | −0,1526 | |||
| SLNO / Soleno Therapeutics, Inc. | 0,00 | −0,68 | 0,32 | 16,42 | 0,1954 | −0,0034 | |||
| EME / EMCOR Group, Inc. | 0,00 | −0,69 | 0,31 | 43,66 | 0,1875 | 0,0329 | |||
| FLR / Fluor Corporation | 0,01 | −0,70 | 0,31 | 42,33 | 0,1874 | 0,0312 | |||
| ACHR / Archer Aviation Inc. | 0,03 | −0,71 | 0,31 | 51,49 | 0,1874 | 0,0408 | |||
| PEGA / Pegasystems Inc. | 0,01 | 0,30 | 0,1843 | 0,1843 | |||||
| ULS / UL Solutions Inc. | 0,00 | −0,68 | 0,30 | 28,45 | 0,1829 | 0,0140 | |||
| GPN / Global Payments Inc. | 0,00 | −0,70 | 0,30 | −18,96 | 0,1811 | −0,0833 | |||
| WWD / Woodward, Inc. | 0,00 | −0,66 | 0,30 | 33,48 | 0,1807 | 0,0202 | |||
| BV / BrightView Holdings, Inc. | 0,02 | −0,71 | 0,29 | 28,63 | 0,1788 | 0,0143 | |||
| FI / Fiserv, Inc. | 0,00 | −0,60 | 0,29 | −22,49 | 0,1754 | −0,0924 | |||
| BA / The Boeing Company | 0,00 | −0,58 | 0,29 | 22,32 | 0,1745 | 0,0052 | |||
| NNE / NANO Nuclear Energy Inc. | 0,01 | −0,71 | 0,28 | 29,63 | 0,1717 | 0,0145 | |||
| TT / Trane Technologies plc | 0,00 | −0,62 | 0,28 | 29,03 | 0,1716 | 0,0140 | |||
| INTU / Intuit Inc. | 0,00 | −0,56 | 0,28 | 28,11 | 0,1701 | 0,0121 | |||
| HII / Huntington Ingalls Industries, Inc. | 0,00 | −0,70 | 0,27 | 17,60 | 0,1677 | −0,0014 | |||
| ES / Eversource Energy | 0,00 | −0,71 | 0,27 | 1,90 | 0,1641 | −0,0271 | |||
| URI / United Rentals, Inc. | 0,00 | −0,57 | 0,26 | 19,63 | 0,1609 | 0,0014 | |||
| MRC / MRC Global Inc. | 0,02 | −0,71 | 0,26 | 18,55 | 0,1606 | 0,0001 | |||
| TEX / Terex Corporation | 0,01 | −0,71 | 0,26 | 22,75 | 0,1590 | 0,0055 | |||
| ATO / Atmos Energy Corporation | 0,00 | −0,71 | 0,26 | −0,77 | 0,1580 | −0,0311 | |||
| OSK / Oshkosh Corporation | 0,00 | −0,70 | 0,26 | 19,53 | 0,1577 | 0,0018 | |||
| SO / The Southern Company | 0,00 | −0,71 | 0,26 | −0,78 | 0,1571 | −0,0306 | |||
| SWX / Southwest Gas Holdings, Inc. | 0,00 | −0,69 | 0,26 | 2,81 | 0,1568 | −0,0238 | |||
| DUK / Duke Energy Corporation | 0,00 | −0,64 | 0,26 | −4,14 | 0,1566 | −0,0364 | |||
| HUBB / Hubbell Incorporated | 0,00 | −0,64 | 0,25 | 22,71 | 0,1559 | 0,0053 | |||
| WAB / Westinghouse Air Brake Technologies Corporation | 0,00 | −0,65 | 0,25 | 14,93 | 0,1555 | −0,0052 | |||
| RDFN / Redfin Corporation | 0,02 | −0,71 | 0,25 | 21,05 | 0,1548 | 0,0028 | |||
| MANH / Manhattan Associates, Inc. | 0,00 | −0,62 | 0,25 | 13,06 | 0,1541 | −0,0069 | |||
| HE / Hawaiian Electric Industries, Inc. | 0,02 | −0,71 | 0,25 | −3,46 | 0,1538 | −0,0353 | |||
| DTE / DTE Energy Company | 0,00 | −0,63 | 0,25 | −4,94 | 0,1533 | −0,0375 | |||
| CAT / Caterpillar Inc. | 0,00 | −0,62 | 0,25 | 17,37 | 0,1530 | −0,0020 | |||
| AES / The AES Corporation | 0,02 | −0,71 | 0,24 | −15,86 | 0,1497 | −0,0612 | |||
| SKYW / SkyWest, Inc. | 0,00 | −0,67 | 0,24 | 17,31 | 0,1494 | −0,0018 | |||
| GNRC / Generac Holdings Inc. | 0,00 | −0,70 | 0,24 | 11,98 | 0,1492 | −0,0082 | |||
| XPO / XPO, Inc. | 0,00 | −0,62 | 0,24 | 16,83 | 0,1490 | −0,0023 | |||
| GRAL / GRAIL, Inc. | 0,00 | 0,24 | 0,1487 | 0,1487 | |||||
| PH / Parker-Hannifin Corporation | 0,00 | −0,57 | 0,24 | 14,22 | 0,1479 | −0,0055 | |||
| TDW / Tidewater Inc. | 0,01 | −0,69 | 0,24 | 8,11 | 0,1473 | −0,0137 | |||
| HON / Honeywell International Inc. | 0,00 | −0,58 | 0,24 | 9,17 | 0,1462 | −0,0122 | |||
| THC / Tenet Healthcare Corporation | 0,00 | 0,23 | 0,1427 | 0,1427 | |||||
| PBI / Pitney Bowes Inc. | 0,02 | −0,71 | 0,23 | 19,59 | 0,1425 | 0,0014 | |||
| BLD / TopBuild Corp. | 0,00 | −0,56 | 0,23 | 5,48 | 0,1416 | −0,0173 | |||
| EFX / Equifax Inc. | 0,00 | −0,67 | 0,23 | 5,96 | 0,1416 | −0,0170 | |||
| PCT / PureCycle Technologies, Inc. | 0,02 | −0,71 | 0,23 | 96,58 | 0,1411 | 0,0560 | |||
| APGE / Apogee Therapeutics, Inc. | 0,01 | 0,23 | 0,1404 | 0,1404 | |||||
| GFF / Griffon Corporation | 0,00 | −0,69 | 0,23 | 0,44 | 0,1394 | −0,0249 | |||
| RSG / Republic Services, Inc. | 0,00 | −0,65 | 0,23 | 0,90 | 0,1381 | −0,0236 | |||
| VRSK / Verisk Analytics, Inc. | 0,00 | −0,55 | 0,22 | 4,19 | 0,1372 | −0,0190 | |||
| CAH / Cardinal Health, Inc. | 0,00 | 0,22 | 0,1353 | 0,1353 | |||||
| GTLS / Chart Industries, Inc. | 0,00 | 0,22 | 0,1349 | 0,1349 | |||||
| TEM / Tempus AI, Inc. | 0,00 | 0,22 | 0,1325 | 0,1325 | |||||
| XYL / Xylem Inc. | 0,00 | −0,71 | 0,22 | 7,46 | 0,1324 | −0,0135 | |||
| CRS / Carpenter Technology Corporation | 0,00 | 0,21 | 0,1299 | 0,1299 | |||||
| AOS / A. O. Smith Corporation | 0,00 | −0,68 | 0,21 | −0,47 | 0,1294 | −0,0245 | |||
| DOCU / DocuSign, Inc. | 0,00 | −0,66 | 0,21 | −4,98 | 0,1291 | −0,0318 | |||
| DAY / Dayforce Inc. | 0,00 | −0,68 | 0,21 | −5,41 | 0,1286 | −0,0330 | |||
| AKRO / Akero Therapeutics, Inc. | 0,00 | 0,21 | 0,1280 | 0,1280 | |||||
| IDXX / IDEXX Laboratories, Inc. | 0,00 | 0,21 | 0,1270 | 0,1270 | |||||
| PODD / Insulet Corporation | 0,00 | 0,20 | 0,1230 | 0,1230 | |||||
| ETNB / 89bio, Inc. | 0,02 | −0,71 | 0,20 | 34,25 | 0,1201 | 0,0140 | |||
| BKD / Brookdale Senior Living Inc. | 0,02 | −0,71 | 0,17 | 9,87 | 0,1027 | −0,0075 | |||
| MD / Pediatrix Medical Group, Inc. | 0,01 | −0,71 | 0,16 | −1,80 | 0,1006 | −0,0206 | |||
| SHC / Sotera Health Company | 0,01 | −0,70 | 0,16 | −5,33 | 0,0983 | −0,0247 | |||
| STGW / Stagwell Inc. | 0,04 | −0,71 | 0,16 | −26,17 | 0,0967 | −0,0585 | |||
| JBLU / JetBlue Airways Corporation | 0,03 | −0,71 | 0,15 | −13,10 | 0,0897 | −0,0323 | |||
| DYN / Dyne Therapeutics, Inc. | 0,01 | −0,70 | 0,14 | −9,74 | 0,0854 | −0,0266 | |||
| REAX / The Real Brokerage Inc. | 0,03 | −0,71 | 0,14 | 10,48 | 0,0843 | −0,0063 | |||
| REPL / Replimune Group, Inc. | 0,01 | −0,71 | 0,13 | −5,71 | 0,0812 | −0,0205 | |||
| EXPI / eXp World Holdings, Inc. | 0,01 | −0,71 | 0,13 | −7,75 | 0,0805 | −0,0227 | |||
| CLOV / Clover Health Investments, Corp. | 0,05 | −0,71 | 0,13 | −22,70 | 0,0772 | −0,0414 | |||
| PK / Park Hotels & Resorts Inc. | 0,01 | −0,71 | 0,13 | −5,30 | 0,0770 | −0,0189 | |||
| UNIT / Uniti Group Inc. | 0,03 | −0,71 | 0,12 | −14,89 | 0,0736 | −0,0289 | |||
| ULCC / Frontier Group Holdings, Inc. | 0,03 | −0,71 | 0,12 | −16,90 | 0,0725 | −0,0309 | |||
| DAWN / Day One Biopharmaceuticals, Inc. | 0,02 | −0,71 | 0,12 | −19,01 | 0,0709 | −0,0323 | |||
| SNDX / Syndax Pharmaceuticals, Inc. | 0,01 | −0,70 | 0,11 | −24,67 | 0,0696 | −0,0393 | |||
| NEXT / NextDecade Corporation | 0,01 | −0,71 | 0,10 | 14,61 | 0,0626 | −0,0026 | |||
| COMP / Compass, Inc. | 0,02 | −0,70 | 0,10 | −28,37 | 0,0619 | −0,0408 | |||
| FDX / FedEx Corporation | 0,00 | −100,00 | 0,00 | −100,00 | −0,1532 | ||||
| FDX / FedEx Corporation | 0,00 | −100,00 | 0,00 | −100,00 | −0,1532 | ||||
| OPTZ / Advisor Managed Portfolios - Optimize Strategy Index ETF | 0,00 | −100,00 | 0,00 | −100,00 | −99,5274 |