Grunnleggende statistikk
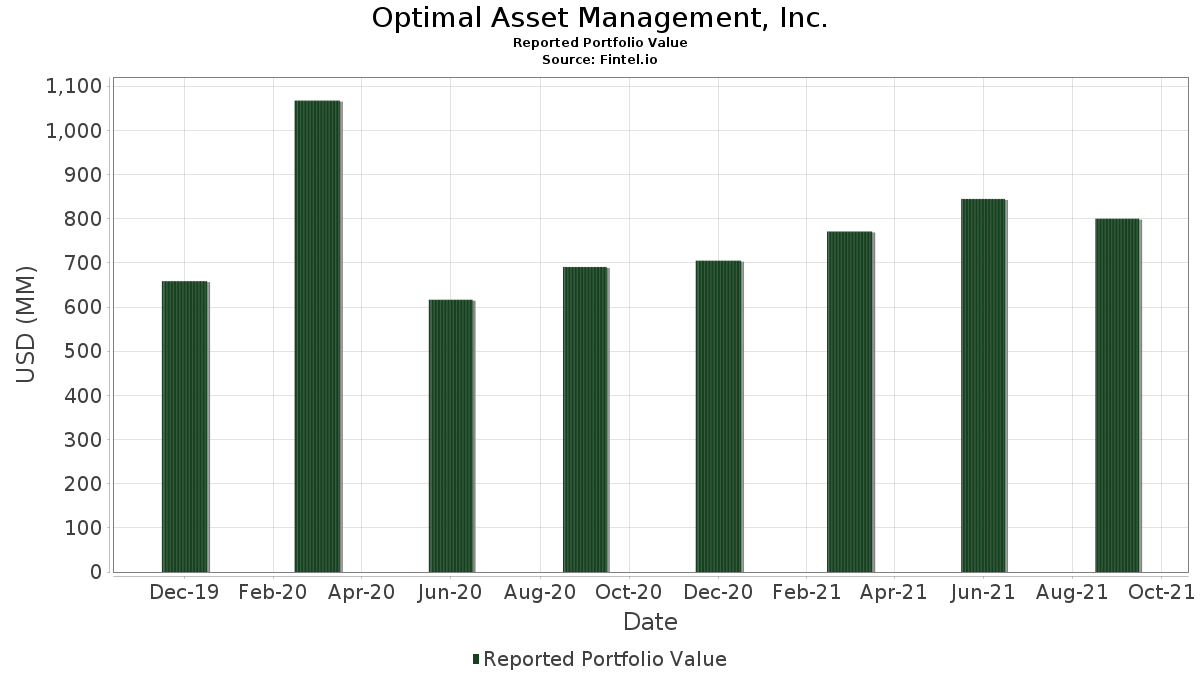
| Porteføljeverdi | $ 800 025 000 |
| Nåværende posisjoner | 347 |
Siste beholdninger, prestasjoner, forvaltet kapital (fra 13F, 13D)
Optimal Asset Management, Inc. har oppgitt 347 totale beholdninger i sine siste SEC-arkiveringer. Siste porteføljeverdi er beregnet til 800 025 000 USD. Faktisk forvaltet kapital (AUM) er denne verdien pluss kontanter (som ikke er oppgitt). Optimal Asset Management, Inc.s største beholdninger er Walmart Inc. (US:WMT) , Fortinet, Inc. (US:FTNT) , Omnicom Group Inc. (US:OMC) , Adobe Inc. (US:ADBE) , and Broadridge Financial Solutions, Inc. (US:BR) . Optimal Asset Management, Inc.s nye posisjoner inkluderer Target Corporation (US:TGT) , AstraZeneca PLC - Depositary Receipt (Common Stock) (US:AZN) , Analog Devices, Inc. (US:ADI) , Organon & Co. (US:OGN) , and .
De største økningene dette kvartalet
Vi bruker endringen i porteføljeallokeringen fordi dette er det mest meningsfulle målet. Endringer kan skyldes handler eller endringer i aksjekursene.
| Verdipapirer | Aksjer (MM) |
Verdi (MM$) |
Portefølje % | ΔPortefølje % |
|---|---|---|---|---|
| 0,03 | 6,85 | 0,8558 | 0,8558 | |
| 0,03 | 9,80 | 1,2247 | 0,2808 | |
| 0,04 | 2,13 | 0,2665 | 0,2665 | |
| 0,01 | 5,77 | 0,7212 | 0,2214 | |
| 0,09 | 8,15 | 1,0193 | 0,1577 | |
| 0,00 | 7,17 | 0,8961 | 0,1519 | |
| 0,01 | 3,97 | 0,4962 | 0,1303 | |
| 0,01 | 5,76 | 0,7196 | 0,1190 | |
| 0,04 | 6,31 | 0,7886 | 0,1111 | |
| 0,01 | 5,09 | 0,6357 | 0,1091 |
De største reduksjonene dette kvartalet
Vi bruker endringen i porteføljeallokeringen fordi dette er det mest meningsfulle målet. Endringer kan skyldes handler eller endringer i aksjekurser.
| Verdipapirer | Aksjer (MM) |
Verdi (MM$) |
Portefølje % | ΔPortefølje % |
|---|---|---|---|---|
| 0,00 | 0,00 | −0,9579 | ||
| 0,00 | 0,00 | −0,7811 | ||
| 0,00 | 0,00 | −0,5316 | ||
| 0,00 | 0,00 | −0,4234 | ||
| 0,00 | 0,00 | −0,3633 | ||
| 0,04 | 2,21 | 0,2767 | −0,2313 | |
| 0,03 | 1,37 | 0,1712 | −0,2066 | |
| 0,02 | 1,46 | 0,1824 | −0,1600 | |
| 0,02 | 1,36 | 0,1701 | −0,1426 | |
| 0,06 | 9,23 | 1,1533 | −0,1214 |
13F- og Fondsarkiveringer
Dette skjemaet ble sendt inn den 2021-11-15 for rapporteringsperioden 2021-09-30. Klikk på lenkeikonet for å se hele transaksjonshistorikken.
Oppgradere for å låse opp premiedata og eksportere til Excel![]() .
.
| Verdipapirer | Type | Gjennomsnittlig aksjekurs | Aksjer (MM) |
ΔAksjer (%) |
ΔAksjer (%) |
Verdi ($MM) |
Portefølje (%) |
ΔPortefølje (%) |
|
|---|---|---|---|---|---|---|---|---|---|
| WMT / Walmart Inc. | 0,08 | 0,18 | 11,15 | −0,99 | 1,3937 | 0,0607 | |||
| FTNT / Fortinet, Inc. | 0,03 | 0,22 | 9,80 | 22,87 | 1,2247 | 0,2808 | |||
| OMC / Omnicom Group Inc. | 0,13 | 0,17 | 9,77 | −9,26 | 1,2206 | −0,0533 | |||
| ADBE / Adobe Inc. | 0,02 | 0,11 | 9,74 | −1,59 | 1,2181 | 0,0459 | |||
| BR / Broadridge Financial Solutions, Inc. | 0,06 | 0,12 | 9,35 | 3,28 | 1,1682 | 0,0970 | |||
| QRVO / Qorvo, Inc. | 0,06 | 0,27 | 9,23 | −14,31 | 1,1533 | −0,1214 | |||
| TMUS / T-Mobile US, Inc. | 0,07 | 0,32 | 8,65 | −11,49 | 1,0810 | −0,0757 | |||
| CLX / The Clorox Company | 0,05 | 0,26 | 8,36 | −7,71 | 1,0443 | −0,0273 | |||
| LLY / Eli Lilly and Company | 0,04 | 0,11 | 8,30 | 0,78 | 1,0377 | 0,0625 | |||
| ORCL / Oracle Corporation | 0,09 | 0,09 | 8,15 | 12,03 | 1,0193 | 0,1577 | |||
| LBRDA / Liberty Broadband Corporation | 0,01 | 0,28 | 7,97 | 1,13 | 0,9960 | 0,0633 | |||
| AKAM / Akamai Technologies, Inc. | 0,07 | 0,32 | 7,64 | −10,01 | 0,9552 | −0,0500 | |||
| TYL / Tyler Technologies, Inc. | 0,02 | 0,26 | 7,47 | 1,65 | 0,9333 | 0,0637 | |||
| FISV / Fiserv, Inc. | 0,07 | 0,13 | 7,29 | 1,63 | 0,9115 | 0,0621 | |||
| AZO / AutoZone, Inc. | 0,00 | 0,21 | 7,17 | 14,03 | 0,8961 | 0,1519 | |||
| MSI / Motorola Solutions, Inc. | 0,03 | 0,13 | 7,00 | 7,27 | 0,8746 | 0,1024 | |||
| KEYS / Keysight Technologies, Inc. | 0,04 | 0,13 | 6,91 | 6,54 | 0,8636 | 0,0959 | |||
| TGT / Target Corporation | 0,03 | 6,85 | 0,8558 | 0,8558 | |||||
| T / AT&T Inc. | 0,25 | 0,16 | 6,78 | −6,00 | 0,8477 | −0,0064 | |||
| UPS / United Parcel Service, Inc. | 0,04 | 0,09 | 6,47 | −12,36 | 0,8092 | −0,0652 | |||
| DGX / Quest Diagnostics Incorporated | 0,04 | 0,12 | 6,31 | 10,24 | 0,7886 | 0,1111 | |||
| NVR / NVR, Inc. | 0,00 | 0,00 | 6,28 | −3,61 | 0,7850 | 0,0137 | |||
| BG / Bunge Global SA | 0,07 | 0,20 | 5,85 | 4,26 | 0,7309 | 0,0670 | |||
| PAYC / Paycom Software, Inc. | 0,01 | 0,19 | 5,77 | 36,67 | 0,7212 | 0,2214 | |||
| NOW / ServiceNow, Inc. | 0,01 | 0,19 | 5,76 | 13,46 | 0,7196 | 0,1190 | |||
| IDXX / IDEXX Laboratories, Inc. | 0,01 | 0,24 | 5,75 | −1,29 | 0,7189 | 0,0292 | |||
| NWSA / News Corporation | 0,24 | 0,29 | 5,69 | −8,43 | 0,7111 | −0,0244 | |||
| CTXS / Citrix Systems, Inc. | 0,05 | 0,12 | 5,64 | −8,33 | 0,7055 | −0,0234 | |||
| ATVI / Activision Blizzard Inc | 0,07 | 0,14 | 5,42 | −18,81 | 0,6779 | −0,1128 | |||
| MTD / Mettler-Toledo International Inc. | 0,00 | 0,23 | 5,39 | −0,35 | 0,6735 | 0,0334 | |||
| EA / Electronic Arts Inc. | 0,04 | 0,18 | 5,31 | −0,93 | 0,6641 | 0,0292 | |||
| NOC / Northrop Grumman Corporation | 0,01 | 0,06 | 5,17 | −0,84 | 0,6466 | 0,0290 | |||
| TSLA / Tesla, Inc. | 0,01 | 0,18 | 5,09 | 14,32 | 0,6357 | 0,1091 | |||
| MRK / Merck & Co., Inc. | 0,07 | 0,11 | 4,92 | −3,32 | 0,6155 | 0,0126 | |||
| QCOM / QUALCOMM Incorporated | 0,04 | 0,22 | 4,90 | −9,56 | 0,6129 | −0,0289 | |||
| GE / General Electric Company | 0,05 | −87,47 | 4,84 | −4,10 | 0,6051 | 0,0075 | |||
| MSFT / Microsoft Corporation | 0,02 | 0,00 | 4,82 | 4,08 | 0,6026 | 0,0543 | |||
| CTSH / Cognizant Technology Solutions Corporation | 0,06 | 0,27 | 4,80 | 7,43 | 0,5997 | 0,0711 | |||
| GIS / General Mills, Inc. | 0,08 | 0,23 | 4,77 | −1,59 | 0,5961 | 0,0224 | |||
| SBUX / Starbucks Corporation | 0,04 | 0,22 | 4,77 | −1,12 | 0,5959 | 0,0252 | |||
| LUMN / Lumen Technologies, Inc. | 0,38 | 0,26 | 4,76 | −8,60 | 0,5955 | −0,0215 | |||
| HSY / The Hershey Company | 0,03 | 0,15 | 4,75 | −2,71 | 0,5934 | 0,0158 | |||
| SJM / The J. M. Smucker Company | 0,04 | 0,26 | 4,72 | −7,14 | 0,5904 | −0,0117 | |||
| ORLY / O'Reilly Automotive, Inc. | 0,01 | 0,04 | 4,66 | 7,96 | 0,5829 | 0,0716 | |||
| MMM / 3M Company | 0,03 | 0,05 | 4,63 | −11,63 | 0,5794 | −0,0415 | |||
| EXPD / Expeditors International of Washington, Inc. | 0,04 | 0,04 | 4,57 | −5,88 | 0,5706 | −0,0035 | |||
| BMY / Bristol-Myers Squibb Company | 0,08 | 0,11 | 4,54 | −11,35 | 0,5674 | −0,0387 | |||
| FIS / Fidelity National Information Services, Inc. | 0,04 | 0,20 | 4,50 | −13,94 | 0,5626 | −0,0565 | |||
| WAT / Waters Corporation | 0,01 | 0,18 | 4,49 | 3,55 | 0,5607 | 0,0479 | |||
| VZ / Verizon Communications Inc. | 0,08 | 0,17 | 4,44 | −3,43 | 0,5552 | 0,0107 | |||
| CPRT / Copart, Inc. | 0,03 | 0,13 | 4,37 | 5,35 | 0,5465 | 0,0552 | |||
| SRE / Sempra | 0,03 | 0,16 | 4,35 | −4,36 | 0,5435 | 0,0053 | |||
| CHRW / C.H. Robinson Worldwide, Inc. | 0,05 | 0,25 | 4,33 | −6,89 | 0,5409 | −0,0092 | |||
| AMZN / Amazon.com, Inc. | 0,00 | 0,31 | 4,29 | −4,22 | 0,5362 | 0,0060 | |||
| BIO / Bio-Rad Laboratories, Inc. | 0,01 | 0,23 | 4,20 | 16,07 | 0,5246 | 0,0966 | |||
| KDP / Keurig Dr Pepper Inc. | 0,12 | 0,22 | 4,16 | −2,87 | 0,5196 | 0,0130 | |||
| PKI / Revvity Inc. | 0,02 | 0,04 | 4,15 | 12,27 | 0,5182 | 0,0811 | |||
| LECO / Lincoln Electric Holdings, Inc. | 0,03 | 0,06 | 4,11 | −2,14 | 0,5140 | 0,0166 | |||
| BKI / Black Knight Inc - Class A | 0,06 | 0,30 | 4,09 | −7,40 | 0,5115 | −0,0116 | |||
| NEM / Newmont Corporation | 0,07 | 0,30 | 4,07 | −14,08 | 0,5089 | −0,0520 | |||
| DHR / Danaher Corporation | 0,01 | 0,26 | 4,04 | 13,72 | 0,5046 | 0,0844 | |||
| XRAY / DENTSPLY SIRONA Inc. | 0,07 | 0,27 | 4,00 | −7,98 | 0,4999 | −0,0146 | |||
| MSCI / MSCI Inc. | 0,01 | 0,21 | 3,98 | 14,36 | 0,4976 | 0,0855 | |||
| DXCM / DexCom, Inc. | 0,01 | 0,30 | 3,97 | 28,44 | 0,4962 | 0,1303 | |||
| ADM / Archer-Daniels-Midland Company | 0,07 | 0,19 | 3,97 | −0,78 | 0,4959 | 0,0226 | |||
| VRSN / VeriSign, Inc. | 0,02 | 0,04 | 3,86 | −9,93 | 0,4820 | −0,0248 | |||
| PFE / Pfizer Inc. | 0,09 | 0,00 | 3,82 | 9,84 | 0,4772 | 0,0658 | |||
| DHI / D.R. Horton, Inc. | 0,05 | 0,34 | 3,81 | −6,77 | 0,4766 | −0,0076 | |||
| NTAP / NetApp, Inc. | 0,04 | 0,08 | 3,81 | 9,79 | 0,4766 | 0,0655 | |||
| GM / General Motors Company | 0,07 | 0,21 | 3,74 | −10,73 | 0,4671 | −0,0284 | |||
| DOCU / DocuSign, Inc. | 0,01 | 0,30 | 3,73 | −7,64 | 0,4667 | −0,0119 | |||
| REGN / Regeneron Pharmaceuticals, Inc. | 0,01 | 0,16 | 3,71 | 8,53 | 0,4642 | 0,0591 | |||
| HRL / Hormel Foods Corporation | 0,09 | 0,21 | 3,67 | −13,96 | 0,4592 | −0,0462 | |||
| AMD / Advanced Micro Devices, Inc. | 0,04 | 0,26 | 3,63 | 9,82 | 0,4542 | 0,0625 | |||
| MCD / McDonald's Corporation | 0,02 | 0,15 | 3,63 | 4,55 | 0,4540 | 0,0427 | |||
| BDX / Becton, Dickinson and Company | 0,02 | 0,16 | 3,59 | 1,47 | 0,4485 | 0,0299 | |||
| JNJ / Johnson & Johnson | 0,02 | 0,02 | 3,58 | −1,95 | 0,4471 | 0,0153 | |||
| WU / The Western Union Company | 0,18 | 0,29 | 3,58 | −11,72 | 0,4471 | −0,0326 | |||
| AAPL / Apple Inc. | 0,03 | 0,19 | 3,58 | 3,50 | 0,4469 | 0,0380 | |||
| DIS / The Walt Disney Company | 0,02 | 0,08 | 3,54 | −3,67 | 0,4430 | 0,0075 | |||
| F / Ford Motor Company | 0,25 | 0,25 | 3,50 | −4,47 | 0,4380 | 0,0038 | |||
| PGR / The Progressive Corporation | 0,04 | 0,21 | 3,47 | −7,77 | 0,4334 | −0,0116 | |||
| LNG / Cheniere Energy, Inc. | 0,04 | 0,09 | 3,46 | 12,72 | 0,4321 | 0,0690 | |||
| SCI / Service Corporation International | 0,73 | 0,02 | 3,46 | 11,78 | 0,4319 | 0,0660 | |||
| NFLX / Netflix, Inc. | 0,01 | 0,07 | 3,44 | 15,64 | 0,4299 | 0,0778 | |||
| CPB / The Campbell's Company | 0,08 | 0,37 | 3,37 | −7,94 | 0,4215 | −0,0121 | |||
| JKHY / Jack Henry & Associates, Inc. | 0,02 | 0,26 | 3,30 | 0,61 | 0,4121 | 0,0242 | |||
| K / Kellanova | 0,05 | 0,23 | 3,26 | −0,40 | 0,4079 | 0,0201 | |||
| ETR / Entergy Corporation | 0,03 | 0,06 | 3,21 | −0,31 | 0,4009 | 0,0200 | |||
| KO / The Coca-Cola Company | 0,06 | 0,00 | 3,19 | −3,01 | 0,3982 | 0,0094 | |||
| CHD / Church & Dwight Co., Inc. | 0,04 | 0,26 | 3,17 | −2,85 | 0,3966 | 0,0100 | |||
| ADSK / Autodesk, Inc. | 0,01 | 0,06 | 3,10 | −2,24 | 0,3871 | 0,0121 | |||
| TXN / Texas Instruments Incorporated | 0,02 | 0,00 | 3,00 | −0,07 | 0,3751 | 0,0196 | |||
| BAX / Baxter International Inc. | 0,04 | 0,13 | 2,94 | 0,07 | 0,3674 | 0,0197 | |||
| CVS / CVS Health Corporation | 0,03 | 0,27 | 2,94 | 1,98 | 0,3670 | 0,0262 | |||
| HWM / Howmet Aerospace Inc. | 0,09 | 0,38 | 2,93 | −9,16 | 0,3667 | −0,0156 | |||
| SIRI / Sirius XM Holdings Inc. | 0,47 | 0,32 | 2,89 | −6,44 | 0,3612 | −0,0044 | |||
| DG / Dollar General Corporation | 0,01 | 0,06 | 2,86 | −1,89 | 0,3570 | 0,0124 | |||
| KMB / Kimberly-Clark Corporation | 0,02 | 0,07 | 2,84 | −0,94 | 0,3549 | 0,0156 | |||
| FLT / Corpay, Inc. | 0,01 | 0,21 | 2,78 | 2,24 | 0,3476 | 0,0256 | |||
| HGH / Hartford Financial Services Group Inc. - FXDFR DB REDEEM 15/04/2042 USD 25 | 0,04 | 0,08 | 2,75 | 13,44 | 0,3439 | 0,0568 | |||
| BURL / Burlington Stores, Inc. | 0,01 | 0,28 | 2,75 | −11,70 | 0,3434 | −0,0249 | |||
| WDAY / Workday, Inc. | 0,01 | 0,03 | 2,73 | 4,67 | 0,3417 | 0,0325 | |||
| LEN / Lennar Corporation | 0,03 | 0,06 | 2,73 | −5,66 | 0,3417 | −0,0013 | |||
| WST / West Pharmaceutical Services, Inc. | 0,01 | 0,11 | 2,65 | 18,38 | 0,3309 | 0,0662 | |||
| USB / U.S. Bancorp | 0,04 | 0,08 | 2,61 | 4,39 | 0,3267 | 0,0303 | |||
| CINF / Cincinnati Financial Corporation | 0,02 | 0,10 | 2,61 | −1,99 | 0,3262 | 0,0110 | |||
| SO / The Southern Company | 0,04 | 0,04 | 2,57 | 2,47 | 0,3217 | 0,0244 | |||
| IPG / The Interpublic Group of Companies, Inc. | 0,07 | 0,00 | 2,54 | 12,91 | 0,3181 | 0,0513 | |||
| NI / NiSource Inc. | 0,10 | 0,11 | 2,53 | −1,02 | 0,3167 | 0,0137 | |||
| CL / Colgate-Palmolive Company | 0,03 | 0,00 | 2,52 | −7,08 | 0,3147 | −0,0061 | |||
| ED / Consolidated Edison, Inc. | 0,03 | 0,17 | 2,48 | 1,39 | 0,3102 | 0,0205 | |||
| NWL / Newell Brands Inc. | 0,11 | 0,37 | 2,48 | −19,10 | 0,3102 | −0,0529 | |||
| PKG / Packaging Corporation of America | 0,02 | 0,00 | 2,48 | 1,48 | 0,3094 | 0,0206 | |||
| DUK / Duke Energy Corporation | 0,03 | 0,12 | 2,47 | −1,00 | 0,3087 | 0,0134 | |||
| TSN / Tyson Foods, Inc. | 0,03 | 0,16 | 2,46 | 7,23 | 0,3079 | 0,0360 | |||
| V / Visa Inc. | 0,01 | 0,00 | 2,45 | −4,74 | 0,3062 | 0,0018 | |||
| HD / The Home Depot, Inc. | 0,01 | 0,11 | 2,45 | 3,03 | 0,3060 | 0,0247 | |||
| PEP / PepsiCo, Inc. | 0,02 | 0,00 | 2,41 | 1,52 | 0,3012 | 0,0202 | |||
| AGR / Avangrid, Inc. | 0,05 | 0,13 | 2,38 | −5,38 | 0,2970 | −0,0003 | |||
| XOM / Exxon Mobil Corporation | 0,04 | 0,25 | 2,37 | −6,52 | 0,2957 | −0,0039 | |||
| SGEN / Seagen Inc | 0,01 | 0,37 | 2,36 | 7,95 | 0,2955 | 0,0362 | |||
| CME / CME Group Inc. | 0,01 | 0,09 | 2,35 | −8,97 | 0,2941 | −0,0119 | |||
| HPE / Hewlett Packard Enterprise Company | 0,16 | 0,12 | 2,34 | −2,13 | 0,2930 | 0,0095 | |||
| LEA / Lear Corporation | 0,01 | 0,11 | 2,34 | −10,62 | 0,2924 | −0,0174 | |||
| CTAS / Cintas Corporation | 0,01 | 0,23 | 2,33 | −0,13 | 0,2914 | 0,0151 | |||
| MO / Altria Group, Inc. | 0,05 | 0,12 | 2,32 | −4,44 | 0,2902 | 0,0026 | |||
| TER / Teradyne, Inc. | 0,02 | 0,24 | 2,31 | −18,32 | 0,2892 | −0,0461 | |||
| BIIB / Biogen Inc. | 0,01 | 0,27 | 2,30 | −18,05 | 0,2877 | −0,0448 | |||
| AIG / American International Group, Inc. | 0,04 | 0,10 | 2,29 | 15,45 | 0,2867 | 0,0515 | |||
| RMD / ResMed Inc. | 0,01 | 0,15 | 2,28 | 7,08 | 0,2855 | 0,0330 | |||
| YUM / Yum! Brands, Inc. | 0,02 | 0,08 | 2,26 | 6,42 | 0,2820 | 0,0310 | |||
| SNAP / Snap Inc. | 0,03 | 0,51 | 2,23 | 9,00 | 0,2786 | 0,0365 | |||
| VEA / Vanguard Tax-Managed Funds - Vanguard FTSE Developed Markets ETF | 0,04 | −47,36 | 2,21 | −48,42 | 0,2767 | −0,2313 | |||
| LW / Lamb Weston Holdings, Inc. | 0,04 | 0,36 | 2,21 | −23,63 | 0,2759 | −0,0662 | |||
| WEC / WEC Energy Group, Inc. | 0,03 | 0,22 | 2,21 | −0,63 | 0,2757 | 0,0129 | |||
| ROL / Rollins, Inc. | 0,06 | 0,12 | 2,19 | 3,45 | 0,2740 | 0,0231 | |||
| NBIX / Neurocrine Biosciences, Inc. | 0,02 | 0,20 | 2,18 | −1,27 | 0,2730 | 0,0111 | |||
| AEP / American Electric Power Company, Inc. | 0,03 | 0,16 | 2,14 | −3,87 | 0,2674 | 0,0040 | |||
| AZN / AstraZeneca PLC - Depositary Receipt (Common Stock) | 0,04 | 2,13 | 0,2665 | 0,2665 | |||||
| XLNX / Xilinx, Inc. | 0,01 | 0,00 | 2,13 | 4,36 | 0,2660 | 0,0246 | |||
| LKQ / LKQ Corporation | 0,04 | 0,09 | 2,12 | 2,37 | 0,2647 | 0,0198 | |||
| ATO / Atmos Energy Corporation | 0,02 | 0,09 | 2,11 | −8,15 | 0,2634 | −0,0082 | |||
| DPZ / Domino's Pizza, Inc. | 0,00 | 0,18 | 2,08 | 2,47 | 0,2594 | 0,0197 | |||
| MDLZ / Mondelez International, Inc. | 0,04 | 0,25 | 2,07 | −6,58 | 0,2591 | −0,0036 | |||
| WM / Waste Management, Inc. | 0,01 | 0,09 | 2,05 | 6,72 | 0,2561 | 0,0288 | |||
| TJX / The TJX Companies, Inc. | 0,03 | 0,00 | 2,04 | −2,16 | 0,2550 | 0,0082 | |||
| ROP / Roper Technologies, Inc. | 0,00 | 0,02 | 2,01 | −5,10 | 0,2511 | 0,0005 | |||
| DBX / Dropbox, Inc. | 0,07 | 0,35 | 2,00 | −3,29 | 0,2502 | 0,0052 | |||
| ARW / Arrow Electronics, Inc. | 0,02 | 0,46 | 1,98 | −0,90 | 0,2472 | 0,0110 | |||
| EVRG / Evergy, Inc. | 0,03 | 0,18 | 1,97 | 3,10 | 0,2456 | 0,0200 | |||
| NUE / Nucor Corporation | 0,02 | 0,10 | 1,94 | 2,80 | 0,2430 | 0,0191 | |||
| ANET / Arista Networks Inc | 0,01 | 0,22 | 1,90 | −4,91 | 0,2374 | 0,0010 | |||
| CBSH / Commerce Bancshares, Inc. | 0,03 | 0,13 | 1,88 | −6,42 | 0,2350 | −0,0028 | |||
| TWTR / Twitter Inc | 0,03 | 0,38 | 1,78 | −11,91 | 0,2229 | −0,0167 | |||
| GILD / Gilead Sciences, Inc. | 0,03 | 0,11 | 1,78 | 1,54 | 0,2224 | 0,0150 | |||
| CBOE / Cboe Global Markets, Inc. | 0,01 | 0,03 | 1,75 | 4,04 | 0,2189 | 0,0196 | |||
| A / Agilent Technologies, Inc. | 0,01 | 0,00 | 1,75 | 6,58 | 0,2187 | 0,0244 | |||
| ALGN / Align Technology, Inc. | 0,00 | 0,15 | 1,74 | 9,10 | 0,2174 | 0,0287 | |||
| AEE / Ameren Corporation | 0,02 | 0,13 | 1,73 | 1,29 | 0,2156 | 0,0140 | |||
| FE / FirstEnergy Corp. | 0,05 | 0,11 | 1,72 | −4,14 | 0,2144 | 0,0026 | |||
| BWA / BorgWarner Inc. | 0,04 | 0,03 | 1,71 | −10,95 | 0,2134 | −0,0136 | |||
| DCUE / Dominion Energy Inc - Units - 2019 Series A | 0,02 | 0,10 | 1,69 | −0,65 | 0,2111 | 0,0099 | |||
| EL / The Estée Lauder Companies Inc. | 0,01 | 0,14 | 1,66 | −5,58 | 0,2072 | −0,0006 | |||
| UGI / UGI Corporation | 0,04 | 0,11 | 1,66 | −7,85 | 0,2070 | −0,0057 | |||
| DLB / Dolby Laboratories, Inc. | 0,02 | 0,15 | 1,65 | −10,32 | 0,2064 | −0,0116 | |||
| J / Jacobs Solutions Inc. | 0,01 | 0,28 | 1,63 | −0,37 | 0,2040 | 0,0101 | |||
| VEEV / Veeva Systems Inc. | 0,01 | 0,27 | 1,63 | −7,12 | 0,2037 | −0,0040 | |||
| MS.PRK / Morgan Stanley - Preferred Stock | 0,02 | 0,12 | 1,62 | 6,23 | 0,2026 | 0,0220 | |||
| APD / Air Products and Chemicals, Inc. | 0,01 | 0,09 | 1,62 | −10,89 | 0,2025 | −0,0127 | |||
| AMJ / JPMorgan Alerian MLP Index ETN - Corporate Bond/Note | 0,01 | 0,12 | 1,62 | 5,41 | 0,2022 | 0,0205 | |||
| FAST / Fastenal Company | 0,03 | 0,12 | 1,61 | −0,62 | 0,2011 | 0,0095 | |||
| KNX / Knight-Swift Transportation Holdings Inc. | 0,03 | 0,18 | 1,59 | 12,74 | 0,1991 | 0,0319 | |||
| NEE.PRN / NextEra Energy Capital Holdings, Inc. - Corporate Bond/Note | 0,02 | 0,11 | 1,58 | 7,25 | 0,1977 | 0,0231 | |||
| CDK / CDK Global Inc | 0,04 | 0,25 | 1,58 | −14,13 | 0,1975 | −0,0203 | |||
| MGM / MGM Resorts International | 0,04 | 0,14 | 1,56 | 1,29 | 0,1956 | 0,0127 | |||
| ICE / Intercontinental Exchange, Inc. | 0,01 | 0,14 | 1,56 | −3,11 | 0,1945 | 0,0044 | |||
| UHAL / U-Haul Holding Company | 0,00 | 0,00 | 1,55 | 9,59 | 0,1942 | 0,0264 | |||
| RL / Ralph Lauren Corporation | 0,01 | 0,15 | 1,50 | −5,60 | 0,1876 | −0,0006 | |||
| ZBRA / Zebra Technologies Corporation | 0,00 | 0,07 | 1,50 | −2,60 | 0,1875 | 0,0052 | |||
| W / Wayfair Inc. | 0,01 | 0,00 | 1,49 | −19,03 | 0,1866 | −0,0317 | |||
| WTRG / Essential Utilities, Inc. | 0,03 | 0,03 | 1,47 | 0,89 | 0,1841 | 0,0113 | |||
| SPLV / Invesco Exchange-Traded Fund Trust II - Invesco S&P 500 Low Volatility ETF | 0,02 | −49,47 | 1,46 | −49,55 | 0,1824 | −0,1600 | |||
| AIZ / Assurant, Inc. | 0,01 | 0,12 | 1,46 | 1,18 | 0,1821 | 0,0117 | |||
| MKTX / MarketAxess Holdings Inc. | 0,00 | 0,67 | 1,45 | −8,67 | 0,1816 | −0,0067 | |||
| BMRN / BioMarin Pharmaceutical Inc. | 0,02 | 0,19 | 1,45 | −7,17 | 0,1814 | −0,0037 | |||
| GS.PRJ / Goldman Sachs Group, 5.50% Dep Shares Fixd/Float Non-Cumul Preferred Stock Ser J | 0,00 | 0,11 | 1,44 | −0,28 | 0,1799 | 0,0091 | |||
| INTC / Intel Corporation | 0,03 | 0,13 | 1,44 | −4,96 | 0,1796 | 0,0006 | |||
| SCHO / Schwab Strategic Trust - Schwab Short-Term U.S. Treasury ETF | 0,03 | 7,60 | 1,42 | 7,48 | 0,1779 | 0,0211 | |||
| JNPR / Juniper Networks, Inc. | 0,05 | 0,23 | 1,42 | 0,85 | 0,1770 | 0,0108 | |||
| LMT / Lockheed Martin Corporation | 0,00 | 0,00 | 1,39 | −8,78 | 0,1741 | −0,0066 | |||
| PCAR / PACCAR Inc | 0,02 | 0,38 | 1,39 | −11,25 | 0,1735 | −0,0116 | |||
| SPHQ / Invesco Exchange-Traded Fund Trust - Invesco S&P 500 Quality ETF | 0,03 | −57,02 | 1,37 | −57,08 | 0,1712 | −0,2066 | |||
| GL / Globe Life Inc. | 0,02 | 0,35 | 1,37 | −6,23 | 0,1711 | −0,0017 | |||
| COO / The Cooper Companies, Inc. | 0,00 | 0,00 | 1,36 | 4,28 | 0,1705 | 0,0157 | |||
| SCHR / Schwab Strategic Trust - Schwab Intermediate-Term U.S. Treasury ETF | 0,02 | −48,36 | 1,36 | −48,49 | 0,1701 | −0,1426 | |||
| WFC / Wells Fargo & Company | 0,03 | 0,18 | 1,36 | 2,65 | 0,1695 | 0,0131 | |||
| CMS / CMS Energy Corporation | 0,02 | 0,21 | 1,34 | 1,29 | 0,1674 | 0,0109 | |||
| PNC / The PNC Financial Services Group, Inc. | 0,01 | 0,15 | 1,34 | 2,76 | 0,1674 | 0,0131 | |||
| PHM / PulteGroup, Inc. | 0,03 | 0,18 | 1,33 | −15,73 | 0,1667 | −0,0206 | |||
| WHR / Whirlpool Corporation | 0,01 | 0,12 | 1,33 | −6,41 | 0,1661 | −0,0020 | |||
| BAC.PRB / Bank of America Corporation - Preferred Stock | 0,03 | 0,16 | 1,31 | 3,14 | 0,1640 | 0,0134 | |||
| MAR / Marriott International, Inc. | 0,01 | 0,07 | 1,30 | 8,51 | 0,1626 | 0,0207 | |||
| TSCO / Tractor Supply Company | 0,01 | 0,00 | 1,28 | 8,87 | 0,1596 | 0,0208 | |||
| ELAN / Elanco Animal Health Incorporated | 0,04 | 0,14 | 1,27 | −7,98 | 0,1585 | −0,0046 | |||
| IEX / IDEX Corporation | 0,12 | 0,00 | 1,26 | 53,29 | 0,1571 | 0,0601 | |||
| ZION / Zions Bancorporation, National Association | 0,02 | 0,22 | 1,26 | 17,27 | 0,1570 | 0,0302 | |||
| ALB / Albemarle Corporation | 0,01 | 0,07 | 1,25 | 29,98 | 0,1566 | 0,0425 | |||
| AES / The AES Corporation | 0,05 | 0,07 | 1,24 | −12,38 | 0,1547 | −0,0125 | |||
| KLAC / KLA Corporation | 0,00 | 0,08 | 1,22 | 3,21 | 0,1526 | 0,0126 | |||
| RS / Reliance, Inc. | 0,01 | 0,25 | 1,22 | −5,36 | 0,1524 | −0,0001 | |||
| STLD / Steel Dynamics, Inc. | 0,02 | 0,07 | 1,21 | −1,79 | 0,1507 | 0,0054 | |||
| BK / The Bank of New York Mellon Corporation | 0,02 | 0,20 | 1,20 | 1,35 | 0,1496 | 0,0098 | |||
| ITW / Illinois Tool Works Inc. | 0,01 | 0,00 | 1,14 | −7,62 | 0,1425 | −0,0036 | |||
| CBRE / CBRE Group, Inc. | 0,01 | 0,09 | 1,13 | 13,65 | 0,1415 | 0,0236 | |||
| STT / State Street Corporation | 0,01 | 0,32 | 1,13 | 3,29 | 0,1412 | 0,0117 | |||
| ALL / The Allstate Corporation | 0,01 | 0,16 | 1,13 | −2,25 | 0,1410 | 0,0044 | |||
| DLTR / Dollar Tree, Inc. | 0,01 | 0,16 | 1,13 | −3,68 | 0,1409 | 0,0024 | |||
| IQV / IQVIA Holdings Inc. | 0,00 | 0,00 | 1,13 | −1,14 | 0,1407 | 0,0059 | |||
| H / Hyatt Hotels Corporation | 0,01 | 0,08 | 1,12 | −0,62 | 0,1401 | 0,0066 | |||
| AGNC / AGNC Investment Corp. | 0,07 | 0,35 | 1,12 | −6,28 | 0,1400 | −0,0015 | |||
| CDW / CDW Corporation | 0,01 | 0,25 | 1,11 | 4,51 | 0,1391 | 0,0130 | |||
| AFL / Aflac Incorporated | 0,02 | 0,16 | 1,11 | −2,72 | 0,1386 | 0,0037 | |||
| CDNS / Cadence Design Systems, Inc. | 0,01 | 0,00 | 1,08 | 10,63 | 0,1352 | 0,0195 | |||
| TRV / The Travelers Companies, Inc. | 0,01 | 0,17 | 1,07 | 1,71 | 0,1341 | 0,0092 | |||
| EOG / EOG Resources, Inc. | 0,01 | 0,11 | 1,07 | −3,70 | 0,1332 | 0,0022 | |||
| GPC / Genuine Parts Company | 0,01 | 0,00 | 1,06 | −4,08 | 0,1321 | 0,0017 | |||
| TMO / Thermo Fisher Scientific Inc. | 0,00 | 0,11 | 1,03 | 13,36 | 0,1294 | 0,0213 | |||
| LH / Labcorp Holdings Inc. | 0,00 | 0,00 | 1,02 | 1,99 | 0,1281 | 0,0092 | |||
| NKE / NIKE, Inc. | 0,01 | 0,00 | 1,01 | −5,98 | 0,1259 | −0,0009 | |||
| TMX / Terminix Global Holdings Inc | 0,05 | 0,07 | 1,01 | −8,04 | 0,1257 | −0,0038 | |||
| CSCO / Cisco Systems, Inc. | 0,02 | 0,00 | 1,00 | 2,77 | 0,1252 | 0,0098 | |||
| EIX / Edison International | 0,02 | 0,20 | 0,99 | −3,86 | 0,1244 | 0,0019 | |||
| XEL / Xcel Energy Inc. | 0,02 | 0,27 | 0,99 | −4,89 | 0,1240 | 0,0005 | |||
| HEI.A / HEICO Corporation | 0,01 | 0,12 | 0,98 | −5,29 | 0,1231 | 0,0000 | |||
| SYY / Sysco Corporation | 0,01 | 0,10 | 0,98 | 1,03 | 0,1229 | 0,0077 | |||
| SPGI / S&P Global Inc. | 0,00 | 0,00 | 0,98 | 3,59 | 0,1227 | 0,0105 | |||
| GPN / Global Payments Inc. | 0,01 | 0,13 | 0,98 | −15,87 | 0,1226 | −0,0154 | |||
| ABMD / Abiomed Inc. | 0,00 | 0,00 | 0,98 | 4,25 | 0,1226 | 0,0112 | |||
| HON / Honeywell International Inc. | 0,00 | 0,00 | 0,98 | −3,27 | 0,1220 | 0,0026 | |||
| MRO / Marathon Oil Corporation | 0,07 | 0,18 | 0,96 | 0,63 | 0,1195 | 0,0070 | |||
| CSGP / CoStar Group, Inc. | 0,01 | 0,24 | 0,95 | 4,14 | 0,1194 | 0,0108 | |||
| VOYA / Voya Financial, Inc. | 0,02 | 0,00 | 0,95 | −0,10 | 0,1190 | 0,0062 | |||
| ULTA / Ulta Beauty, Inc. | 0,00 | 0,00 | 0,95 | 4,29 | 0,1186 | 0,0109 | |||
| NLY / Annaly Capital Management, Inc. | 0,11 | 0,67 | 0,93 | −4,52 | 0,1162 | 0,0009 | |||
| CMI / Cummins Inc. | 0,00 | 0,10 | 0,92 | −7,88 | 0,1154 | −0,0032 | |||
| UNP / Union Pacific Corporation | 0,00 | 0,26 | 0,91 | −10,65 | 0,1142 | −0,0069 | |||
| MOH / Molina Healthcare, Inc. | 0,00 | 0,00 | 0,90 | 7,17 | 0,1121 | 0,0130 | |||
| NLOK / NortonLifeLock Inc | 0,04 | 0,01 | 0,89 | −6,99 | 0,1115 | −0,0020 | |||
| VTI / Vanguard Index Funds - Vanguard Total Stock Market ETF | 0,00 | −50,00 | 0,89 | −50,17 | 0,1114 | −0,1003 | |||
| SEE / Sealed Air Corporation | 0,02 | 0,05 | 0,89 | −7,48 | 0,1112 | −0,0026 | |||
| GGG / Graco Inc. | 0,01 | 0,00 | 0,88 | −7,60 | 0,1094 | −0,0027 | |||
| ODFL / Old Dominion Freight Line, Inc. | 0,00 | 0,20 | 0,87 | 12,97 | 0,1089 | 0,0176 | |||
| ADI / Analog Devices, Inc. | 0,01 | 0,85 | 0,1057 | 0,1057 | |||||
| EQH / Equitable Holdings, Inc. | 0,03 | 0,00 | 0,84 | −2,66 | 0,1054 | 0,0029 | |||
| LYV / Live Nation Entertainment, Inc. | 0,01 | 0,05 | 0,84 | 4,09 | 0,1050 | 0,0095 | |||
| COP / ConocoPhillips | 0,01 | 0,21 | 0,84 | 11,55 | 0,1050 | 0,0159 | |||
| WRK / WestRock Company | 0,02 | 0,11 | 0,84 | −6,28 | 0,1045 | −0,0011 | |||
| AJG / Arthur J. Gallagher & Co. | 0,01 | 0,00 | 0,83 | 6,12 | 0,1040 | 0,0112 | |||
| RHI / Robert Half Inc. | 0,01 | 0,24 | 0,83 | 13,00 | 0,1032 | 0,0167 | |||
| IBM / International Business Machines Corporation | 0,01 | 0,00 | 0,82 | −5,18 | 0,1030 | 0,0001 | |||
| TWLO / Twilio Inc. | 0,00 | 0,56 | 0,81 | −18,57 | 0,1009 | −0,0164 | |||
| SLB / Schlumberger Limited | 0,03 | 0,13 | 0,79 | −7,37 | 0,0990 | −0,0022 | |||
| MMC / Marsh & McLennan Companies, Inc. | 0,01 | 0,00 | 0,77 | 7,67 | 0,0965 | 0,0116 | |||
| VNQ / Vanguard Specialized Funds - Vanguard Real Estate ETF | 0,01 | −48,75 | 0,76 | −48,79 | 0,0951 | −0,0808 | |||
| LHX / L3Harris Technologies, Inc. | 0,00 | 0,12 | 0,76 | 2,02 | 0,0949 | 0,0068 | |||
| SQ / Block, Inc. | 0,00 | 0,13 | 0,76 | −1,56 | 0,0947 | 0,0036 | |||
| VRTX / Vertex Pharmaceuticals Incorporated | 0,00 | 0,27 | 0,76 | −9,80 | 0,0944 | −0,0047 | |||
| RTX / RTX Corporation | 0,01 | 0,75 | 0,0941 | 0,0941 | |||||
| CI / The Cigna Group | 0,00 | 0,24 | 0,75 | −15,40 | 0,0934 | −0,0112 | |||
| PXD / Pioneer Natural Resources Company | 0,00 | 0,40 | 0,74 | 2,90 | 0,0931 | 0,0074 | |||
| BRO / Brown & Brown, Inc. | 0,01 | 0,00 | 0,74 | 4,35 | 0,0930 | 0,0086 | |||
| ES / Eversource Energy | 0,01 | 0,34 | 0,74 | 2,21 | 0,0926 | 0,0068 | |||
| VWO / Vanguard International Equity Index Funds - Vanguard FTSE Emerging Markets ETF | 0,01 | −47,81 | 0,73 | −51,91 | 0,0914 | −0,0886 | |||
| DOW / Dow Inc. | 0,63 | 0,01 | 0,73 | −13,11 | 0,0911 | −0,0082 | |||
| PSX / Phillips 66 | 0,01 | 0,13 | 0,72 | −18,28 | 0,0905 | −0,0144 | |||
| WRB / W. R. Berkley Corporation | 0,01 | 0,18 | 0,72 | −1,50 | 0,0904 | 0,0035 | |||
| AMGN / Amgen Inc. | 0,00 | 0,21 | 0,70 | −12,56 | 0,0879 | −0,0073 | |||
| ROST / Ross Stores, Inc. | 0,01 | 0,06 | 0,70 | −12,16 | 0,0876 | −0,0068 | |||
| OKTA / Okta, Inc. | 0,00 | 0,34 | 0,69 | −2,68 | 0,0864 | 0,0023 | |||
| Y / Alleghany Corp. | 0,00 | 0,00 | 0,69 | −6,40 | 0,0859 | −0,0010 | |||
| LII / Lennox International Inc. | 0,00 | 0,04 | 0,68 | −16,07 | 0,0849 | −0,0109 | |||
| GWW / W.W. Grainger, Inc. | 0,00 | 0,00 | 0,68 | −10,21 | 0,0846 | −0,0046 | |||
| PG / The Procter & Gamble Company | 0,00 | 0,00 | 0,67 | 3,54 | 0,0841 | 0,0072 | |||
| GAFFX / Growth Fund Of America - Growth Fund of America - Class F-3 | 0,01 | 0,14 | 0,67 | 5,83 | 0,0840 | 0,0088 | |||
| RSG / Republic Services, Inc. | 0,01 | 0,00 | 0,66 | 9,09 | 0,0825 | 0,0109 | |||
| PBCT / People`s United Financial Inc | 0,04 | 0,09 | 0,61 | 2,00 | 0,0766 | 0,0055 | |||
| STOR / Store Capital Corp | 0,02 | 0,00 | 0,61 | −7,16 | 0,0761 | −0,0015 | |||
| IT / Gartner, Inc. | 0,00 | 0,00 | 0,61 | 25,57 | 0,0761 | 0,0187 | |||
| AAP / Advance Auto Parts, Inc. | 0,00 | 0,00 | 0,61 | 1,85 | 0,0759 | 0,0053 | |||
| L / Loews Corporation | 0,01 | 0,00 | 0,59 | −1,34 | 0,0735 | 0,0029 | |||
| EFX / Equifax Inc. | 0,00 | 0,09 | 0,58 | 5,99 | 0,0730 | 0,0078 | |||
| SON / Sonoco Products Company | 0,01 | 0,00 | 0,57 | −10,90 | 0,0715 | −0,0045 | |||
| TDG / TransDigm Group Incorporated | 0,00 | 0,11 | 0,57 | −3,55 | 0,0714 | 0,0013 | |||
| GLW / Corning Incorporated | 0,02 | 0,00 | 0,57 | −10,85 | 0,0709 | −0,0044 | |||
| OGE / OGE Energy Corp. | 0,02 | 0,00 | 0,56 | −2,11 | 0,0697 | 0,0023 | |||
| SPVU / Invesco Exchange-Traded Fund Trust II - Invesco S&P 500 Enhanced Value ETF | 0,01 | 0,00 | 0,54 | −2,17 | 0,0676 | 0,0022 | |||
| JEF / Jefferies Financial Group Inc. | 0,01 | 0,10 | 0,54 | 8,67 | 0,0674 | 0,0087 | |||
| NYCB / Flagstar Financial, Inc. | 0,04 | 0,09 | 0,53 | 16,89 | 0,0666 | 0,0126 | |||
| CNA / CNA Financial Corporation | 0,01 | 0,17 | 0,53 | −7,65 | 0,0664 | −0,0017 | |||
| AXP / American Express Company | 0,00 | 0,00 | 0,52 | 1,36 | 0,0654 | 0,0043 | |||
| WBA / Walgreens Boots Alliance, Inc. | 0,01 | 0,09 | 0,52 | −10,52 | 0,0649 | −0,0038 | |||
| BIL / SPDR Series Trust - SPDR Bloomberg 1-3 Month T-Bill ETF | 0,01 | −50,37 | 0,51 | −50,29 | 0,0634 | −0,0574 | |||
| IONS / Ionis Pharmaceuticals, Inc. | 0,02 | 0,00 | 0,51 | −15,92 | 0,0634 | −0,0080 | |||
| SPMO / Invesco Exchange-Traded Fund Trust II - Invesco S&P 500 Momentum ETF | 0,01 | −17,28 | 0,48 | −15,80 | 0,0606 | −0,0076 | |||
| LDOS / Leidos Holdings, Inc. | 0,00 | 0,00 | 0,48 | −4,79 | 0,0596 | 0,0003 | |||
| FDS / FactSet Research Systems Inc. | 0,00 | 0,00 | 0,47 | 17,87 | 0,0594 | 0,0117 | |||
| SPTL / SPDR Series Trust - SPDR Portfolio Long Term Treasury ETF | 0,01 | −50,00 | 0,47 | −50,00 | 0,0582 | −0,0521 | |||
| NOV / NOV Inc. | 0,04 | 0,10 | 0,46 | −14,23 | 0,0580 | −0,0060 | |||
| COST / Costco Wholesale Corporation | 0,00 | 0,00 | 0,45 | 13,57 | 0,0565 | 0,0094 | |||
| MOS / The Mosaic Company | 0,01 | 0,24 | 0,45 | 12,16 | 0,0565 | 0,0088 | |||
| MCK / McKesson Corporation | 0,00 | 1,22 | 0,45 | 5,66 | 0,0560 | 0,0058 | |||
| SPG / Simon Property Group, Inc. | 0,17 | 0,06 | 0,44 | 14,47 | 0,0554 | 0,0096 | |||
| ZTS / Zoetis Inc. | 0,00 | 0,59 | 0,43 | 4,85 | 0,0540 | 0,0052 | |||
| DVA / DaVita Inc. | 0,00 | 0,19 | 0,43 | −3,36 | 0,0540 | 0,0011 | |||
| TDY / Teledyne Technologies Incorporated | 0,00 | 0,00 | 0,43 | 2,62 | 0,0539 | 0,0042 | |||
| WAB / Westinghouse Air Brake Technologies Corporation | 0,00 | 0,00 | 0,43 | 4,67 | 0,0532 | 0,0051 | |||
| SYK / Stryker Corporation | 0,00 | 0,00 | 0,42 | 1,44 | 0,0527 | 0,0035 | |||
| RNG / RingCentral, Inc. | 0,00 | 0,37 | 0,41 | −24,82 | 0,0519 | −0,0135 | |||
| MHK / Mohawk Industries, Inc. | 0,00 | 0,18 | 0,40 | −7,57 | 0,0504 | −0,0012 | |||
| SIVB / SVB Financial Group | 0,00 | 0,33 | 0,40 | 16,81 | 0,0495 | 0,0094 | |||
| TRMB / Trimble Inc. | 0,00 | 0,47 | 0,39 | 1,04 | 0,0487 | 0,0031 | |||
| AMP / Ameriprise Financial, Inc. | 0,00 | 0,00 | 0,37 | 6,32 | 0,0462 | 0,0051 | |||
| VTV / Vanguard Index Funds - Vanguard Value ETF | 0,00 | −48,03 | 0,37 | −48,89 | 0,0460 | −0,0392 | |||
| BAH / Booz Allen Hamilton Holding Corporation | 0,00 | 0,22 | 0,36 | −6,51 | 0,0449 | −0,0006 | |||
| AWK / American Water Works Company, Inc. | 0,00 | 0,00 | 0,36 | 9,79 | 0,0449 | 0,0062 | |||
| / ViacomCBS Inc | 0,01 | 0,13 | 0,36 | −12,65 | 0,0449 | −0,0038 | |||
| MTUM / iShares Trust - iShares MSCI USA Momentum Factor ETF | 0,00 | −47,97 | 0,35 | −47,33 | 0,0444 | −0,0354 | |||
| UAA / Under Armour, Inc. | 0,02 | 0,00 | 0,35 | −4,64 | 0,0436 | 0,0003 | |||
| DE / Deere & Company | 0,00 | 0,10 | 0,34 | −5,04 | 0,0424 | 0,0001 | |||
| PNW / Pinnacle West Capital Corporation | 0,00 | 0,02 | 0,34 | −11,72 | 0,0424 | −0,0031 | |||
| BLL / Ball Corp. | 0,00 | 0,73 | 0,34 | 11,67 | 0,0419 | 0,0064 | |||
| ABBV / AbbVie Inc. | 0,00 | 0,13 | 0,33 | −4,03 | 0,0416 | 0,0005 | |||
| ALSN / Allison Transmission Holdings, Inc. | 0,01 | 0,01 | 0,33 | −11,11 | 0,0410 | −0,0027 | |||
| TTC / The Toro Company | 0,00 | 0,00 | 0,30 | −11,44 | 0,0377 | −0,0026 | |||
| PII / Polaris Inc. | 0,00 | 0,00 | 0,30 | −12,72 | 0,0377 | −0,0032 | |||
| INCY / Incyte Corporation | 0,00 | 0,15 | 0,28 | −18,10 | 0,0345 | −0,0054 | |||
| ANSS / ANSYS, Inc. | 0,00 | 0,00 | 0,27 | −1,80 | 0,0341 | 0,0012 | |||
| NSC / Norfolk Southern Corporation | 0,00 | 0,09 | 0,27 | −9,52 | 0,0332 | −0,0016 | |||
| AFG / American Financial Group, Inc. | 0,41 | 0,00 | 0,25 | 5,91 | 0,0314 | 0,0033 | |||
| BKNG / Booking Holdings Inc. | 0,00 | 0,00 | 0,24 | 8,22 | 0,0296 | 0,0037 | |||
| HII / Huntington Ingalls Industries, Inc. | 0,00 | 0,00 | 0,23 | −8,27 | 0,0291 | −0,0009 | |||
| OGN / Organon & Co. | 0,01 | 0,21 | 0,0269 | 0,0269 | |||||
| SUMO / Sumo Logic Inc | 0,01 | 0,00 | 0,18 | −21,89 | 0,0227 | −0,0048 | |||
| PPC / Pilgrim's Pride Corporation | 0,02 | 0,00 | 0,16 | −10,87 | 0,0205 | −0,0013 | |||
| GPMT / Granite Point Mortgage Trust Inc. | 0,01 | 0,00 | 0,13 | −10,81 | 0,0165 | −0,0010 | |||
| META / Meta Platforms, Inc. | 0,04 | 0,03 | 0,06 | 3,70 | 0,0070 | 0,0006 | |||
| CMCSA / Comcast Corporation | 0,00 | −100,00 | 0,00 | −100,00 | −0,9579 | ||||
| BNDX / Vanguard Charlotte Funds - Vanguard Total International Bond ETF | 0,00 | −100,00 | 0,00 | −100,00 | −0,0253 | ||||
| LBRDK / Liberty Broadband Corporation | 0,00 | −100,00 | 0,00 | −100,00 | −0,5316 | ||||
| DISCA / Discovery Inc - Class A | 0,00 | −100,00 | 0,00 | −100,00 | −0,4234 | ||||
| GOOGL / Alphabet Inc. | 0,00 | −100,00 | 0,00 | −100,00 | −0,7811 | ||||
| 57772K101 / Maxim Integrated Products Inc. | 0,00 | −100,00 | 0,00 | −100,00 | −0,0998 | ||||
| US0153511094 / Alexion Pharmaceuticals, Inc. | 0,00 | −100,00 | 0,00 | −100,00 | −0,3633 | ||||
| CTRA / Coterra Energy Inc. | 0,00 | −100,00 | 0,00 | −100,00 | −0,1131 | ||||
| VGIT / Vanguard Scottsdale Funds - Vanguard Intermediate-Term Treasury ETF | 0,00 | −100,00 | 0,00 | −100,00 | −0,0405 |