Grunnleggende statistikk
| Porteføljeverdi | $ 355 666 027 |
| Nåværende posisjoner | 68 |
Siste beholdninger, prestasjoner, forvaltet kapital (fra 13F, 13D)
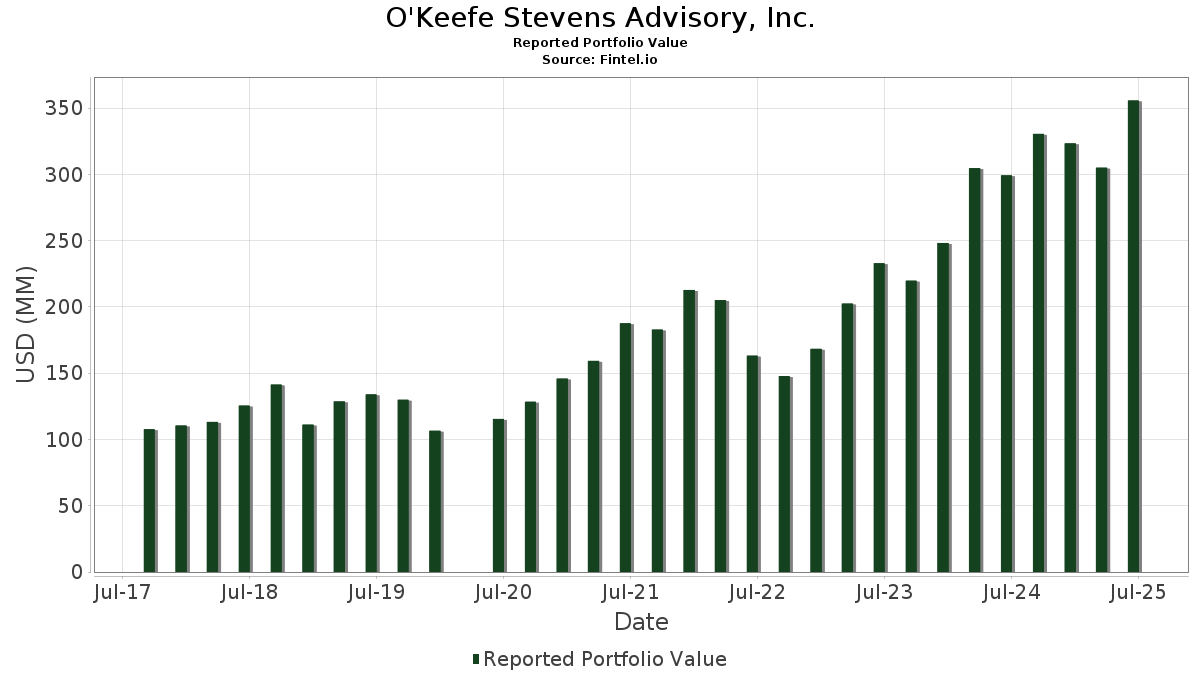
O'Keefe Stevens Advisory, Inc. har oppgitt 68 totale beholdninger i sine siste SEC-arkiveringer. Siste porteføljeverdi er beregnet til 355 666 027 USD. Faktisk forvaltet kapital (AUM) er denne verdien pluss kontanter (som ikke er oppgitt). O'Keefe Stevens Advisory, Inc.s største beholdninger er Direxion Shares ETF Trust - Direxion Daily NVDA Bear 1X Shares (US:NVDD) , QUALCOMM Incorporated (US:QCOM) , BGC Group, Inc. (US:BGC) , Corning Incorporated (US:GLW) , and Loews Corporation (US:L) . O'Keefe Stevens Advisory, Inc.s nye posisjoner inkluderer Seaport Entertainment Group Inc. (US:SEG) , Meta Platforms, Inc. (US:META) , Topgolf Callaway Brands Corp. (US:MODG) , .
De største økningene dette kvartalet
Vi bruker endringen i porteføljeallokeringen fordi dette er det mest meningsfulle målet. Endringer kan skyldes handler eller endringer i aksjekursene.
| Verdipapirer | Aksjer (MM) |
Verdi (MM$) |
Portefølje % | ΔPortefølje % |
|---|---|---|---|---|
| 0,48 | 76,44 | 21,4924 | 4,2171 | |
| 0,55 | 10,97 | 3,0831 | 2,1883 | |
| 0,23 | 14,45 | 4,0624 | 0,7746 | |
| 0,01 | 1,51 | 0,4253 | 0,3271 | |
| 0,21 | 8,70 | 2,4467 | 0,3140 | |
| 0,11 | 13,02 | 3,6611 | 0,0866 | |
| 0,01 | 2,83 | 0,7951 | 0,0806 | |
| 0,01 | 1,38 | 0,3882 | 0,0687 | |
| 0,00 | 0,24 | 0,0685 | 0,0685 | |
| 0,01 | 0,23 | 0,0646 | 0,0646 |
De største reduksjonene dette kvartalet
Vi bruker endringen i porteføljeallokeringen fordi dette er det mest meningsfulle målet. Endringer kan skyldes handler eller endringer i aksjekurser.
| Verdipapirer | Aksjer (MM) |
Verdi (MM$) |
Portefølje % | ΔPortefølje % |
|---|---|---|---|---|
| 0,05 | 13,96 | 3,9236 | −1,0816 | |
| 0,03 | 13,40 | 3,7681 | −0,9880 | |
| 0,08 | 9,39 | 2,6408 | −0,8477 | |
| 0,36 | 9,28 | 2,6093 | −0,7840 | |
| 0,17 | 15,23 | 4,2831 | −0,6900 | |
| 0,14 | 22,66 | 6,3707 | −0,6513 | |
| 0,29 | 13,18 | 3,7050 | −0,6137 | |
| 2,28 | 12,55 | 3,5296 | −0,3859 | |
| 0,22 | 5,93 | 1,6668 | −0,2521 | |
| 0,03 | 3,16 | 0,8879 | −0,1961 |
13F- og Fondsarkiveringer
Dette skjemaet ble sendt inn den 2025-07-22 for rapporteringsperioden 2025-06-30. Klikk på lenkeikonet for å se hele transaksjonshistorikken.
Oppgradere for å låse opp premiedata og eksportere til Excel![]() .
.
| Verdipapirer | Type | Gjennomsnittlig aksjekurs | Aksjer (MM) |
ΔAksjer (%) |
ΔAksjer (%) |
Verdi ($MM) |
Portefølje (%) |
ΔPortefølje (%) |
|
|---|---|---|---|---|---|---|---|---|---|
| NVDD / Direxion Shares ETF Trust - Direxion Daily NVDA Bear 1X Shares | 0,48 | −0,48 | 76,44 | 45,08 | 21,4924 | 4,2171 | |||
| QCOM / QUALCOMM Incorporated | 0,14 | 2,04 | 22,66 | 5,80 | 6,3707 | −0,6513 | |||
| BGC / BGC Group, Inc. | 1,72 | 2,44 | 17,65 | 14,28 | 4,9614 | −0,1015 | |||
| GLW / Corning Incorporated | 0,32 | 1,64 | 16,68 | 16,76 | 4,6890 | 0,0058 | |||
| L / Loews Corporation | 0,17 | 0,71 | 15,23 | 0,44 | 4,2831 | −0,6900 | |||
| DFIN / Donnelley Financial Solutions, Inc. | 0,23 | 2,16 | 14,45 | 44,09 | 4,0624 | 0,7746 | |||
| AMGN / Amgen Inc. | 0,05 | 2,00 | 13,96 | −8,58 | 3,9236 | −1,0816 | |||
| BRK.B / Berkshire Hathaway Inc. | 0,03 | 1,29 | 13,40 | −7,61 | 3,7681 | −0,9880 | |||
| HCC / Warrior Met Coal, Inc. | 0,29 | 4,17 | 13,18 | 0,05 | 3,7050 | −0,6137 | |||
| AER / AerCap Holdings N.V. | 0,11 | 4,30 | 13,02 | 19,45 | 3,6611 | 0,0866 | |||
| FPH / Five Point Holdings, LLC | 2,28 | 2,06 | 12,55 | 5,13 | 3,5296 | −0,3859 | |||
| CMP / Compass Minerals International, Inc. | 0,55 | 85,79 | 10,97 | 301,80 | 3,0831 | 2,1883 | |||
| LAZ / Lazard, Inc. | 0,22 | 1,78 | 10,50 | 12,78 | 2,9529 | −0,1003 | |||
| BABA / Alibaba Group Holding Limited - Depositary Receipt (Common Stock) | 0,08 | 2,93 | 9,39 | −11,72 | 2,6408 | −0,8477 | |||
| WY / Weyerhaeuser Company | 0,36 | 2,20 | 9,28 | −10,33 | 2,6093 | −0,7840 | |||
| MTB / M&T Bank Corporation | 0,05 | 2,82 | 8,92 | 11,59 | 2,5076 | −0,1131 | |||
| TPH / Tri Pointe Homes, Inc. | 0,27 | 9,96 | 8,73 | 10,07 | 2,4555 | −0,1461 | |||
| SPHR / Sphere Entertainment Co. | 0,21 | 4,72 | 8,70 | 33,79 | 2,4467 | 0,3140 | |||
| UNP / Union Pacific Corporation | 0,03 | 12,97 | 6,01 | 10,03 | 1,6905 | −0,1013 | |||
| PRGO / Perrigo Company plc | 0,22 | 6,30 | 5,93 | 1,30 | 1,6668 | −0,2521 | |||
| ARCO / Arcos Dorados Holdings Inc. | 0,52 | 2,17 | 4,08 | 0,00 | 1,1474 | −0,1905 | |||
| SCL / Stepan Company | 0,07 | 9,65 | 4,00 | 8,75 | 1,1247 | −0,0815 | |||
| XOM / Exxon Mobil Corporation | 0,03 | 5,38 | 3,16 | −4,48 | 0,8879 | −0,1961 | |||
| PSX / Phillips 66 | 0,02 | −0,06 | 2,88 | −3,45 | 0,8099 | −0,1682 | |||
| JPM / JPMorgan Chase & Co. | 0,01 | 9,79 | 2,83 | 29,78 | 0,7951 | 0,0806 | |||
| PFE / Pfizer Inc. | 0,10 | 4,33 | 2,48 | −0,20 | 0,6972 | −0,1175 | |||
| TKO / TKO Group Holdings, Inc. | 0,01 | 323,97 | 1,51 | 405,69 | 0,4253 | 0,3271 | |||
| EBGEF / Enbridge Inc. - Preferred Stock | 0,03 | 18,70 | 1,40 | 21,37 | 0,3930 | 0,0155 | |||
| HII / Huntington Ingalls Industries, Inc. | 0,01 | 19,70 | 1,38 | 41,68 | 0,3882 | 0,0687 | |||
| SWX / Southwest Gas Holdings, Inc. | 0,02 | 23,60 | 1,36 | 28,03 | 0,3829 | 0,0342 | |||
| BLK / BlackRock, Inc. | 0,00 | 20,33 | 1,30 | 33,47 | 0,3668 | 0,0461 | |||
| PAYX / Paychex, Inc. | 0,01 | 0,43 | 1,27 | −5,30 | 0,3567 | −0,0826 | |||
| WMB / The Williams Companies, Inc. | 0,02 | 15,81 | 1,21 | 21,70 | 0,3392 | 0,0142 | |||
| DUK / Duke Energy Corporation | 0,01 | 19,80 | 1,14 | 15,96 | 0,3208 | −0,0020 | |||
| APD / Air Products and Chemicals, Inc. | 0,00 | 24,12 | 1,14 | 18,72 | 0,3191 | 0,0056 | |||
| KO / The Coca-Cola Company | 0,02 | 19,38 | 1,09 | 17,93 | 0,3053 | 0,0034 | |||
| AAPL / Apple Inc. | 0,01 | 0,00 | 1,07 | −7,63 | 0,2996 | −0,0786 | |||
| SBUX / Starbucks Corporation | 0,01 | 24,60 | 1,05 | 16,33 | 0,2945 | −0,0006 | |||
| MDT / Medtronic plc | 0,01 | 17,44 | 0,97 | 14,00 | 0,2725 | −0,0064 | |||
| GPC / Genuine Parts Company | 0,01 | 24,20 | 0,97 | 26,47 | 0,2714 | 0,0211 | |||
| UPS / United Parcel Service, Inc. | 0,01 | 30,85 | 0,94 | 20,10 | 0,2657 | 0,0077 | |||
| LMT / Lockheed Martin Corporation | 0,00 | 21,39 | 0,88 | 25,90 | 0,2462 | 0,0181 | |||
| OMC / Omnicom Group Inc. | 0,01 | 27,79 | 0,77 | 10,97 | 0,2163 | −0,0112 | |||
| MSFT / Microsoft Corporation | 0,00 | 0,66 | 0,68 | 33,27 | 0,1917 | 0,0241 | |||
| AMAT / Applied Materials, Inc. | 0,00 | −1,40 | 0,59 | 24,63 | 0,1665 | 0,0104 | |||
| JNJ / Johnson & Johnson | 0,00 | −1,70 | 0,55 | −9,44 | 0,1539 | −0,0443 | |||
| APA / APA Corporation | 0,03 | −0,49 | 0,54 | −13,32 | 0,1519 | −0,0527 | |||
| ROKU / Roku, Inc. | 0,01 | 23,26 | 0,54 | 53,87 | 0,1512 | 0,0366 | |||
| ROK / Rockwell Automation, Inc. | 0,00 | −0,62 | 0,53 | 27,64 | 0,1494 | 0,0130 | |||
| ORCL / Oracle Corporation | 0,00 | 2,66 | 0,47 | 60,54 | 0,1327 | 0,0363 | |||
| DGX / Quest Diagnostics Incorporated | 0,00 | 0,00 | 0,45 | 6,15 | 0,1263 | −0,0124 | |||
| GJR / Strats Trust For Procter & Gambel Security - Preferred Security | 0,00 | 0,00 | 0,44 | −6,55 | 0,1244 | −0,0308 | |||
| CLMT / Calumet, Inc. | 0,03 | 12,14 | 0,42 | 39,27 | 0,1188 | 0,0194 | |||
| MCD / McDonald's Corporation | 0,00 | 0,00 | 0,39 | −6,51 | 0,1092 | −0,0269 | |||
| FC / Franklin Covey Co. | 0,02 | 35,65 | 0,39 | 12,21 | 0,1086 | −0,0044 | |||
| DIS / The Walt Disney Company | 0,00 | 2,91 | 0,33 | 29,13 | 0,0924 | 0,0091 | |||
| PM / Philip Morris International Inc. | 0,00 | −3,73 | 0,32 | 10,58 | 0,0913 | −0,0051 | |||
| BK / The Bank of New York Mellon Corporation | 0,00 | 1,12 | 0,29 | 9,96 | 0,0808 | −0,0050 | |||
| GOOG / Alphabet Inc. | 0,00 | 2,75 | 0,27 | 16,81 | 0,0764 | 0,0000 | |||
| BNL / Broadstone Net Lease, Inc. | 0,02 | 0,00 | 0,26 | −5,84 | 0,0728 | −0,0173 | |||
| GE / General Electric Company | 0,00 | 0,24 | 0,0685 | 0,0685 | |||||
| SCHW / The Charles Schwab Corporation | 0,00 | −1,11 | 0,24 | 15,71 | 0,0684 | −0,0008 | |||
| ITW / Illinois Tool Works Inc. | 0,00 | 0,00 | 0,23 | −0,43 | 0,0653 | −0,0111 | |||
| SEG / Seaport Entertainment Group Inc. | 0,01 | 0,23 | 0,0646 | 0,0646 | |||||
| ABT / Abbott Laboratories | 0,00 | 0,00 | 0,22 | 2,34 | 0,0618 | −0,0085 | |||
| META / Meta Platforms, Inc. | 0,00 | 0,22 | 0,0612 | 0,0612 | |||||
| MRK / Merck & Co., Inc. | 0,00 | 0,00 | 0,20 | −11,84 | 0,0566 | −0,0182 | |||
| MODG / Topgolf Callaway Brands Corp. | 0,01 | 0,11 | 0,0299 | 0,0299 | |||||
| TGNA / TEGNA Inc. | 0,00 | −100,00 | 0,00 | 0,0000 | |||||
| CVX / Chevron Corporation | 0,00 | −100,00 | 0,00 | 0,0000 | |||||
| CMCSA / Comcast Corporation | 0,00 | −100,00 | 0,00 | 0,0000 | |||||
| BMY / Bristol-Myers Squibb Company | 0,00 | −100,00 | 0,00 | 0,0000 |