Grunnleggende statistikk
| Porteføljeverdi | $ 50 969 000 |
| Nåværende posisjoner | 64 |
Siste beholdninger, prestasjoner, forvaltet kapital (fra 13F, 13D)
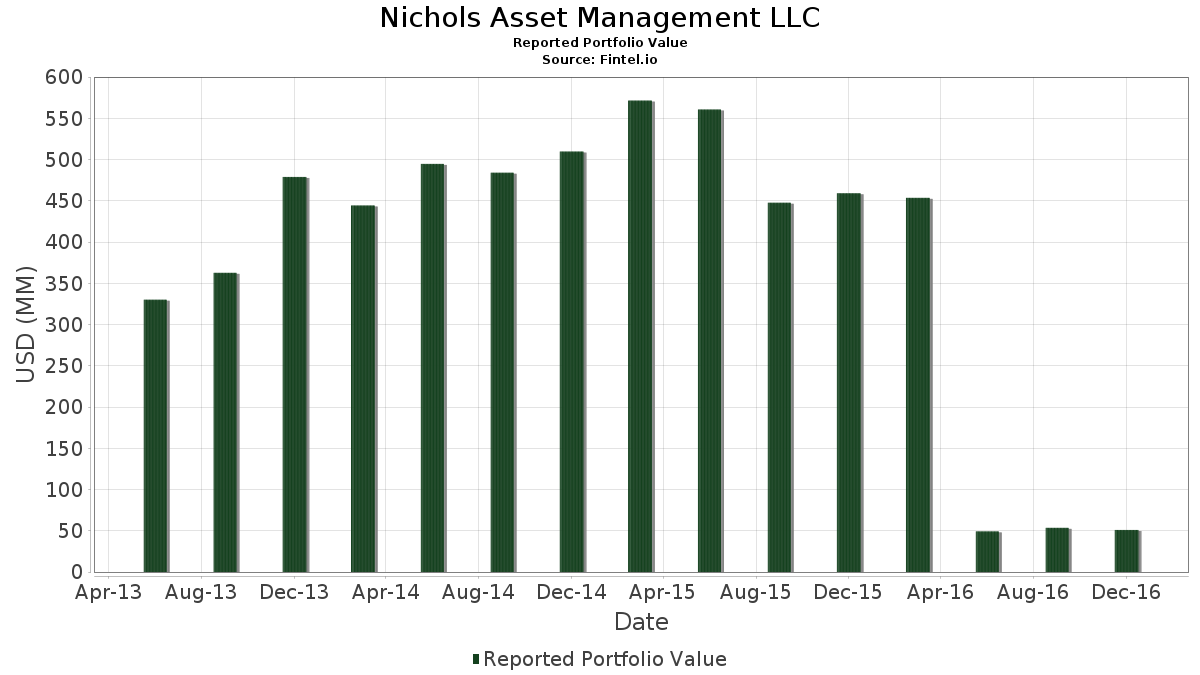
Nichols Asset Management LLC har oppgitt 64 totale beholdninger i sine siste SEC-arkiveringer. Siste porteføljeverdi er beregnet til 50 969 000 USD. Faktisk forvaltet kapital (AUM) er denne verdien pluss kontanter (som ikke er oppgitt). Nichols Asset Management LLCs største beholdninger er iShares Trust - iShares Preferred and Income Securities ETF (US:PFF) , SPDR Series Trust - SPDR Bloomberg High Yield Bond ETF (US:JNK) , SPDR S&P 500 ETF (US:SPY) , Invesco QQQ Trust, Series 1 (US:QQQ) , and iShares Trust - iShares Select Dividend ETF (US:DVY) .
De største økningene dette kvartalet
Vi bruker endringen i porteføljeallokeringen fordi dette er det mest meningsfulle målet. Endringer kan skyldes handler eller endringer i aksjekursene.
| Verdipapirer | Aksjer (MM) |
Verdi (MM$) |
Portefølje % | ΔPortefølje % |
|---|---|---|---|---|
| 0,02 | 2,33 | 4,5714 | 4,5714 | |
| 0,00 | 0,57 | 1,1144 | 1,1144 | |
| 0,01 | 0,55 | 1,0771 | 1,0771 | |
| 0,00 | 0,53 | 1,0398 | 1,0398 | |
| 0,15 | 5,37 | 10,5260 | 0,4294 | |
| 0,00 | 0,21 | 0,4120 | 0,4120 | |
| 0,01 | 2,66 | 5,2169 | 0,4105 | |
| 0,01 | 0,59 | 1,1497 | 0,3072 | |
| 0,02 | 1,64 | 3,2255 | 0,2535 | |
| 0,01 | 0,92 | 1,8109 | 0,1783 |
De største reduksjonene dette kvartalet
Vi bruker endringen i porteføljeallokeringen fordi dette er det mest meningsfulle målet. Endringer kan skyldes handler eller endringer i aksjekurser.
| Verdipapirer | Aksjer (MM) |
Verdi (MM$) |
Portefølje % | ΔPortefølje % |
|---|---|---|---|---|
| 0,00 | 0,00 | −0,8705 | ||
| 0,00 | 0,33 | 0,6475 | −0,4453 | |
| 0,00 | 0,00 | −0,4390 | ||
| 0,00 | 0,00 | −0,3923 | ||
| 0,00 | 0,35 | 0,6867 | −0,3146 | |
| 0,00 | 0,26 | 0,5140 | −0,2612 | |
| 0,02 | 0,95 | 1,8698 | −0,2392 | |
| 0,15 | 5,45 | 10,6830 | −0,1141 | |
| 0,01 | 0,33 | 0,6514 | −0,1052 | |
| 0,00 | 0,58 | 1,1478 | −0,0833 |
13F- og Fondsarkiveringer
Dette skjemaet ble sendt inn den 2017-02-10 for rapporteringsperioden 2016-12-31. Klikk på lenkeikonet for å se hele transaksjonshistorikken.
Oppgradere for å låse opp premiedata og eksportere til Excel![]() .
.
| Verdipapirer | Type | Gjennomsnittlig aksjekurs | Aksjer (MM) |
ΔAksjer (%) |
ΔAksjer (%) |
Verdi ($MM) |
Portefølje (%) |
ΔPortefølje (%) |
|
|---|---|---|---|---|---|---|---|---|---|
| PFF / iShares Trust - iShares Preferred and Income Securities ETF | 0,15 | 0,00 | 5,45 | −5,80 | 10,6830 | −0,1141 | |||
| JNK / SPDR Series Trust - SPDR Bloomberg High Yield Bond ETF | 0,15 | 0,00 | 5,37 | −0,74 | 10,5260 | 0,4294 | |||
| SPY / SPDR S&P 500 ETF | 0,01 | 0,00 | 2,66 | 3,34 | 5,2169 | 0,4105 | |||
| Dow Jones Industrial Avg ETF / (252787106) | 0,01 | 0,00 | 2,51 | 8,04 | 0,0000 | ||||
| QQQ / Invesco QQQ Trust, Series 1 | 0,02 | −16,65 | 2,33 | −16,85 | 4,5714 | 4,5714 | |||
| DVY / iShares Trust - iShares Select Dividend ETF | 0,02 | 0,00 | 1,64 | 3,33 | 3,2255 | 0,2535 | |||
| MMC / Marsh & McLennan Companies, Inc. | 0,02 | 0,00 | 1,60 | 0,50 | 3,1313 | 0,1649 | |||
| IGSB / iShares Trust - iShares 1-5 Year Investment Grade Corporate Bond ETF | 0,01 | 0,00 | 1,37 | −0,80 | 2,6859 | 0,1081 | |||
| INTC / Intel Corporation | 0,03 | 0,00 | 1,01 | −3,91 | 1,9777 | 0,0181 | |||
| MMM / 3M Company | 0,01 | 0,00 | 1,01 | 1,31 | 1,9757 | 0,1189 | |||
| JNJ / Johnson & Johnson | 0,01 | 0,96 | 0,97 | −1,53 | 1,8992 | 0,0629 | |||
| CNC / Centene Corporation | 0,02 | 0,00 | 0,95 | −15,59 | 1,8698 | −0,2392 | |||
| MCD / McDonald's Corporation | 0,01 | 0,00 | 0,92 | 5,61 | 1,8109 | 0,1783 | |||
| BDX / Becton, Dickinson and Company | 0,00 | 0,00 | 0,81 | −7,93 | 1,5951 | −0,0544 | |||
| GE / General Electric Company | 0,03 | 0,00 | 0,81 | 6,75 | 1,5833 | 0,1711 | |||
| RTX / RTX Corporation | 0,01 | 0,00 | 0,77 | 7,80 | 1,5186 | 0,1773 | |||
| NVS / Novartis AG - Depositary Receipt (Common Stock) | 0,01 | 0,00 | 0,75 | −7,64 | 1,4715 | −0,0453 | |||
| PEP / PepsiCo, Inc. | 0,01 | 0,00 | 0,72 | −3,88 | 1,4087 | 0,0133 | |||
| NSRGY / Nestlé S.A. - Depositary Receipt (Common Stock) | 0,01 | 0,00 | 0,71 | −9,10 | 1,3910 | −0,0660 | |||
| GIS / General Mills, Inc. | 0,01 | 0,00 | 0,63 | −3,35 | 1,2439 | 0,0185 | |||
| ROP / Roper Technologies, Inc. | 0,00 | 0,00 | 0,63 | 0,32 | 1,2341 | 0,0628 | |||
| ABBV / AbbVie Inc. | 0,01 | 0,00 | 0,61 | −0,81 | 1,2007 | 0,0482 | |||
| TJX / The TJX Companies, Inc. | 0,01 | 0,00 | 0,61 | 0,50 | 1,1948 | 0,0628 | |||
| SF / Stifel Financial Corp. | 0,01 | 0,00 | 0,59 | 29,93 | 1,1497 | 0,3072 | |||
| TMO / Thermo Fisher Scientific Inc. | 0,00 | 0,00 | 0,58 | −11,23 | 1,1478 | −0,0833 | |||
| IWM / iShares Trust - iShares Russell 2000 ETF | 0,00 | 0,00 | 0,57 | 8,40 | 1,1144 | 1,1144 | |||
| PUK / Prudential plc - Depositary Receipt (Common Stock) | 0,01 | 0,00 | 0,55 | 11,36 | 1,0771 | 1,0771 | |||
| UNP / Union Pacific Corporation | 0,01 | 0,00 | 0,55 | 6,43 | 1,0712 | 0,1130 | |||
| BFFAF / BASF SE | 0,01 | 0,00 | 0,54 | 8,25 | 1,0555 | 0,1271 | |||
| WPPGY / WPP PLC | 0,00 | 0,00 | 0,53 | −5,86 | 1,0398 | 1,0398 | |||
| ES / Eversource Energy | 0,01 | 0,00 | 0,53 | 1,94 | 1,0300 | 0,0680 | |||
| BIIB / Biogen Inc. | 0,00 | 0,00 | 0,52 | −9,52 | 1,0261 | −0,0536 | |||
| MSFT / Microsoft Corporation | 0,01 | 0,00 | 0,52 | 7,85 | 1,0242 | 0,1200 | |||
| SYY / Sysco Corporation | 0,01 | 0,00 | 0,52 | 12,91 | 1,0124 | 0,1587 | |||
| WMT / Walmart Inc. | 0,01 | 0,00 | 0,50 | −4,18 | 0,9888 | 0,0063 | |||
| KMB / Kimberly-Clark Corporation | 0,00 | 0,00 | 0,50 | −9,55 | 0,9849 | −0,0518 | |||
| AMT / American Tower Corporation | 0,00 | 0,00 | 0,48 | −6,67 | 0,9339 | −0,0188 | |||
| AMZN / Amazon.com, Inc. | 0,00 | 0,00 | 0,45 | −10,36 | 0,8829 | −0,0548 | |||
| SYT / SYLA Technologies Co., Ltd. - Depositary Receipt (Common Stock) | 0,01 | 0,00 | 0,45 | −9,70 | 0,8770 | −0,0477 | |||
| AMGN / Amgen Inc. | 0,00 | 0,00 | 0,42 | −12,24 | 0,8162 | −0,0693 | |||
| FUJHY / Subaru Corporation - Depositary Receipt (Common Stock) | 0,02 | 300,00 | 0,41 | 8,49 | 0,8024 | 0,0982 | |||
| FDX / FedEx Corporation | 0,00 | 0,00 | 0,39 | 6,78 | 0,7730 | 0,0837 | |||
| ABT / Abbott Laboratories | 0,01 | 0,00 | 0,39 | −9,20 | 0,7554 | −0,0367 | |||
| NEE / NextEra Energy, Inc. | 0,00 | 0,00 | 0,38 | −2,30 | 0,7495 | 0,0191 | |||
| TSM / Taiwan Semiconductor Manufacturing Company Limited - Depositary Receipt (Common Stock) | 0,01 | 0,00 | 0,35 | −6,13 | 0,6906 | −0,0099 | |||
| V / Visa Inc. | 0,00 | −30,86 | 0,35 | −34,70 | 0,6867 | −0,3146 | |||
| CSCO / Cisco Systems, Inc. | 0,01 | 0,00 | 0,33 | −4,86 | 0,6533 | −0,0005 | |||
| NGG / National Grid plc - Depositary Receipt (Common Stock) | 0,01 | 0,00 | 0,33 | −18,02 | 0,6514 | −0,1052 | |||
| CVS / CVS Health Corporation | 0,00 | −36,50 | 0,33 | −43,59 | 0,6475 | −0,4453 | |||
| Power Assets ADR / (438580300) | 0,04 | 0,00 | 0,33 | −11,38 | 0,0000 | ||||
| CVX / Chevron Corporation | 0,00 | 0,00 | 0,33 | 14,34 | 0,6416 | 0,1073 | |||
| XOM / Exxon Mobil Corporation | 0,00 | 0,00 | 0,32 | 3,51 | 0,6357 | 0,0510 | |||
| SIEGY / Siemens Aktiengesellschaft - Depositary Receipt (Common Stock) | 0,00 | 0,00 | 0,31 | 4,42 | 0,6023 | 0,0531 | |||
| SO / The Southern Company | 0,01 | 0,00 | 0,30 | −4,10 | 0,5964 | 0,0043 | |||
| PG / The Procter & Gamble Company | 0,00 | 0,00 | 0,27 | −6,27 | 0,5278 | −0,0083 | |||
| ADP / Automatic Data Processing, Inc. | 0,00 | 0,00 | 0,27 | 16,59 | 0,5238 | 0,0961 | |||
| HENOY / Henkel AG & Co. KGaA - Depositary Receipt (Common Stock) | 0,00 | 0,00 | 0,26 | −10,58 | 0,5140 | −0,0333 | |||
| CL / Colgate-Palmolive Company | 0,00 | −28,57 | 0,26 | −36,87 | 0,5140 | −0,2612 | |||
| SKM / SK Telecom Co., Ltd. - Depositary Receipt (Common Stock) | 0,01 | 0,00 | 0,26 | −7,53 | 0,5062 | −0,0150 | |||
| GILD / Gilead Sciences, Inc. | 0,00 | 0,00 | 0,26 | −9,25 | 0,5003 | −0,0246 | |||
| IBM / International Business Machines Corporation | 0,00 | 0,00 | 0,25 | 4,56 | 0,4944 | 0,0442 | |||
| QCOM / QUALCOMM Incorporated | 0,00 | 0,00 | 0,23 | −4,86 | 0,4611 | −0,0003 | |||
| AAPL / Apple Inc. | 0,00 | 0,00 | 0,23 | 2,73 | 0,4434 | 0,0324 | |||
| COST / Costco Wholesale Corporation | 0,00 | 0,00 | 0,21 | 0,4120 | 0,4120 | ||||
| NKE / NIKE, Inc. | 0,00 | −100,00 | 0,00 | −100,00 | −0,4390 | ||||
| SJM / The J. M. Smucker Company | 0,00 | −100,00 | 0,00 | −100,00 | 0,0000 | ||||
| JCI / Johnson Controls International plc | 0,00 | −100,00 | 0,00 | −100,00 | −0,3923 | ||||
| TEVA / Teva Pharmaceutical Industries Limited - Depositary Receipt (Common Stock) | 0,00 | −100,00 | 0,00 | −100,00 | −0,8705 | ||||
| SNMX / Senomyx, Inc. | 0,00 | −100,00 | 0,00 | −100,00 | −0,0803 | ||||
| JASN / Jason Industries, Inc. | 0,00 | −100,00 | 0,00 | −100,00 | 0,0000 |