Grunnleggende statistikk
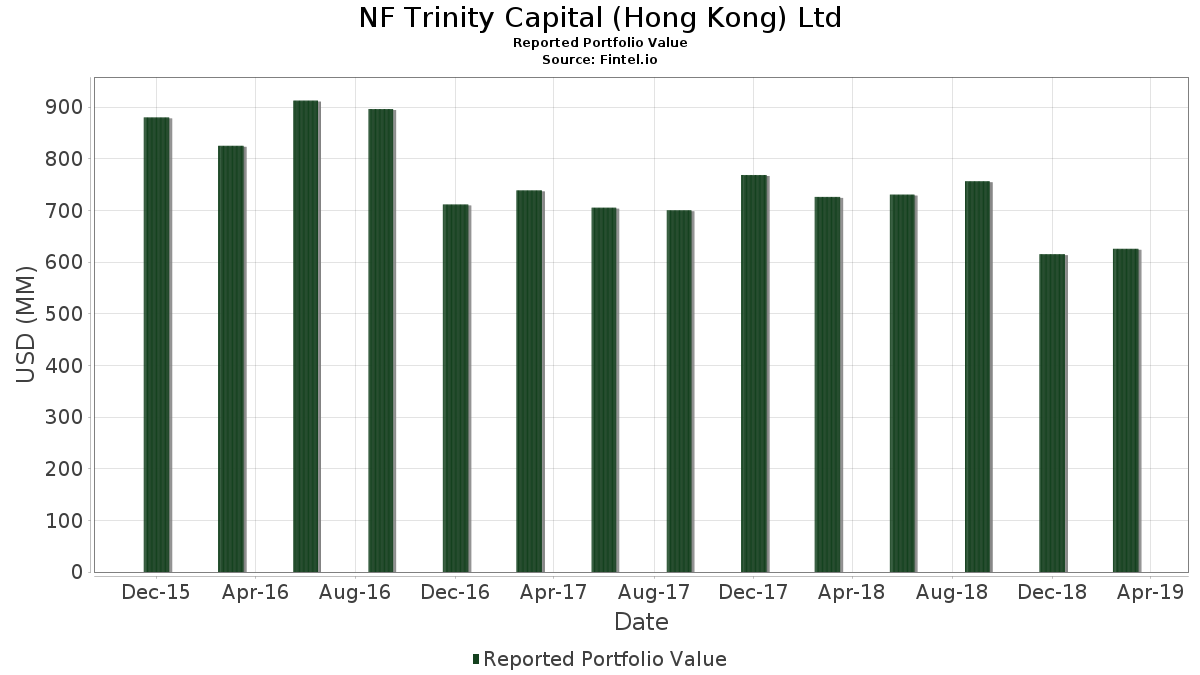
| Porteføljeverdi | $ 625 843 000 |
| Nåværende posisjoner | 39 |
Siste beholdninger, prestasjoner, forvaltet kapital (fra 13F, 13D)
NF Trinity Capital (Hong Kong) Ltd har oppgitt 39 totale beholdninger i sine siste SEC-arkiveringer. Siste porteføljeverdi er beregnet til 625 843 000 USD. Faktisk forvaltet kapital (AUM) er denne verdien pluss kontanter (som ikke er oppgitt). NF Trinity Capital (Hong Kong) Ltds største beholdninger er Alibaba Group Holding Limited - Depositary Receipt (Common Stock) (US:BABA) , Alphabet Inc. (US:GOOGL) , Meta Platforms, Inc. (US:META) , Bank of America Corporation (US:BAC) , and The Walt Disney Company (US:DIS) .
De største økningene dette kvartalet
Vi bruker endringen i porteføljeallokeringen fordi dette er det mest meningsfulle målet. Endringer kan skyldes handler eller endringer i aksjekursene.
| Verdipapirer | Aksjer (MM) |
Verdi (MM$) |
Portefølje % | ΔPortefølje % |
|---|---|---|---|---|
| 1,38 | 41,49 | 6,6303 | 6,6303 | |
| 0,01 | 16,66 | 2,6618 | 2,6618 | |
| 0,63 | 115,58 | 18,4681 | 2,5047 | |
| 0,16 | 14,32 | 2,2876 | 2,2876 | |
| 0,05 | 63,70 | 10,1791 | 0,9886 | |
| 0,08 | 11,15 | 1,7819 | 0,7932 | |
| 0,38 | 42,71 | 6,8246 | 0,7930 | |
| 0,00 | 3,07 | 0,4907 | 0,4907 | |
| 0,03 | 2,67 | 0,4260 | 0,4260 | |
| 0,28 | 17,47 | 2,7913 | 0,4165 |
De største reduksjonene dette kvartalet
Vi bruker endringen i porteføljeallokeringen fordi dette er det mest meningsfulle målet. Endringer kan skyldes handler eller endringer i aksjekurser.
| Verdipapirer | Aksjer (MM) |
Verdi (MM$) |
Portefølje % | ΔPortefølje % |
|---|---|---|---|---|
| 0,00 | 0,00 | −1,3723 | ||
| 0,00 | 0,00 | −1,1193 | ||
| 0,04 | 7,33 | 1,1720 | −1,0249 | |
| 0,00 | 0,00 | −1,0082 | ||
| 0,13 | 21,82 | 3,4870 | −0,6847 | |
| 0,00 | 0,00 | −0,6834 | ||
| 1,72 | 47,53 | 7,5949 | −0,6802 | |
| 0,50 | 10,37 | 1,6565 | −0,5261 | |
| 0,08 | 6,91 | 1,1038 | −0,4009 | |
| 0,00 | 0,00 | −0,2619 |
13F- og Fondsarkiveringer
Dette skjemaet ble sendt inn den 2019-05-10 for rapporteringsperioden 2019-03-31. Klikk på lenkeikonet for å se hele transaksjonshistorikken.
Oppgradere for å låse opp premiedata og eksportere til Excel![]() .
.
| Verdipapirer | Type | Gjennomsnittlig aksjekurs | Aksjer (MM) |
ΔAksjer (%) |
ΔAksjer (%) |
Verdi ($MM) |
Portefølje (%) |
ΔPortefølje (%) |
|
|---|---|---|---|---|---|---|---|---|---|
| BABA / Alibaba Group Holding Limited - Depositary Receipt (Common Stock) | 0,63 | −11,62 | 115,58 | 17,64 | 18,4681 | 2,5047 | |||
| GOOGL / Alphabet Inc. | 0,05 | 0,00 | 63,70 | 12,62 | 10,1791 | 0,9886 | |||
| META / Meta Platforms, Inc. | 0,30 | −16,68 | 50,18 | 5,95 | 8,0183 | 0,3224 | |||
| BAC / Bank of America Corporation | 1,72 | −16,65 | 47,53 | −6,67 | 7,5949 | −0,6802 | |||
| DIS / The Walt Disney Company | 0,38 | 13,63 | 42,71 | 15,06 | 6,8246 | 0,7930 | |||
| JD / JD.com, Inc. - Depositary Receipt (Common Stock) | 1,38 | −23,69 | 41,49 | 9,93 | 6,6303 | 6,6303 | |||
| BIDU / Baidu, Inc. - Depositary Receipt (Common Stock) | 0,13 | −18,22 | 21,82 | −15,00 | 3,4870 | −0,6847 | |||
| NXPI / NXP Semiconductors N.V. | 0,22 | −19,16 | 19,76 | −2,49 | 3,1580 | −0,1353 | |||
| C / Citigroup Inc. | 0,28 | 0,00 | 17,47 | 19,52 | 2,7913 | 0,4165 | |||
| AMZN / Amazon.com, Inc. | 0,01 | 6,98 | 16,66 | 26,83 | 2,6618 | 2,6618 | |||
| 018490100 / Allergan plc | 0,11 | 0,00 | 15,88 | 9,54 | 2,5371 | 0,1819 | |||
| EDU / New Oriental Education & Technology Group Inc. - Depositary Receipt (Common Stock) | 0,16 | 0,00 | 14,32 | 64,37 | 2,2876 | 2,2876 | |||
| OLED / Universal Display Corporation | 0,08 | −43,49 | 12,13 | −7,69 | 1,9390 | −0,1970 | |||
| XLE / The Select Sector SPDR Trust - The Energy Select Sector SPDR Fund | 0,18 | 0,00 | 11,66 | 15,29 | 1,8624 | 0,2198 | |||
| US0153511094 / Alexion Pharmaceuticals, Inc. | 0,08 | 32,00 | 11,15 | 83,27 | 1,7819 | 0,7932 | |||
| ON / ON Semiconductor Corporation | 0,50 | −38,05 | 10,37 | −22,82 | 1,6565 | −0,5261 | |||
| LBTYA / Liberty Global Ltd. | 0,38 | 2,57 | 9,35 | 19,78 | 1,4941 | 0,2257 | |||
| WB / Weibo Corporation - Depositary Receipt (Common Stock) | 0,15 | 0,00 | 9,12 | 6,10 | 1,4566 | 0,0606 | |||
| ZAYO / Zayo Group Holdings, Inc. | 0,30 | 0,00 | 8,62 | 24,44 | 1,3773 | 0,2518 | |||
| ADSK / Autodesk, Inc. | 0,06 | 0,00 | 8,57 | 21,15 | 1,3694 | 0,2200 | |||
| V / Visa Inc. | 0,05 | 0,00 | 8,43 | 18,37 | 1,3476 | 0,1900 | |||
| AAPL / Apple Inc. | 0,04 | −54,95 | 7,33 | −45,75 | 1,1720 | −1,0249 | |||
| ATUS / Altice USA, Inc. | 0,34 | 0,00 | 7,28 | 30,03 | 1,1637 | 0,2537 | |||
| BMRN / BioMarin Pharmaceutical Inc. | 0,08 | −28,50 | 6,91 | −25,41 | 1,1038 | −0,4009 | |||
| BMY / Bristol-Myers Squibb Company | 0,14 | 47,31 | 6,54 | 35,21 | 1,0444 | 0,2589 | |||
| GILD / Gilead Sciences, Inc. | 0,09 | 0,00 | 5,65 | 3,93 | 0,9033 | 0,0195 | |||
| TAL / TAL Education Group - Depositary Receipt (Common Stock) | 0,14 | −36,71 | 5,22 | −14,42 | 0,8347 | −0,1571 | |||
| IBB / iShares Trust - iShares Biotechnology ETF | 0,04 | 0,00 | 4,83 | 15,94 | 0,7718 | 0,0949 | |||
| DB / Deutsche Bank Aktiengesellschaft | 0,53 | 0,00 | 4,33 | 1,79 | 0,6923 | 0,0007 | |||
| SAGE / Sage Therapeutics, Inc. | 0,02 | −40,59 | 3,07 | −1,35 | 0,4909 | −0,0151 | |||
| BKNG / Booking Holdings Inc. | 0,00 | 3,07 | 0,4907 | 0,4907 | |||||
| US00C4U1L353 / Mylan N.V. | 0,10 | 0,00 | 2,83 | 3,43 | 0,4528 | 0,0076 | |||
| INCY / Incyte Corporation | 0,03 | 0,00 | 2,67 | 35,26 | 0,4260 | 0,4260 | |||
| SLB / Schlumberger Limited | 0,06 | 0,00 | 2,42 | 20,78 | 0,3864 | 0,0611 | |||
| MNKKQ / Mallinckrodt Plc | 0,10 | 0,00 | 2,22 | 37,53 | 0,3542 | 0,0923 | |||
| IOVA / Iovance Biotherapeutics, Inc. | 0,23 | 0,00 | 2,17 | 7,42 | 0,3471 | 0,0185 | |||
| VKTX / Viking Therapeutics, Inc. | 0,14 | 0,00 | 1,39 | 29,97 | 0,2224 | 0,0484 | |||
| FLNT / Fluent, Inc. | 0,19 | 0,00 | 1,09 | 56,21 | 0,1750 | 0,1750 | |||
| ARAV / Aravive, Inc. | 0,04 | 0,00 | 0,29 | 99,31 | 0,0459 | 0,0225 | |||
| APLS / Apellis Pharmaceuticals, Inc. | 0,00 | −100,00 | 0,00 | −100,00 | 0,0000 | ||||
| CRM / Salesforce, Inc. | 0,00 | −100,00 | 0,00 | −100,00 | 0,0000 | ||||
| MELI / MercadoLibre, Inc. | 0,00 | −100,00 | 0,00 | −100,00 | −1,0082 | ||||
| GS / The Goldman Sachs Group, Inc. | 0,00 | −100,00 | 0,00 | −100,00 | −0,1004 | ||||
| PM / Philip Morris International Inc. | 0,00 | −100,00 | 0,00 | −100,00 | −0,6834 | ||||
| CELG / Celgene Corp. | 0,00 | −100,00 | 0,00 | −100,00 | −1,1193 | ||||
| TEVA / Teva Pharmaceutical Industries Limited - Depositary Receipt (Common Stock) | 0,00 | −100,00 | 0,00 | −100,00 | −0,1327 | ||||
| FNSR / Finisar Corporation | 0,00 | −100,00 | 0,00 | −100,00 | −1,3723 | ||||
| HIMX / Himax Technologies, Inc. - Depositary Receipt (Common Stock) | 0,00 | −100,00 | 0,00 | −100,00 | −0,2619 | ||||
| VIPS / Vipshop Holdings Limited - Depositary Receipt (Common Stock) | 0,00 | −100,00 | 0,00 | −100,00 | −0,0466 | ||||
| XLRN / Acceleron Pharma Inc | 0,00 | −100,00 | 0,00 | −100,00 | −0,1017 |