Grunnleggende statistikk
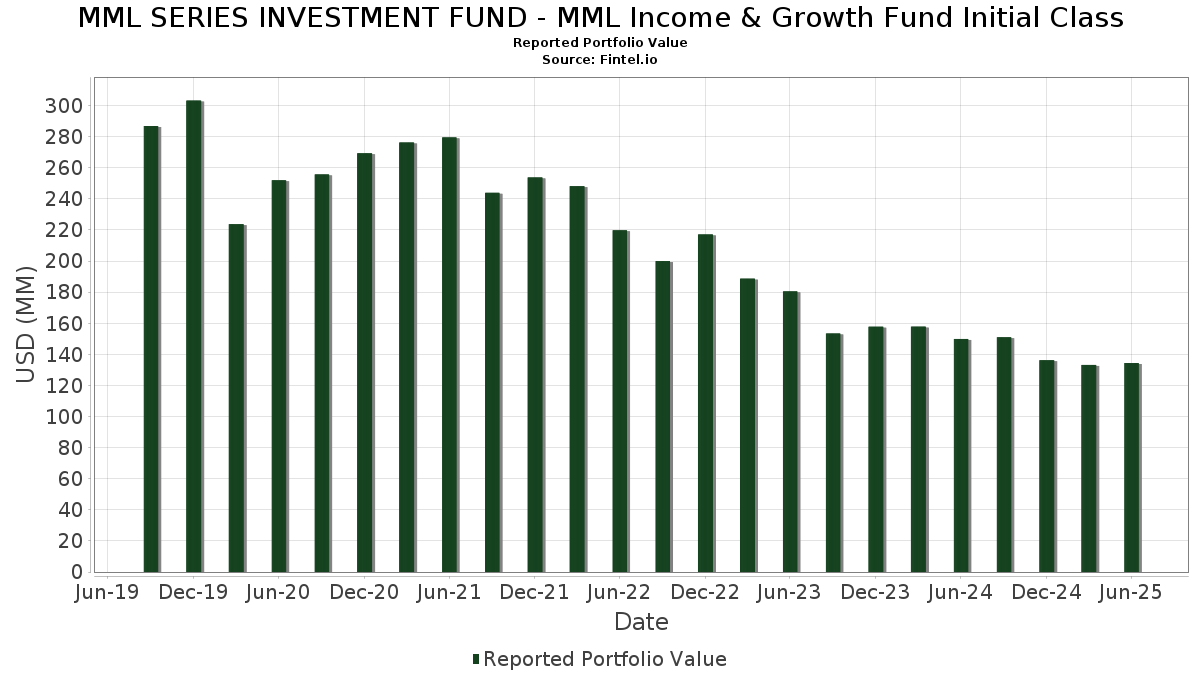
| Porteføljeverdi | $ 134 413 922 |
| Nåværende posisjoner | 89 |
Siste beholdninger, prestasjoner, forvaltet kapital (fra 13F, 13D)
MML SERIES INVESTMENT FUND - MML Income & Growth Fund Initial Class har oppgitt 89 totale beholdninger i sine siste SEC-arkiveringer. Siste porteføljeverdi er beregnet til 134 413 922 USD. Faktisk forvaltet kapital (AUM) er denne verdien pluss kontanter (som ikke er oppgitt). MML SERIES INVESTMENT FUND - MML Income & Growth Fund Initial Classs største beholdninger er Philip Morris International Inc. (US:PM) , Air Products and Chemicals, Inc. (US:APD) , Entergy Corporation (US:ETR) , Fidelity National Information Services, Inc. (US:FIS) , and Wells Fargo & Company (US:WFC) . MML SERIES INVESTMENT FUND - MML Income & Growth Fund Initial Classs nye posisjoner inkluderer State Street Navigator Securities Lending Government Money Market Portfolio (US:US8575093013) , Capital One Financial Corporation (US:COF) , WESCO International, Inc. (US:WCC) , TopBuild Corp. (US:BLD) , and Ralliant Corporation (US:RAL) .
De største økningene dette kvartalet
Vi bruker endringen i porteføljeallokeringen fordi dette er det mest meningsfulle målet. Endringer kan skyldes handler eller endringer i aksjekursene.
| Verdipapirer | Aksjer (MM) |
Verdi (MM$) |
Portefølje % | ΔPortefølje % |
|---|---|---|---|---|
| 2,99 | 2,99 | 2,2764 | 2,2764 | |
| 2,52 | 1,9187 | 1,9187 | ||
| 0,03 | 2,37 | 1,8054 | 1,0490 | |
| 0,01 | 1,22 | 0,9317 | 0,9317 | |
| 0,01 | 0,94 | 0,7169 | 0,7169 | |
| 0,03 | 2,10 | 1,6004 | 0,6376 | |
| 0,00 | 0,67 | 0,5079 | 0,5079 | |
| 0,03 | 1,59 | 1,2092 | 0,4647 | |
| 0,00 | 0,53 | 0,4063 | 0,4063 | |
| 0,01 | 1,29 | 0,9849 | 0,4023 |
De største reduksjonene dette kvartalet
Vi bruker endringen i porteføljeallokeringen fordi dette er det mest meningsfulle målet. Endringer kan skyldes handler eller endringer i aksjekurser.
| Verdipapirer | Aksjer (MM) |
Verdi (MM$) |
Portefølje % | ΔPortefølje % |
|---|---|---|---|---|
| 0,01 | 1,77 | 1,3451 | −1,0049 | |
| 0,01 | 1,58 | 1,2001 | −0,7910 | |
| 0,04 | 1,50 | 1,1424 | −0,5012 | |
| 0,01 | 2,07 | 1,5780 | −0,4948 | |
| 0,01 | 1,03 | 0,7837 | −0,4342 | |
| 0,05 | 2,64 | 2,0055 | −0,3834 | |
| 0,00 | 0,63 | 0,4799 | −0,3760 | |
| 0,04 | 2,83 | 2,1532 | −0,2639 | |
| 0,06 | 1,60 | 1,2198 | −0,2428 | |
| 0,02 | 0,99 | 0,7511 | −0,2287 |
13F- og Fondsarkiveringer
Dette skjemaet ble sendt inn den 2025-08-25 for rapporteringsperioden 2025-06-30. Klikk på lenkeikonet for å se hele transaksjonshistorikken.
Oppgradere for å låse opp premiedata og eksportere til Excel![]() .
.
| Verdipapirer | Type | Gjennomsnittlig aksjekurs | Aksjer (MM) |
ΔAksjer (%) |
ΔAksjer (%) |
Verdi ($MM) |
Portefølje (%) |
ΔPortefølje (%) |
|
|---|---|---|---|---|---|---|---|---|---|
| PM / Philip Morris International Inc. | 0,02 | −18,26 | 3,39 | −6,22 | 2,5798 | −0,1320 | |||
| APD / Air Products and Chemicals, Inc. | 0,01 | −1,74 | 3,27 | −6,03 | 2,4880 | −0,1220 | |||
| ETR / Entergy Corporation | 0,04 | −7,43 | 3,06 | −10,00 | 2,3287 | −0,2220 | |||
| FIS / Fidelity National Information Services, Inc. | 0,04 | −5,09 | 3,05 | 3,46 | 2,3221 | 0,1094 | |||
| WFC / Wells Fargo & Company | 0,04 | −5,24 | 3,02 | 5,74 | 2,2975 | 0,1557 | |||
| US8575093013 / State Street Navigator Securities Lending Government Money Market Portfolio | 2,99 | 2,99 | 2,2764 | 2,2764 | |||||
| MDT / Medtronic plc | 0,03 | −5,01 | 2,97 | −7,85 | 2,2597 | −0,1579 | |||
| PLD / Prologis, Inc. | 0,03 | 4,81 | 2,86 | −1,45 | 2,1755 | −0,0007 | |||
| MRK / Merck & Co., Inc. | 0,04 | −0,42 | 2,83 | −12,19 | 2,1532 | −0,2639 | |||
| XEL / Xcel Energy Inc. | 0,04 | −5,13 | 2,83 | −8,71 | 2,1521 | −0,1727 | |||
| CB / Chubb Limited | 0,01 | −4,90 | 2,80 | −8,76 | 2,1320 | −0,1717 | |||
| PNW / Pinnacle West Capital Corporation | 0,03 | −5,11 | 2,64 | −10,87 | 2,0079 | −0,2129 | |||
| SNY / Sanofi - Depositary Receipt (Common Stock) | 0,05 | −4,98 | 2,64 | −17,24 | 2,0055 | −0,3834 | |||
| PSX / Phillips 66 | 0,02 | −5,04 | 2,58 | −8,26 | 1,9610 | −0,1461 | |||
| TYIA / Johnson Controls International plc | 0,02 | −22,49 | 2,55 | 2,17 | 1,9374 | 0,0683 | |||
| FIXED INC CLEARING CORP.REPO / RA (000000000) | 2,52 | 1,9187 | 1,9187 | ||||||
| PSA / Public Storage | 0,01 | −4,95 | 2,51 | −6,82 | 1,9130 | −0,1108 | |||
| JPM / JPMorgan Chase & Co. | 0,01 | −4,30 | 2,45 | 13,09 | 1,8663 | 0,2396 | |||
| MCHP / Microchip Technology Incorporated | 0,03 | 61,88 | 2,37 | 135,42 | 1,8054 | 1,0490 | |||
| PAGP / Plains GP Holdings, L.P. - Limited Partnership | 0,12 | 19,60 | 2,35 | 8,75 | 1,7868 | 0,1677 | |||
| ORCL / Oracle Corporation | 0,01 | −18,39 | 2,28 | 27,65 | 1,7318 | 0,3939 | |||
| DD / DuPont de Nemours, Inc. | 0,03 | 78,43 | 2,10 | 63,91 | 1,6004 | 0,6376 | |||
| MAA / Mid-America Apartment Communities, Inc. | 0,01 | −15,02 | 2,07 | −24,96 | 1,5780 | −0,4948 | |||
| ENB / Enbridge Inc. | 0,05 | −5,00 | 2,07 | −2,86 | 1,5760 | −0,0231 | |||
| CVS / CVS Health Corporation | 0,03 | −12,09 | 1,98 | −10,48 | 1,5070 | −0,1530 | |||
| SNN / Smith & Nephew plc - Depositary Receipt (Common Stock) | 0,06 | −4,33 | 1,90 | 3,26 | 1,4459 | 0,0659 | |||
| CCEP / COCA COLA EUROPACIFIC COMPANY GUAR REGS 11/27 1.5 | 0,02 | −4,34 | 1,88 | 1,95 | 1,4287 | 0,0467 | |||
| NTRS / Northern Trust Corporation | 0,01 | −4,35 | 1,79 | 22,89 | 1,3645 | 0,2703 | |||
| UNH / UnitedHealth Group Incorporated | 0,01 | −5,26 | 1,77 | −43,57 | 1,3451 | −1,0049 | |||
| GD / General Dynamics Corporation | 0,01 | −15,79 | 1,69 | −9,90 | 1,2875 | −0,1212 | |||
| CCL / Carnival Corporation & plc | 0,06 | −6,29 | 1,61 | 34,93 | 1,2232 | 0,3295 | |||
| WMG / Warner Music Group Corp. | 0,06 | −5,38 | 1,60 | −17,79 | 1,2198 | −0,2428 | |||
| BAC / Bank of America Corporation | 0,03 | 41,21 | 1,59 | 60,18 | 1,2092 | 0,4647 | |||
| HES / Hess Corporation | 0,01 | −31,49 | 1,58 | −40,60 | 1,2001 | −0,7910 | |||
| CMCSA / Comcast Corporation | 0,04 | −29,15 | 1,50 | −31,49 | 1,1424 | −0,5012 | |||
| FTV / Fortive Corporation | 0,03 | 60,81 | 1,45 | 14,57 | 1,1008 | 0,1534 | |||
| HUM / Humana Inc. | 0,01 | −4,33 | 1,41 | −11,64 | 1,0693 | −0,1232 | |||
| CACI / CACI International Inc | 0,00 | −6,26 | 1,30 | 21,74 | 0,9885 | 0,1883 | |||
| VRT / Vertiv Holdings Co | 0,01 | −6,29 | 1,29 | 66,75 | 0,9849 | 0,4023 | |||
| XOM / Exxon Mobil Corporation | 0,01 | −6,29 | 1,29 | −15,06 | 0,9829 | −0,1580 | |||
| LHX / L3Harris Technologies, Inc. | 0,00 | −4,34 | 1,24 | 14,64 | 0,9413 | 0,1318 | |||
| COF / Capital One Financial Corporation | 0,01 | 1,22 | 0,9317 | 0,9317 | |||||
| ECG / Everus Construction Group, Inc. | 0,02 | −6,29 | 1,22 | 60,50 | 0,9305 | 0,3590 | |||
| BNS / The Bank of Nova Scotia | 0,02 | −4,33 | 1,21 | 11,50 | 0,9226 | 0,1067 | |||
| LEN / Lennar Corporation | 0,01 | 7,01 | 1,20 | 3,08 | 0,9164 | 0,0403 | |||
| PG / The Procter & Gamble Company | 0,01 | −4,36 | 1,18 | −10,59 | 0,8992 | −0,0923 | |||
| SLM / SLM Corporation | 0,04 | −6,29 | 1,17 | 4,67 | 0,8873 | 0,0512 | |||
| KDP / Keurig Dr Pepper Inc. | 0,04 | −6,29 | 1,17 | −9,47 | 0,8871 | −0,0789 | |||
| AXP / American Express Company | 0,00 | 20,17 | 1,15 | 42,52 | 0,8774 | 0,2703 | |||
| NICE / NICE Ltd. - Depositary Receipt (Common Stock) | 0,01 | −6,29 | 1,12 | 2,67 | 0,8483 | 0,0337 | |||
| ACM / AECOM | 0,01 | 7,45 | 1,10 | 30,79 | 0,8343 | 0,2054 | |||
| CNP / CenterPoint Energy, Inc. | 0,03 | −6,29 | 1,09 | −4,96 | 0,8313 | −0,0311 | |||
| WTW / Willis Towers Watson Public Limited Company | 0,00 | −6,24 | 1,06 | −15,02 | 0,8053 | −0,1284 | |||
| ALL / The Allstate Corporation | 0,01 | −34,74 | 1,03 | −36,58 | 0,7837 | −0,4342 | |||
| QCOM / QUALCOMM Incorporated | 0,01 | 11,28 | 1,00 | 15,36 | 0,7603 | 0,1106 | |||
| WYNN / Wynn Resorts, Limited | 0,01 | −6,29 | 0,99 | 5,07 | 0,7567 | 0,0470 | |||
| CIEN / Ciena Corporation | 0,01 | 14,90 | 0,99 | 54,67 | 0,7556 | 0,2739 | |||
| TAP / Molson Coors Beverage Company | 0,02 | −4,34 | 0,99 | −24,43 | 0,7511 | −0,2287 | |||
| KHC / The Kraft Heinz Company | 0,04 | −4,33 | 0,99 | −18,85 | 0,7507 | −0,1610 | |||
| MDU / MDU Resources Group, Inc. | 0,06 | −6,28 | 0,98 | −7,61 | 0,7488 | −0,0503 | |||
| GOOG / Alphabet Inc. | 0,01 | −6,28 | 0,98 | 6,39 | 0,7471 | 0,0550 | |||
| BWXT / BWX Technologies, Inc. | 0,01 | −19,74 | 0,97 | 17,21 | 0,7416 | 0,1178 | |||
| VICI / VICI Properties Inc. | 0,03 | −6,29 | 0,95 | −6,32 | 0,7213 | −0,0380 | |||
| AIG / American International Group, Inc. | 0,01 | −6,29 | 0,95 | −7,79 | 0,7211 | −0,0495 | |||
| CVX / Chevron Corporation | 0,01 | 0,94 | 0,7169 | 0,7169 | |||||
| WAL / Western Alliance Bancorporation | 0,01 | −6,30 | 0,91 | −4,83 | 0,6902 | −0,0253 | |||
| CMA / Comerica Incorporated | 0,02 | −6,29 | 0,90 | −5,38 | 0,6827 | −0,0284 | |||
| TSN / Tyson Foods, Inc. | 0,02 | −4,34 | 0,89 | −16,13 | 0,6764 | −0,1188 | |||
| CTSH / Cognizant Technology Solutions Corporation | 0,01 | −6,29 | 0,88 | −4,45 | 0,6708 | −0,0211 | |||
| AXTA / Axalta Coating Systems Ltd. | 0,03 | −6,29 | 0,87 | −16,09 | 0,6628 | −0,1162 | |||
| ENTG / Entegris, Inc. | 0,01 | 113,28 | 0,87 | 96,82 | 0,6593 | 0,3287 | |||
| PRKS / United Parks & Resorts Inc. | 0,02 | −6,29 | 0,83 | −2,82 | 0,6289 | −0,0090 | |||
| EA / Electronic Arts Inc. | 0,01 | −6,29 | 0,83 | 3,51 | 0,6279 | 0,0301 | |||
| ELAN / Elanco Animal Health Incorporated | 0,06 | −6,28 | 0,82 | 27,48 | 0,6249 | 0,1415 | |||
| CRH / CRH plc | 0,01 | −21,42 | 0,81 | −17,98 | 0,6181 | −0,1250 | |||
| AVTR / Avantor, Inc. | 0,06 | −6,29 | 0,76 | −22,19 | 0,5792 | −0,1546 | |||
| Aptiv PLC / EC (JE00BTDN8H13) | 0,01 | −6,29 | 0,76 | 7,34 | 0,5788 | 0,0477 | |||
| EG / Everest Group, Ltd. | 0,00 | −4,23 | 0,76 | −10,48 | 0,5788 | −0,0582 | |||
| LFUS / Littelfuse, Inc. | 0,00 | 22,12 | 0,74 | 40,68 | 0,5636 | 0,1688 | |||
| SBAC / SBA Communications Corporation | 0,00 | −6,24 | 0,71 | 0,00 | 0,5393 | 0,0080 | |||
| IFF / International Flavors & Fragrances Inc. | 0,01 | −4,35 | 0,71 | −9,37 | 0,5377 | −0,0471 | |||
| PR / Permian Resources Corporation | 0,05 | −27,49 | 0,69 | −28,73 | 0,5270 | −0,2017 | |||
| WCC / WESCO International, Inc. | 0,00 | 0,67 | 0,5079 | 0,5079 | |||||
| ELV / Elevance Health, Inc. | 0,00 | −38,19 | 0,63 | −44,79 | 0,4799 | −0,3760 | |||
| KNF / Knife River Corporation | 0,01 | −23,25 | 0,61 | −30,50 | 0,4664 | −0,1956 | |||
| BLD / TopBuild Corp. | 0,00 | 0,53 | 0,4063 | 0,4063 | |||||
| HAL / Halliburton Company | 0,03 | −6,29 | 0,53 | −24,72 | 0,4035 | −0,1249 | |||
| JBHT / J.B. Hunt Transport Services, Inc. | 0,00 | −6,30 | 0,49 | −9,09 | 0,3734 | −0,0314 | |||
| RAL / Ralliant Corporation | 0,01 | 0,45 | 0,3413 | 0,3413 |