Grunnleggende statistikk
| Porteføljeverdi | $ 186 822 000 |
| Nåværende posisjoner | 124 |
Siste beholdninger, prestasjoner, forvaltet kapital (fra 13F, 13D)
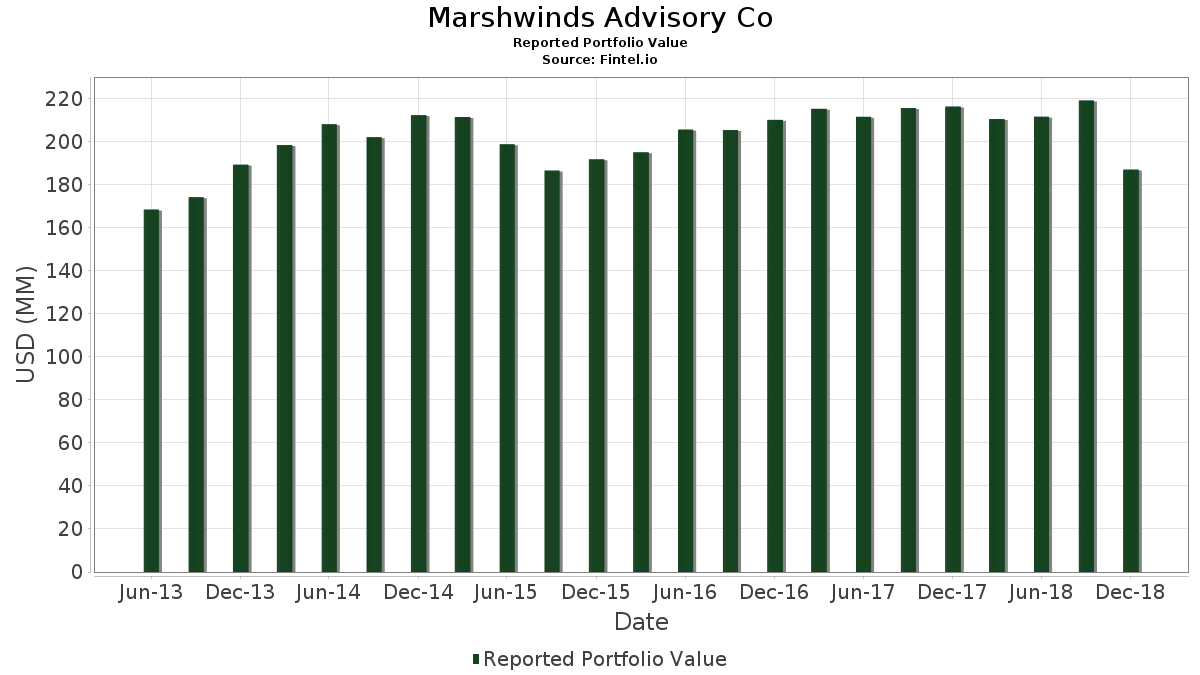
Marshwinds Advisory Co har oppgitt 124 totale beholdninger i sine siste SEC-arkiveringer. Siste porteføljeverdi er beregnet til 186 822 000 USD. Faktisk forvaltet kapital (AUM) er denne verdien pluss kontanter (som ikke er oppgitt). Marshwinds Advisory Cos største beholdninger er Microsoft Corporation (US:MSFT) , The Coca-Cola Company (US:KO) , Intuit Inc. (US:INTU) , Pfizer Inc. (US:PFE) , and Amgen Inc. (US:AMGN) .
De største økningene dette kvartalet
Vi bruker endringen i porteføljeallokeringen fordi dette er det mest meningsfulle målet. Endringer kan skyldes handler eller endringer i aksjekursene.
| Verdipapirer | Aksjer (MM) |
Verdi (MM$) |
Portefølje % | ΔPortefølje % |
|---|---|---|---|---|
| 0,04 | 2,65 | 1,4158 | 1,4158 | |
| 0,14 | 6,84 | 3,6596 | 0,5438 | |
| 0,03 | 0,94 | 0,5042 | 0,5042 | |
| 0,04 | 4,52 | 2,4178 | 0,4728 | |
| 0,02 | 0,81 | 0,4330 | 0,4330 | |
| 0,06 | 4,51 | 2,4130 | 0,4305 | |
| 0,04 | 0,71 | 0,3822 | 0,3822 | |
| 0,04 | 3,71 | 1,9864 | 0,3561 | |
| 0,06 | 0,65 | 0,3485 | 0,3485 | |
| 0,06 | 0,62 | 0,3297 | 0,3297 |
De største reduksjonene dette kvartalet
Vi bruker endringen i porteføljeallokeringen fordi dette er det mest meningsfulle målet. Endringer kan skyldes handler eller endringer i aksjekurser.
| Verdipapirer | Aksjer (MM) |
Verdi (MM$) |
Portefølje % | ΔPortefølje % |
|---|---|---|---|---|
| 0,01 | 0,27 | 0,1445 | −0,3516 | |
| 0,02 | 2,81 | 1,5046 | −0,3440 | |
| 0,02 | 2,48 | 1,3259 | −0,3067 | |
| 0,18 | 1,34 | 0,7173 | −0,2543 | |
| 0,06 | 3,43 | 1,8370 | −0,2354 | |
| 0,01 | 2,79 | 1,4955 | −0,2234 | |
| 0,05 | 3,23 | 1,7300 | −0,1840 | |
| 0,05 | 3,13 | 1,6738 | −0,1603 | |
| 0,02 | 2,27 | 1,2145 | −0,1499 | |
| 0,01 | 2,23 | 1,1926 | −0,1472 |
13F- og Fondsarkiveringer
Dette skjemaet ble sendt inn den 2019-01-07 for rapporteringsperioden 2018-12-31. Klikk på lenkeikonet for å se hele transaksjonshistorikken.
Oppgradere for å låse opp premiedata og eksportere til Excel![]() .
.
| Verdipapirer | Type | Gjennomsnittlig aksjekurs | Aksjer (MM) |
ΔAksjer (%) |
ΔAksjer (%) |
Verdi ($MM) |
Portefølje (%) |
ΔPortefølje (%) |
|
|---|---|---|---|---|---|---|---|---|---|
| MSFT / Microsoft Corporation | 0,07 | −5,01 | 7,19 | −15,65 | 3,8464 | −0,0450 | |||
| KO / The Coca-Cola Company | 0,14 | −2,22 | 6,84 | 0,23 | 3,6596 | 0,5438 | |||
| INTU / Intuit Inc. | 0,03 | 0,00 | 5,32 | −13,43 | 2,8498 | 0,0405 | |||
| PFE / Pfizer Inc. | 0,12 | −3,53 | 5,06 | −4,46 | 2,7074 | 0,2891 | |||
| AMGN / Amgen Inc. | 0,03 | −3,81 | 4,95 | −9,67 | 2,6512 | 0,1466 | |||
| LLY / Eli Lilly and Company | 0,04 | −1,64 | 4,52 | 6,08 | 2,4178 | 0,4728 | |||
| MRK / Merck & Co., Inc. | 0,06 | −3,57 | 4,51 | 3,87 | 2,4130 | 0,4305 | |||
| ORCL / Oracle Corporation | 0,10 | −5,05 | 4,47 | −16,84 | 2,3921 | −0,0627 | |||
| ABT / Abbott Laboratories | 0,06 | −3,88 | 4,19 | −5,24 | 2,2438 | 0,2230 | |||
| CSCO / Cisco Systems, Inc. | 0,10 | −2,69 | 4,18 | −13,34 | 2,2385 | 0,0340 | |||
| MDLZ / Mondelez International, Inc. | 0,10 | −4,42 | 4,00 | −10,94 | 2,1405 | 0,0895 | |||
| INTC / Intel Corporation | 0,08 | −2,88 | 3,92 | −3,62 | 2,0966 | 0,2402 | |||
| MMM / 3M Company | 0,02 | −0,50 | 3,74 | −10,02 | 2,0035 | 0,1032 | |||
| PG / The Procter & Gamble Company | 0,04 | −5,84 | 3,71 | 3,98 | 1,9864 | 0,3561 | |||
| EMR / Emerson Electric Co. | 0,06 | −3,03 | 3,43 | −24,36 | 1,8370 | −0,2354 | |||
| DOW / Dow Inc. | 0,06 | −4,97 | 3,34 | −20,98 | 1,7883 | −0,1430 | |||
| T / AT&T Inc. | 0,12 | −2,95 | 3,33 | −17,52 | 1,7819 | −0,0617 | |||
| SO / The Southern Company | 0,08 | −4,55 | 3,30 | −3,85 | 1,7648 | 0,1984 | |||
| XOM / Exxon Mobil Corporation | 0,05 | −3,84 | 3,23 | −22,86 | 1,7300 | −0,1840 | |||
| COP / ConocoPhillips | 0,05 | −3,31 | 3,13 | −22,12 | 1,6738 | −0,1603 | |||
| HD / The Home Depot, Inc. | 0,02 | −4,67 | 2,85 | −20,92 | 1,5239 | −0,1206 | |||
| RTN / Raytheon Co. | 0,02 | −6,38 | 2,81 | −30,54 | 1,5046 | −0,3440 | |||
| ABBV / AbbVie Inc. | 0,03 | −5,22 | 2,80 | −7,63 | 1,4971 | 0,1140 | |||
| NOC / Northrop Grumman Corporation | 0,01 | −3,80 | 2,79 | −25,75 | 1,4955 | −0,2234 | |||
| ESE / ESCO Technologies Inc. | 0,04 | −3,42 | 2,65 | −6,37 | 1,4158 | 1,4158 | |||
| ADSK / Autodesk, Inc. | 0,02 | −3,23 | 2,60 | −20,29 | 1,3922 | −0,0983 | |||
| IBM / International Business Machines Corporation | 0,02 | −7,80 | 2,48 | −30,69 | 1,3259 | −0,3067 | |||
| TR / Tootsie Roll Industries, Inc. | 0,07 | −3,86 | 2,47 | 9,78 | 1,3216 | 0,2942 | |||
| DUKH / Northern Lights Fund Trust - Ocean Park High Income ETF | 0,03 | −3,59 | 2,43 | 3,98 | 1,2996 | 0,2330 | |||
| VZ / Verizon Communications Inc. | 0,04 | −5,85 | 2,43 | −0,86 | 1,2991 | 0,1809 | |||
| JNJ / Johnson & Johnson | 0,02 | −0,27 | 2,33 | −6,83 | 1,2477 | 0,1048 | |||
| META / Meta Platforms, Inc. | 0,02 | −4,68 | 2,27 | −24,04 | 1,2145 | −0,1499 | |||
| BMY / Bristol-Myers Squibb Company | 0,04 | −2,38 | 2,24 | −18,27 | 1,1974 | −0,0529 | |||
| GD / General Dynamics Corporation | 0,01 | −1,05 | 2,23 | −24,04 | 1,1926 | −0,1472 | |||
| CVX / Chevron Corporation | 0,02 | −5,48 | 2,22 | −15,93 | 1,1894 | −0,0179 | |||
| SYK / Stryker Corporation | 0,01 | 0,00 | 2,16 | −11,79 | 1,1578 | 0,0377 | |||
| ED / Consolidated Edison, Inc. | 0,03 | −6,08 | 2,04 | −5,74 | 1,0909 | 0,1033 | |||
| CAT / Caterpillar Inc. | 0,02 | 0,01 | 1,92 | −16,69 | 1,0261 | −0,0250 | |||
| PSX / Phillips 66 | 0,02 | −2,12 | 1,87 | −25,17 | 0,9993 | −0,1404 | |||
| KHC / The Kraft Heinz Company | 0,04 | −2,81 | 1,86 | −24,09 | 0,9951 | −0,1236 | |||
| DIS / The Walt Disney Company | 0,02 | −3,45 | 1,84 | −9,50 | 0,9844 | 0,0561 | |||
| PEP / PepsiCo, Inc. | 0,02 | −6,82 | 1,74 | −7,90 | 0,9292 | 0,0682 | |||
| ADP / Automatic Data Processing, Inc. | 0,01 | 0,00 | 1,67 | −12,96 | 0,8918 | 0,0174 | |||
| ADI / Analog Devices, Inc. | 0,02 | −1,01 | 1,47 | −8,10 | 0,7890 | 0,0563 | |||
| MDT / Medtronic plc | 0,02 | 0,00 | 1,47 | −7,54 | 0,7874 | 0,0606 | |||
| AXP / American Express Company | 0,01 | 0,01 | 1,36 | −10,49 | 0,7306 | 0,0340 | |||
| DE / Deere & Company | 0,01 | 0,00 | 1,35 | −0,81 | 0,7248 | 0,1012 | |||
| FLO / Flowers Foods, Inc. | 0,07 | −1,35 | 1,34 | −2,33 | 0,7189 | 0,0908 | |||
| GE / General Electric Company | 0,18 | −6,07 | 1,34 | −37,00 | 0,7173 | −0,2543 | |||
| HON / Honeywell International Inc. | 0,01 | −5,13 | 1,28 | −24,65 | 0,6873 | −0,0911 | |||
| ETN / Eaton Corporation plc | 0,02 | −0,27 | 1,28 | −21,03 | 0,6873 | −0,0555 | |||
| HSY / The Hershey Company | 0,01 | −2,85 | 1,28 | 2,07 | 0,6857 | 0,1124 | |||
| CPB / The Campbell's Company | 0,04 | 43,13 | 1,25 | 28,88 | 0,6712 | 0,2268 | |||
| SBDKP / Stanley Black & Decker Inc - 4.75% PRF PERPETUAL USD 100 | 0,01 | 0,00 | 1,25 | −18,25 | 0,6712 | −0,0295 | |||
| CSX / CSX Corporation | 0,02 | −11,51 | 1,22 | −25,78 | 0,6520 | −0,0976 | |||
| DTE / DTE Energy Company | 0,01 | −7,68 | 1,16 | −6,67 | 0,6214 | 0,0532 | |||
| IR / Ingersoll Rand Inc. | 0,01 | −7,88 | 1,12 | −17,83 | 0,5995 | −0,0231 | |||
| VFC / V.F. Corporation | 0,02 | 0,00 | 1,09 | −23,62 | 0,5834 | −0,0684 | |||
| SU / Suncor Energy Inc. | 0,03 | −2,32 | 0,94 | −29,33 | 0,5042 | 0,5042 | |||
| EVRG / Evergy, Inc. | 0,02 | −3,21 | 0,92 | 0,00 | 0,4914 | 0,0720 | |||
| WY / Weyerhaeuser Company | 0,04 | −2,42 | 0,88 | −33,89 | 0,4689 | −0,1364 | |||
| SLB / Schlumberger Limited | 0,02 | 4,55 | 0,81 | −38,10 | 0,4330 | 0,4330 | |||
| PPG / PPG Industries, Inc. | 0,01 | −6,06 | 0,79 | −12,00 | 0,4239 | 0,0128 | |||
| CMC / Commercial Metals Company | 0,04 | −8,33 | 0,71 | −28,46 | 0,3822 | 0,3822 | |||
| WFC / Wells Fargo & Company | 0,01 | 0,07 | 0,65 | −12,21 | 0,3501 | 0,0098 | |||
| GEOS / Geospace Technologies Corporation | 0,06 | −3,37 | 0,65 | −27,26 | 0,3485 | 0,3485 | |||
| ADM / Archer-Daniels-Midland Company | 0,02 | 0,00 | 0,64 | −18,49 | 0,3420 | −0,0161 | |||
| TFX / Teleflex Incorporated | 0,00 | 0,00 | 0,62 | −2,97 | 0,3319 | 0,0400 | |||
| RYAM / Rayonier Advanced Materials Inc. | 0,06 | −4,69 | 0,62 | −44,95 | 0,3297 | 0,3297 | |||
| MDP / Meredith Holdings Corp | 0,01 | 2,16 | 0,61 | 3,89 | 0,3287 | 0,3287 | |||
| SNA / Snap-on Incorporated | 0,00 | −7,65 | 0,61 | −26,90 | 0,3287 | −0,0551 | |||
| BRK.B / Berkshire Hathaway Inc. | 0,00 | −1,67 | 0,60 | −6,23 | 0,3222 | 0,0290 | |||
| WMBAX / Ivy Funds - Delaware Ivy Municipal Bond Fd USD Cls A | 0,05 | 0,00 | 0,60 | 0,00 | 0,3190 | 0,0468 | |||
| DGX / Quest Diagnostics Incorporated | 0,01 | 0,00 | 0,59 | −22,85 | 0,3163 | −0,0336 | |||
| CAH / Cardinal Health, Inc. | 0,01 | 0,00 | 0,59 | −17,46 | 0,3137 | −0,0107 | |||
| MUR / Murphy Oil Corporation | 0,02 | −1,25 | 0,56 | −30,71 | 0,2971 | 0,2971 | |||
| Fidelity Natl Financial (FNF G / (316326107) | 0,02 | 0,55 | 0,0000 | ||||||
| UVV / Universal Corporation | 0,01 | 2,16 | 0,55 | −14,97 | 0,2949 | −0,0011 | |||
| FIS / Fidelity National Information Services, Inc. | 0,01 | −2,77 | 0,54 | −8,63 | 0,2890 | 0,0191 | |||
| AEE / Ameren Corporation | 0,01 | 0,00 | 0,53 | 3,09 | 0,2853 | 0,0491 | |||
| TSS / Total System Services, Inc. | 0,01 | −28,62 | 0,53 | −41,28 | 0,2848 | −0,1291 | |||
| MAS / Masco Corporation | 0,02 | 0,00 | 0,53 | −20,09 | 0,2810 | −0,0191 | |||
| BKR / Baker Hughes Company | 0,02 | 2,32 | 0,52 | −34,99 | 0,2794 | −0,0874 | |||
| PKE / Park Aerospace Corp. | 0,03 | −2,70 | 0,52 | −9,72 | 0,2783 | 0,0152 | |||
| 872307903 / TCF Financial Corporation | 0,01 | −3,94 | 0,52 | −13,30 | 0,2757 | 0,0043 | |||
| NSC / Norfolk Southern Corporation | 0,00 | −6,21 | 0,51 | −22,32 | 0,2719 | −0,0268 | |||
| RTX / RTX Corporation | 0,00 | 7,39 | 0,51 | −18,26 | 0,2708 | −0,0119 | |||
| NWL / Newell Brands Inc. | 0,03 | −3,84 | 0,49 | −12,05 | 0,2617 | 0,0078 | |||
| LW / Lamb Weston Holdings, Inc. | 0,01 | −1,73 | 0,48 | 8,58 | 0,2575 | 0,2575 | |||
| WPC / W. P. Carey Inc. | 0,01 | 0,00 | 0,47 | 1,51 | 0,2516 | 0,2516 | |||
| KMB / Kimberly-Clark Corporation | 0,00 | −16,40 | 0,47 | −16,06 | 0,2489 | −0,0042 | |||
| CAG / Conagra Brands, Inc. | 0,02 | −1,59 | 0,46 | −38,18 | 0,2478 | −0,0943 | |||
| GIFI / Gulf Island Fabrication, Inc. | 0,06 | −4,20 | 0,41 | −30,41 | 0,2205 | 0,2205 | |||
| PAYX / Paychex, Inc. | 0,01 | 0,02 | 0,40 | −11,50 | 0,2141 | 0,0076 | |||
| JPM / JPMorgan Chase & Co. | 0,00 | 0,19 | 0,36 | −13,22 | 0,1932 | 0,0032 | |||
| US0549371070 / BB&T Corp. | 0,01 | 0,18 | 0,35 | −10,59 | 0,1852 | 0,0084 | |||
| TMO / Thermo Fisher Scientific Inc. | 0,00 | 0,00 | 0,34 | −8,20 | 0,1799 | 0,0127 | |||
| AAPL / Apple Inc. | 0,00 | 14,15 | 0,33 | −20,33 | 0,1782 | −0,0127 | |||
| Glencore Xstrata PLC (2.10) / (063082236) | 0,09 | 0,33 | 0,0000 | ||||||
| HWKN / Hawkins, Inc. | 0,01 | −2,49 | 0,32 | −3,90 | 0,1713 | 0,1713 | |||
| IP / International Paper Company | 0,01 | 0,00 | 0,32 | −17,92 | 0,1691 | −0,0067 | |||
| WBA / Walgreens Boots Alliance, Inc. | 0,00 | 0,02 | 0,31 | −6,42 | 0,1638 | 0,0144 | |||
| NSRGY / Nestlé S.A. - Depositary Receipt (Common Stock) | 0,00 | 0,00 | 0,30 | −2,60 | 0,1606 | 0,0199 | |||
| LUMN / Lumen Technologies, Inc. | 0,02 | −0,65 | 0,27 | −28,87 | 0,1451 | −0,0290 | |||
| BAC / Bank of America Corporation | 0,01 | −70,22 | 0,27 | −75,14 | 0,1445 | −0,3516 | |||
| KEY / KeyCorp | 0,02 | 0,00 | 0,27 | −25,69 | 0,1440 | −0,0214 | |||
| TAP / Molson Coors Beverage Company | 0,00 | 0,00 | 0,26 | −8,80 | 0,1386 | 0,0089 | |||
| BKI / Black Knight Inc - Class A | 0,01 | 0,00 | 0,26 | −13,18 | 0,1376 | 0,1376 | |||
| SYY / Sysco Corporation | 0,00 | −2,38 | 0,26 | −16,56 | 0,1376 | −0,0031 | |||
| RF / Regions Financial Corporation | 0,02 | −2,77 | 0,25 | −29,05 | 0,1360 | −0,0276 | |||
| SNV / Synovus Financial Corp. | 0,01 | −7,70 | 0,25 | −35,55 | 0,1349 | −0,0437 | |||
| GIS / General Mills, Inc. | 0,01 | 0,00 | 0,24 | −9,51 | 0,1274 | 0,0073 | |||
| RAVN / Raven Industries, Inc. | 0,01 | −7,55 | 0,23 | −26,73 | 0,1247 | 0,1247 | |||
| SEE / Sealed Air Corporation | 0,01 | −6,97 | 0,23 | −19,10 | 0,1247 | −0,0068 | |||
| HUBB / Hubbell Incorporated | 0,00 | 7,23 | 0,22 | −20,22 | 0,1183 | −0,0082 | |||
| PM / Philip Morris International Inc. | 0,00 | −12,89 | 0,22 | −28,80 | 0,1178 | −0,0234 | |||
| STI / Solidion Technology, Inc. | 0,00 | 0,00 | 0,22 | −24,39 | 0,1162 | −0,0149 | |||
| RECN / Resources Connection, Inc. | 0,01 | −11,11 | 0,21 | −23,91 | 0,1124 | 0,1124 | |||
| BAX / Baxter International Inc. | 0,00 | −13,10 | 0,21 | −25,81 | 0,1108 | −0,0166 | |||
| LEE / Lee Enterprises, Incorporated | 0,08 | 0,00 | 0,17 | −20,10 | 0,0894 | −0,0061 | |||
| GCI / Gannett Co., Inc. | 0,01 | −9,93 | 0,11 | −18,71 | 0,0605 | −0,0030 | |||
| BRSLF / Barsele Minerals Corp. | 0,10 | 0,00 | 0,03 | −53,85 | 0,0161 | 0,0161 | |||
| ORMNF / Orex Minerals Inc. | 0,10 | 0,00 | 0,01 | −33,33 | 0,0032 | 0,0032 | |||
| 828334103 / Silver Viper Minerals Corp. | 0,10 | 0,00 | 0,00 | 0,00 | 0,0005 | 0,0001 | |||
| CMP / Compass Minerals International, Inc. | 0,00 | −100,00 | 0,00 | −100,00 | 0,0000 | ||||
| FLS / Flowserve Corporation | 0,00 | −100,00 | 0,00 | −100,00 | −0,1124 | ||||
| PNR / Pentair plc | 0,00 | −100,00 | 0,00 | −100,00 | −0,0914 | ||||
| WMT / Walmart Inc. | 0,00 | −100,00 | 0,00 | −100,00 | −0,1421 | ||||
| BHP / BHP Group Limited - Depositary Receipt (Common Stock) | 0,00 | −100,00 | 0,00 | −100,00 | 0,0000 |