Grunnleggende statistikk
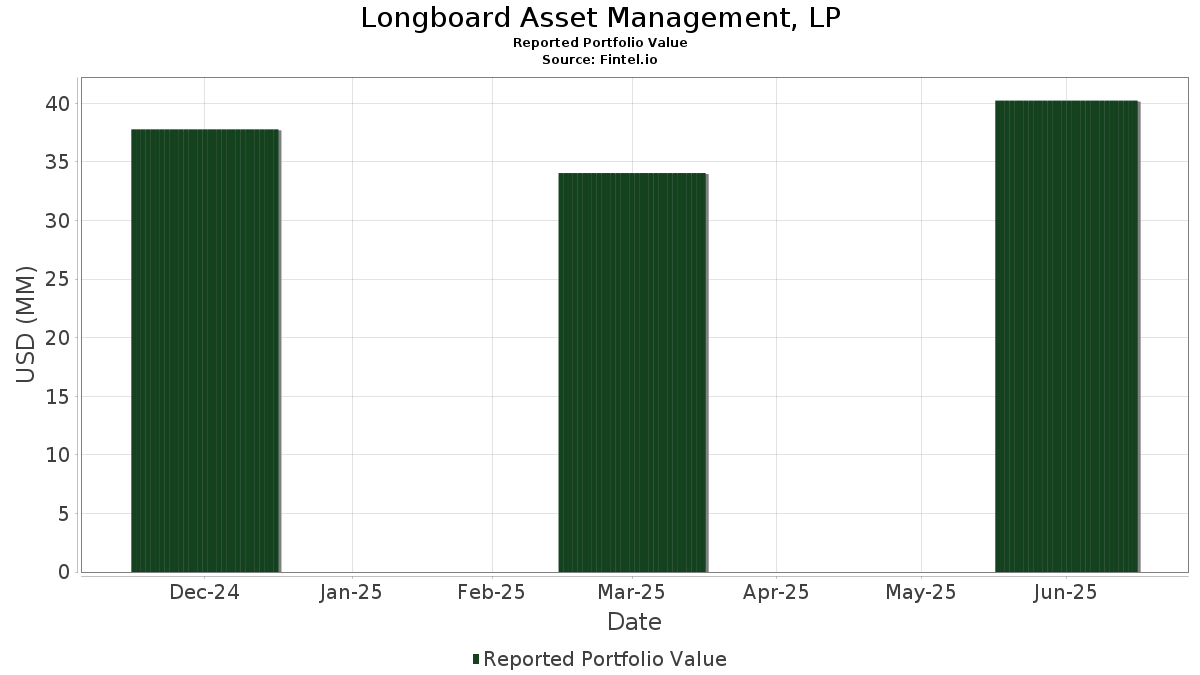
| Porteføljeverdi | $ 40 239 107 |
| Nåværende posisjoner | 168 |
Siste beholdninger, prestasjoner, forvaltet kapital (fra 13F, 13D)
Longboard Asset Management, LP har oppgitt 168 totale beholdninger i sine siste SEC-arkiveringer. Siste porteføljeverdi er beregnet til 40 239 107 USD. Faktisk forvaltet kapital (AUM) er denne verdien pluss kontanter (som ikke er oppgitt). Longboard Asset Management, LPs største beholdninger er Automatic Data Processing, Inc. (US:ADP) , Boston Scientific Corporation (US:BSX) , Starwood Property Trust, Inc. (US:STWD) , Phillips Edison & Company, Inc. (US:PECO) , and The Bank of New York Mellon Corporation (US:BK) . Longboard Asset Management, LPs nye posisjoner inkluderer Automatic Data Processing, Inc. (US:ADP) , Starwood Property Trust, Inc. (US:STWD) , Phillips Edison & Company, Inc. (US:PECO) , Atlanta Braves Holdings, Inc. (US:BATR.K) , and Roper Technologies, Inc. (US:ROP) .
De største økningene dette kvartalet
Vi bruker endringen i porteføljeallokeringen fordi dette er det mest meningsfulle målet. Endringer kan skyldes handler eller endringer i aksjekursene.
| Verdipapirer | Aksjer (MM) |
Verdi (MM$) |
Portefølje % | ΔPortefølje % |
|---|---|---|---|---|
| 0,00 | 0,36 | 0,9059 | 0,9059 | |
| 0,00 | 0,36 | 0,8883 | 0,8883 | |
| 0,02 | 0,35 | 0,8653 | 0,8653 | |
| 0,01 | 0,32 | 0,7883 | 0,7883 | |
| 0,01 | 0,32 | 0,7839 | 0,7839 | |
| 0,00 | 0,31 | 0,7804 | 0,7804 | |
| 0,01 | 0,29 | 0,7291 | 0,7291 | |
| 0,01 | 0,29 | 0,7206 | 0,7206 | |
| 0,00 | 0,29 | 0,7141 | 0,7141 | |
| 0,00 | 0,29 | 0,7136 | 0,7136 |
De største reduksjonene dette kvartalet
Vi bruker endringen i porteføljeallokeringen fordi dette er det mest meningsfulle målet. Endringer kan skyldes handler eller endringer i aksjekurser.
| Verdipapirer | Aksjer (MM) |
Verdi (MM$) |
Portefølje % | ΔPortefølje % |
|---|---|---|---|---|
| 0,00 | 0,30 | 0,7351 | −0,2017 | |
| 0,00 | 0,29 | 0,7229 | −0,1830 | |
| 0,00 | 0,24 | 0,5956 | −0,1804 | |
| 0,00 | 0,22 | 0,5586 | −0,1781 | |
| 0,01 | 0,25 | 0,6104 | −0,1581 | |
| 0,01 | 0,19 | 0,4614 | −0,1486 | |
| 0,00 | 0,24 | 0,6033 | −0,1483 | |
| 0,00 | 0,21 | 0,5134 | −0,1443 | |
| 0,00 | 0,22 | 0,5503 | −0,1437 | |
| 0,00 | 0,27 | 0,6800 | −0,1426 |
13F- og Fondsarkiveringer
Dette skjemaet ble sendt inn den 2025-07-10 for rapporteringsperioden 2025-06-30. Klikk på lenkeikonet for å se hele transaksjonshistorikken.
Oppgradere for å låse opp premiedata og eksportere til Excel![]() .
.
| Verdipapirer | Type | Gjennomsnittlig aksjekurs | Aksjer (MM) |
ΔAksjer (%) |
ΔAksjer (%) |
Verdi ($MM) |
Portefølje (%) |
ΔPortefølje (%) |
|
|---|---|---|---|---|---|---|---|---|---|
| ADP / Automatic Data Processing, Inc. | 0,00 | 0,36 | 0,9059 | 0,9059 | |||||
| BSX / Boston Scientific Corporation | 0,00 | 0,36 | 0,8883 | 0,8883 | |||||
| STWD / Starwood Property Trust, Inc. | 0,02 | 0,35 | 0,8653 | 0,8653 | |||||
| PECO / Phillips Edison & Company, Inc. | 0,01 | 0,32 | 0,7883 | 0,7883 | |||||
| BK / The Bank of New York Mellon Corporation | 0,00 | 0,00 | 0,32 | 8,59 | 0,7866 | −0,0690 | |||
| BATR.K / Atlanta Braves Holdings, Inc. | 0,01 | 0,32 | 0,7839 | 0,7839 | |||||
| ROP / Roper Technologies, Inc. | 0,00 | 0,31 | 0,7804 | 0,7804 | |||||
| IBM / International Business Machines Corporation | 0,00 | 0,00 | 0,31 | 18,53 | 0,7648 | 0,0025 | |||
| AM / Antero Midstream Corporation | 0,02 | 0,00 | 0,30 | 5,24 | 0,7502 | −0,0918 | |||
| CASY / Casey's General Stores, Inc. | 0,00 | 0,00 | 0,30 | 17,39 | 0,7393 | −0,0038 | |||
| T / AT&T Inc. | 0,01 | 0,00 | 0,30 | 2,42 | 0,7375 | −0,1141 | |||
| AJG / Arthur J. Gallagher & Co. | 0,00 | 0,00 | 0,30 | −7,52 | 0,7351 | −0,2017 | |||
| SEIC / SEI Investments Company | 0,00 | 1,08 | 0,29 | 16,73 | 0,7302 | −0,0072 | |||
| TTMI / TTM Technologies, Inc. | 0,01 | 0,29 | 0,7291 | 0,7291 | |||||
| TJX / The TJX Companies, Inc. | 0,00 | 0,00 | 0,29 | 1,39 | 0,7240 | −0,1198 | |||
| WRB / W. R. Berkley Corporation | 0,00 | 0,00 | 0,29 | 3,20 | 0,7230 | −0,1045 | |||
| PGR / The Progressive Corporation | 0,00 | 0,00 | 0,29 | −5,84 | 0,7229 | −0,1830 | |||
| NI / NiSource Inc. | 0,01 | 0,00 | 0,29 | 0,69 | 0,7218 | −0,1258 | |||
| NYT / The New York Times Company | 0,01 | 0,29 | 0,7206 | 0,7206 | |||||
| TRV / The Travelers Companies, Inc. | 0,00 | 0,29 | 0,7141 | 0,7141 | |||||
| MNST / Monster Beverage Corporation | 0,00 | 0,29 | 0,7136 | 0,7136 | |||||
| C / Citigroup Inc. | 0,00 | 0,29 | 0,7135 | 0,7135 | |||||
| ICE / Intercontinental Exchange, Inc. | 0,00 | 0,00 | 0,29 | 6,32 | 0,7117 | −0,0790 | |||
| CAH / Cardinal Health, Inc. | 0,00 | 0,00 | 0,28 | 22,27 | 0,6960 | 0,0216 | |||
| BOX / Box, Inc. | 0,01 | 0,28 | 0,6875 | 0,6875 | |||||
| PRDO / Perdoceo Education Corporation | 0,01 | 0,28 | 0,6866 | 0,6866 | |||||
| STT / State Street Corporation | 0,00 | 0,28 | 0,6855 | 0,6855 | |||||
| MO / Altria Group, Inc. | 0,00 | 0,00 | 0,27 | −2,50 | 0,6800 | −0,1426 | |||
| GS / The Goldman Sachs Group, Inc. | 0,00 | 0,27 | 0,6789 | 0,6789 | |||||
| SPOT / Spotify Technology S.A. | 0,00 | 0,27 | 0,6789 | 0,6789 | |||||
| RBA / RB Global, Inc. | 0,00 | 0,00 | 0,27 | 5,84 | 0,6766 | −0,0786 | |||
| FWONA / Formula One Group | 0,00 | 0,27 | 0,6766 | 0,6766 | |||||
| RSG / Republic Services, Inc. | 0,00 | 0,00 | 0,27 | 1,87 | 0,6760 | −0,1084 | |||
| CME / CME Group Inc. | 0,00 | 0,00 | 0,27 | 3,83 | 0,6740 | −0,0926 | |||
| NEU / NewMarket Corporation | 0,00 | 0,27 | 0,6679 | 0,6679 | |||||
| ORI / Old Republic International Corporation | 0,01 | 0,00 | 0,27 | −1,83 | 0,6673 | −0,1372 | |||
| FOXA / Fox Corporation | 0,00 | 0,00 | 0,27 | −1,11 | 0,6650 | −0,1287 | |||
| ARMK / Aramark | 0,01 | 0,27 | 0,6606 | 0,6606 | |||||
| SPNT / SiriusPoint Ltd. | 0,01 | 0,00 | 0,26 | 17,94 | 0,6552 | −0,0013 | |||
| LOPE / Grand Canyon Education, Inc. | 0,00 | 0,00 | 0,26 | 9,13 | 0,6552 | −0,0536 | |||
| HIG / The Hartford Insurance Group, Inc. | 0,00 | 0,00 | 0,26 | 2,73 | 0,6536 | −0,0996 | |||
| ALL / The Allstate Corporation | 0,00 | 0,00 | 0,26 | −2,97 | 0,6509 | −0,1402 | |||
| ETR / Entergy Corporation | 0,00 | 0,00 | 0,26 | −2,97 | 0,6507 | −0,1401 | |||
| HWM / Howmet Aerospace Inc. | 0,00 | 0,26 | 0,6499 | 0,6499 | |||||
| ATO / Atmos Energy Corporation | 0,00 | 0,00 | 0,26 | −0,39 | 0,6427 | −0,1191 | |||
| EQH / Equitable Holdings, Inc. | 0,00 | 0,00 | 0,26 | 7,50 | 0,6424 | −0,0624 | |||
| RBLX / Roblox Corporation | 0,00 | 0,26 | 0,6424 | 0,6424 | |||||
| COR / Cencora, Inc. | 0,00 | 0,00 | 0,26 | 7,98 | 0,6401 | −0,0614 | |||
| HEI / HEICO Corporation | 0,00 | 0,26 | 0,6399 | 0,6399 | |||||
| HEIA / Heico Corp. - Class A | 0,00 | 0,00 | 0,26 | 22,49 | 0,6372 | 0,0233 | |||
| AIG / American International Group, Inc. | 0,00 | 0,00 | 0,26 | −1,54 | 0,6353 | −0,1273 | |||
| ITRI / Itron, Inc. | 0,00 | 0,26 | 0,6346 | 0,6346 | |||||
| RBC / RBC Bearings Incorporated | 0,00 | 0,00 | 0,25 | 19,81 | 0,6321 | 0,0075 | |||
| TW / Tradeweb Markets Inc. | 0,00 | 0,00 | 0,25 | −1,56 | 0,6305 | −0,1250 | |||
| PSTL / Postal Realty Trust, Inc. | 0,02 | 0,25 | 0,6275 | 0,6275 | |||||
| L / Loews Corporation | 0,00 | 0,00 | 0,25 | −0,40 | 0,6225 | −0,1151 | |||
| EHC / Encompass Health Corporation | 0,00 | 0,00 | 0,25 | 20,87 | 0,6205 | 0,0149 | |||
| MIR / Mirion Technologies, Inc. | 0,01 | 0,00 | 0,25 | 48,21 | 0,6203 | 0,1267 | |||
| BR / Broadridge Financial Solutions, Inc. | 0,00 | 0,00 | 0,25 | 0,40 | 0,6173 | −0,1104 | |||
| USFD / US Foods Holding Corp. | 0,00 | 0,00 | 0,25 | 17,54 | 0,6172 | −0,0027 | |||
| DUK / Duke Energy Corporation | 0,00 | 0,00 | 0,25 | −3,52 | 0,6161 | −0,1364 | |||
| GHC / Graham Holdings Company | 0,00 | 0,00 | 0,25 | −1,59 | 0,6161 | −0,1232 | |||
| NDAQ / Nasdaq, Inc. | 0,00 | 0,73 | 0,25 | 18,84 | 0,6118 | 0,0029 | |||
| VRSK / Verisk Analytics, Inc. | 0,00 | 0,00 | 0,25 | 4,68 | 0,6116 | −0,0789 | |||
| ROAD / Construction Partners, Inc. | 0,00 | 0,25 | 0,6106 | 0,6106 | |||||
| PPL / PPL Corporation | 0,01 | 0,00 | 0,25 | −6,13 | 0,6104 | −0,1581 | |||
| HWKN / Hawkins, Inc. | 0,00 | 0,25 | 0,6095 | 0,6095 | |||||
| GILD / Gilead Sciences, Inc. | 0,00 | 0,00 | 0,24 | −1,21 | 0,6075 | −0,1180 | |||
| AFL / Aflac Incorporated | 0,00 | 0,00 | 0,24 | −5,10 | 0,6033 | −0,1483 | |||
| LNG / Cheniere Energy, Inc. | 0,00 | 0,00 | 0,24 | 5,22 | 0,6022 | −0,0740 | |||
| CWST / Casella Waste Systems, Inc. | 0,00 | 0,00 | 0,24 | 3,45 | 0,5981 | −0,0849 | |||
| FWONK / Formula One Group | 0,00 | 0,24 | 0,5978 | 0,5978 | |||||
| WTW / Willis Towers Watson Public Limited Company | 0,00 | 0,00 | 0,24 | −9,47 | 0,5956 | −0,1804 | |||
| CTAS / Cintas Corporation | 0,00 | 0,24 | 0,5948 | 0,5948 | |||||
| CSV / Carriage Services, Inc. | 0,01 | 0,24 | 0,5938 | 0,5938 | |||||
| CBOE / Cboe Global Markets, Inc. | 0,00 | 0,00 | 0,24 | 3,03 | 0,5923 | −0,0868 | |||
| ECL / Ecolab Inc. | 0,00 | 0,00 | 0,24 | 6,28 | 0,5906 | −0,0660 | |||
| NTRS / Northern Trust Corporation | 0,00 | 0,24 | 0,5895 | 0,5895 | |||||
| TPB / Turning Point Brands, Inc. | 0,00 | 0,24 | 0,5873 | 0,5873 | |||||
| SO / The Southern Company | 0,00 | 0,00 | 0,24 | 0,00 | 0,5872 | −0,1076 | |||
| SBRA / Sabra Health Care REIT, Inc. | 0,01 | 0,00 | 0,24 | 5,83 | 0,5868 | −0,0701 | |||
| ENVA / Enova International, Inc. | 0,00 | 0,00 | 0,23 | 15,27 | 0,5831 | −0,0135 | |||
| SPR / Spirit AeroSystems Holdings, Inc. | 0,01 | 0,23 | 0,5823 | 0,5823 | |||||
| EVRG / Evergy, Inc. | 0,00 | 0,00 | 0,23 | 0,00 | 0,5817 | −0,1059 | |||
| CCK / Crown Holdings, Inc. | 0,00 | 0,23 | 0,5791 | 0,5791 | |||||
| ESQ / Esquire Financial Holdings, Inc. | 0,00 | 0,23 | 0,5782 | 0,5782 | |||||
| OGS / ONE Gas, Inc. | 0,00 | 0,23 | 0,5754 | 0,5754 | |||||
| TDG / TransDigm Group Incorporated | 0,00 | 0,00 | 0,23 | 10,00 | 0,5744 | −0,0430 | |||
| NFG / National Fuel Gas Company | 0,00 | 0,00 | 0,23 | 6,98 | 0,5737 | −0,0600 | |||
| APG / APi Group Corporation | 0,00 | 0,23 | 0,5718 | 0,5718 | |||||
| CB / Chubb Limited | 0,00 | 0,00 | 0,23 | −3,77 | 0,5717 | −0,1325 | |||
| EPR / EPR Properties | 0,00 | 0,00 | 0,23 | 10,68 | 0,5674 | −0,0380 | |||
| GE / General Electric Company | 0,00 | 0,23 | 0,5674 | 0,5674 | |||||
| BLX / Banco Latinoamericano de Comercio Exterior, S. A. | 0,01 | 0,00 | 0,23 | 10,14 | 0,5674 | −0,0415 | |||
| VRSN / VeriSign, Inc. | 0,00 | 0,00 | 0,23 | 13,50 | 0,5663 | −0,0219 | |||
| WEC / WEC Energy Group, Inc. | 0,00 | 0,00 | 0,23 | −4,64 | 0,5637 | −0,1330 | |||
| FCFS / FirstCash Holdings, Inc. | 0,00 | 0,23 | 0,5635 | 0,5635 | |||||
| FSS / Federal Signal Corporation | 0,00 | 0,23 | 0,5625 | 0,5625 | |||||
| SENEA / Seneca Foods Corporation | 0,00 | 0,23 | 0,5603 | 0,5603 | |||||
| YUM / Yum! Brands, Inc. | 0,00 | 0,00 | 0,23 | −5,86 | 0,5594 | −0,1426 | |||
| IDA / IDACORP, Inc. | 0,00 | 0,00 | 0,23 | −0,44 | 0,5592 | −0,1060 | |||
| MMC / Marsh & McLennan Companies, Inc. | 0,00 | 0,00 | 0,22 | −10,40 | 0,5586 | −0,1781 | |||
| PEG / Public Service Enterprise Group Incorporated | 0,00 | 0,00 | 0,22 | 2,28 | 0,5584 | −0,0867 | |||
| INTU / Intuit Inc. | 0,00 | 0,22 | 0,5579 | 0,5579 | |||||
| OTIS / Otis Worldwide Corporation | 0,00 | 0,00 | 0,22 | −4,29 | 0,5564 | −0,1288 | |||
| VCTR / Victory Capital Holdings, Inc. | 0,00 | 0,00 | 0,22 | 10,40 | 0,5549 | −0,0411 | |||
| WM / Waste Management, Inc. | 0,00 | 0,00 | 0,22 | −1,33 | 0,5539 | −0,1083 | |||
| DASH / DoorDash, Inc. | 0,00 | 0,22 | 0,5526 | 0,5526 | |||||
| ATRO / Astronics Corporation | 0,01 | 0,22 | 0,5519 | 0,5519 | |||||
| POST / Post Holdings, Inc. | 0,00 | 0,00 | 0,22 | −6,36 | 0,5503 | −0,1437 | |||
| REVG / REV Group, Inc. | 0,00 | 0,22 | 0,5498 | 0,5498 | |||||
| DTE / DTE Energy Company | 0,00 | 0,00 | 0,22 | −4,35 | 0,5484 | −0,1280 | |||
| CW / Curtiss-Wright Corporation | 0,00 | 0,22 | 0,5476 | 0,5476 | |||||
| JCI / Johnson Controls International plc | 0,00 | 0,22 | 0,5462 | 0,5462 | |||||
| ROL / Rollins, Inc. | 0,00 | 0,00 | 0,22 | 4,78 | 0,5447 | −0,0717 | |||
| MTG / MGIC Investment Corporation | 0,01 | 0,22 | 0,5435 | 0,5435 | |||||
| TTWO / Take-Two Interactive Software, Inc. | 0,00 | 0,22 | 0,5432 | 0,5432 | |||||
| ADC / Agree Realty Corporation | 0,00 | 0,00 | 0,22 | −5,22 | 0,5429 | −0,1349 | |||
| ACT / Enact Holdings, Inc. | 0,01 | 0,00 | 0,22 | 6,86 | 0,5426 | −0,0571 | |||
| NMIH / NMI Holdings, Inc. | 0,01 | 0,22 | 0,5422 | 0,5422 | |||||
| OGE / OGE Energy Corp. | 0,00 | 0,00 | 0,22 | −3,11 | 0,5419 | −0,1212 | |||
| TDY / Teledyne Technologies Incorporated | 0,00 | 0,00 | 0,22 | 2,84 | 0,5411 | −0,0801 | |||
| CHCO / City Holding Company | 0,00 | 0,00 | 0,22 | 4,33 | 0,5409 | −0,0724 | |||
| IDT / IDT Corporation | 0,00 | 0,22 | 0,5403 | 0,5403 | |||||
| SYK / Stryker Corporation | 0,00 | 0,00 | 0,22 | 6,37 | 0,5398 | −0,0604 | |||
| DRI / Darden Restaurants, Inc. | 0,00 | 0,00 | 0,22 | 4,88 | 0,5357 | −0,0677 | |||
| COF / Capital One Financial Corporation | 0,00 | 0,21 | 0,5335 | 0,5335 | |||||
| UTI / Universal Technical Institute, Inc. | 0,01 | 0,21 | 0,5316 | 0,5316 | |||||
| PNW / Pinnacle West Capital Corporation | 0,00 | 0,00 | 0,21 | −6,17 | 0,5307 | −0,1369 | |||
| LNT / Alliant Energy Corporation | 0,00 | 0,00 | 0,21 | −6,19 | 0,5293 | −0,1363 | |||
| GWRE / Guidewire Software, Inc. | 0,00 | 0,21 | 0,5254 | 0,5254 | |||||
| ZS / Zscaler, Inc. | 0,00 | 0,21 | 0,5235 | 0,5235 | |||||
| GATX / GATX Corporation | 0,00 | 0,00 | 0,21 | −0,94 | 0,5224 | −0,1018 | |||
| NTB / The Bank of N.T. Butterfield & Son Limited | 0,00 | 0,21 | 0,5218 | 0,5218 | |||||
| AVA / Avista Corporation | 0,01 | 0,21 | 0,5193 | 0,5193 | |||||
| CPNG / Coupang, Inc. | 0,01 | 0,21 | 0,5166 | 0,5166 | |||||
| BBSI / Barrett Business Services, Inc. | 0,00 | 0,00 | 0,21 | 0,98 | 0,5164 | −0,0859 | |||
| TKO / TKO Group Holdings, Inc. | 0,00 | 0,21 | 0,5159 | 0,5159 | |||||
| IVT / InvenTrust Properties Corp. | 0,01 | 0,00 | 0,21 | −6,76 | 0,5156 | −0,1375 | |||
| SLM / SLM Corporation | 0,01 | 0,21 | 0,5154 | 0,5154 | |||||
| KTOS / Kratos Defense & Security Solutions, Inc. | 0,00 | 0,21 | 0,5152 | 0,5152 | |||||
| CMS / CMS Energy Corporation | 0,00 | 0,00 | 0,21 | −7,62 | 0,5134 | −0,1443 | |||
| AEE / Ameren Corporation | 0,00 | 0,00 | 0,21 | −4,19 | 0,5124 | −0,1206 | |||
| NOC / Northrop Grumman Corporation | 0,00 | 0,21 | 0,5119 | 0,5119 | |||||
| INSM / Insmed Incorporated | 0,00 | 0,21 | 0,5105 | 0,5105 | |||||
| PBH / Prestige Consumer Healthcare Inc. | 0,00 | 0,00 | 0,21 | −7,24 | 0,5102 | −0,1389 | |||
| GPI / Group 1 Automotive, Inc. | 0,00 | 0,20 | 0,5068 | 0,5068 | |||||
| WDC / Western Digital Corporation | 0,00 | 0,20 | 0,5065 | 0,5065 | |||||
| WWD / Woodward, Inc. | 0,00 | 0,20 | 0,5055 | 0,5055 | |||||
| BJRI / BJ's Restaurants, Inc. | 0,00 | 0,20 | 0,5052 | 0,5052 | |||||
| CNP / CenterPoint Energy, Inc. | 0,01 | 0,20 | 0,5036 | 0,5036 | |||||
| FAST / Fastenal Company | 0,00 | 0,20 | 0,5035 | 0,5035 | |||||
| TT / Trane Technologies plc | 0,00 | 0,20 | 0,5011 | 0,5011 | |||||
| SXT / Sensient Technologies Corporation | 0,00 | 0,20 | 0,5007 | 0,5007 | |||||
| LH / Labcorp Holdings Inc. | 0,00 | 0,20 | 0,5004 | 0,5004 | |||||
| BWXT / BWX Technologies, Inc. | 0,00 | 0,20 | 0,4991 | 0,4991 | |||||
| JBL / Jabil Inc. | 0,00 | 0,20 | 0,4986 | 0,4986 | |||||
| FE / FirstEnergy Corp. | 0,00 | 0,00 | 0,20 | −0,50 | 0,4982 | −0,0928 | |||
| PAYX / Paychex, Inc. | 0,00 | 0,00 | 0,20 | −5,66 | 0,4970 | −0,1259 | |||
| EFC / Ellington Financial Inc. | 0,01 | 0,00 | 0,19 | −2,04 | 0,4777 | −0,0985 | |||
| SGHC / Super Group (SGHC) Limited | 0,02 | 0,19 | 0,4632 | 0,4632 | |||||
| DHT / DHT Holdings, Inc. | 0,02 | 0,19 | 0,4628 | 0,4628 | |||||
| CTO / CTO Realty Growth, Inc. | 0,01 | 0,00 | 0,19 | −10,63 | 0,4614 | −0,1486 | |||
| PMT / PennyMac Mortgage Investment Trust | 0,01 | 0,00 | 0,16 | −11,89 | 0,4054 | −0,1403 | |||
| GCMG / GCM Grosvenor Inc. | 0,01 | 0,00 | 0,16 | −12,85 | 0,3898 | −0,1373 | |||
| LADR / Ladder Capital Corp | 0,01 | 0,00 | 0,15 | −5,52 | 0,3828 | −0,0973 | |||
| OOMA / Ooma, Inc. | 0,01 | 0,15 | 0,3665 | 0,3665 | |||||
| NWBI / Northwest Bancshares, Inc. | 0,01 | 0,00 | 0,14 | 6,25 | 0,3404 | −0,0379 | |||
| EPRT / Essential Properties Realty Trust, Inc. | 0,00 | −100,00 | 0,00 | 0,0000 | |||||
| MCO / Moody's Corporation | 0,00 | −100,00 | 0,00 | 0,0000 | |||||
| HBAN / Huntington Bancshares Incorporated | 0,00 | −100,00 | 0,00 | 0,0000 | |||||
| PX / P10, Inc. | 0,00 | −100,00 | 0,00 | 0,0000 | |||||
| RL / Ralph Lauren Corporation | 0,00 | −100,00 | 0,00 | 0,0000 | |||||
| NWE / NorthWestern Energy Group, Inc. | 0,00 | −100,00 | 0,00 | 0,0000 | |||||
| FNF / Fidelity National Financial, Inc. | 0,00 | −100,00 | 0,00 | 0,0000 | |||||
| WSO / Watsco, Inc. | 0,00 | −100,00 | 0,00 | 0,0000 | |||||
| MMSI / Merit Medical Systems, Inc. | 0,00 | −100,00 | 0,00 | 0,0000 | |||||
| AGNC / AGNC Investment Corp. | 0,00 | −100,00 | 0,00 | 0,0000 | |||||
| AEP / American Electric Power Company, Inc. | 0,00 | −100,00 | 0,00 | 0,0000 | |||||
| RGA / Reinsurance Group of America, Incorporated | 0,00 | −100,00 | 0,00 | 0,0000 | |||||
| FI / Fiserv, Inc. | 0,00 | −100,00 | 0,00 | 0,0000 | |||||
| NLY / Annaly Capital Management, Inc. | 0,00 | −100,00 | 0,00 | 0,0000 | |||||
| HURN / Huron Consulting Group Inc. | 0,00 | −100,00 | 0,00 | 0,0000 | |||||
| ATGE / Adtalem Global Education Inc. | 0,00 | −100,00 | 0,00 | 0,0000 | |||||
| REG / Regency Centers Corporation | 0,00 | −100,00 | 0,00 | 0,0000 | |||||
| FNB / F.N.B. Corporation | 0,00 | −100,00 | 0,00 | 0,0000 | |||||
| APH / Amphenol Corporation | 0,00 | −100,00 | 0,00 | 0,0000 | |||||
| SNA / Snap-on Incorporated | 0,00 | −100,00 | 0,00 | 0,0000 | |||||
| OHI / Omega Healthcare Investors, Inc. | 0,00 | −100,00 | 0,00 | 0,0000 | |||||
| TXRH / Texas Roadhouse, Inc. | 0,00 | −100,00 | 0,00 | 0,0000 | |||||
| EMR / Emerson Electric Co. | 0,00 | −100,00 | 0,00 | 0,0000 | |||||
| AWI / Armstrong World Industries, Inc. | 0,00 | −100,00 | 0,00 | 0,0000 | |||||
| MET / MetLife, Inc. | 0,00 | −100,00 | 0,00 | 0,0000 | |||||
| AIZ / Assurant, Inc. | 0,00 | −100,00 | 0,00 | 0,0000 | |||||
| AON / Aon plc | 0,00 | −100,00 | 0,00 | 0,0000 | |||||
| BRO / Brown & Brown, Inc. | 0,00 | −100,00 | 0,00 | 0,0000 | |||||
| R / Ryder System, Inc. | 0,00 | −100,00 | 0,00 | 0,0000 | |||||
| XEL / Xcel Energy Inc. | 0,00 | −100,00 | 0,00 | 0,0000 | |||||
| CBL / CBL & Associates Properties, Inc. | 0,00 | −100,00 | 0,00 | 0,0000 | |||||
| SPGI / S&P Global Inc. | 0,00 | −100,00 | 0,00 | 0,0000 | |||||
| DRS / Leonardo DRS, Inc. | 0,00 | −100,00 | 0,00 | 0,0000 | |||||
| ITW / Illinois Tool Works Inc. | 0,00 | −100,00 | 0,00 | 0,0000 | |||||
| COOP / Mr. Cooper Group Inc. | 0,00 | −100,00 | 0,00 | 0,0000 | |||||
| CNA / CNA Financial Corporation | 0,00 | −100,00 | 0,00 | 0,0000 | |||||
| DOV / Dover Corporation | 0,00 | −100,00 | 0,00 | 0,0000 | |||||
| GEN / Gen Digital Inc. | 0,00 | −100,00 | 0,00 | 0,0000 | |||||
| WSR / Whitestone REIT | 0,00 | −100,00 | 0,00 | 0,0000 | |||||
| GLW / Corning Incorporated | 0,00 | −100,00 | 0,00 | 0,0000 | |||||
| SPG / Simon Property Group, Inc. | 0,00 | −100,00 | 0,00 | 0,0000 | |||||
| PH / Parker-Hannifin Corporation | 0,00 | −100,00 | 0,00 | 0,0000 | |||||
| RPM / RPM International Inc. | 0,00 | −100,00 | 0,00 | 0,0000 | |||||
| RITM / Rithm Capital Corp. | 0,00 | −100,00 | 0,00 | 0,0000 | |||||
| MSI / Motorola Solutions, Inc. | 0,00 | −100,00 | 0,00 | 0,0000 | |||||
| FBRT / Franklin BSP Realty Trust, Inc. | 0,00 | −100,00 | 0,00 | 0,0000 | |||||
| SSNC / SS&C Technologies Holdings, Inc. | 0,00 | −100,00 | 0,00 | 0,0000 | |||||
| DX / Dynex Capital, Inc. | 0,00 | −100,00 | 0,00 | 0,0000 | |||||
| ED / Consolidated Edison, Inc. | 0,00 | −100,00 | 0,00 | 0,0000 | |||||
| HON / Honeywell International Inc. | 0,00 | −100,00 | 0,00 | 0,0000 | |||||
| CHD / Church & Dwight Co., Inc. | 0,00 | −100,00 | 0,00 | 0,0000 | |||||
| WAB / Westinghouse Air Brake Technologies Corporation | 0,00 | −100,00 | 0,00 | 0,0000 | |||||
| VTR / Ventas, Inc. | 0,00 | −100,00 | 0,00 | 0,0000 | |||||
| FCF / First Commonwealth Financial Corporation | 0,00 | −100,00 | 0,00 | 0,0000 | |||||
| KMB / Kimberly-Clark Corporation | 0,00 | −100,00 | 0,00 | 0,0000 | |||||
| SNEX / StoneX Group Inc. | 0,00 | −100,00 | 0,00 | 0,0000 | |||||
| BRX / Brixmor Property Group Inc. | 0,00 | −100,00 | 0,00 | 0,0000 | |||||
| FCPT / Four Corners Property Trust, Inc. | 0,00 | −100,00 | 0,00 | 0,0000 |