Grunnleggende statistikk
| Innsiderprofil | KKR Credit Advisors (US) LLC |
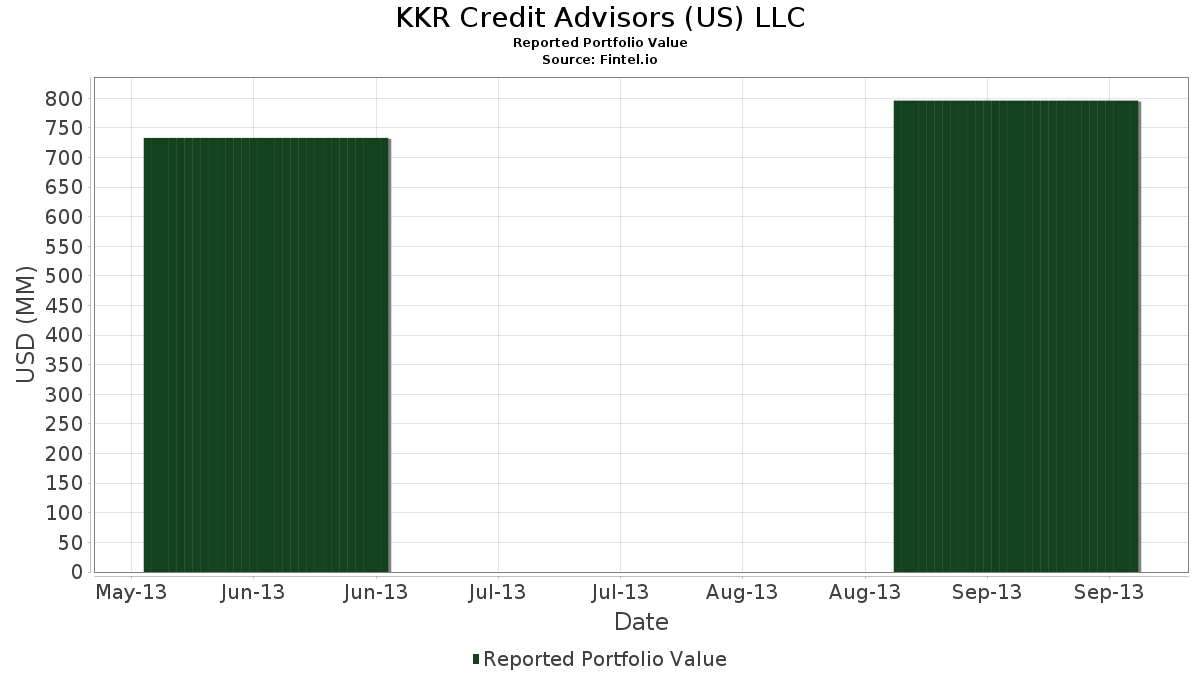
| Porteføljeverdi | $ 796 306 000 |
| Nåværende posisjoner | 63 |
Siste beholdninger, prestasjoner, forvaltet kapital (fra 13F, 13D)
KKR Credit Advisors (US) LLC har oppgitt 63 totale beholdninger i sine siste SEC-arkiveringer. Siste porteføljeverdi er beregnet til 796 306 000 USD. Faktisk forvaltet kapital (AUM) er denne verdien pluss kontanter (som ikke er oppgitt). KKR Credit Advisors (US) LLCs største beholdninger er Masonite International Corporation (US:DOOR) , Amedisys, Inc. (US:AMED) , Verint Systems Inc. (US:VRNT) , Wyndham Destinations, Inc. (US:) , and Comcast Corporation (US:CMCSA) . KKR Credit Advisors (US) LLCs nye posisjoner inkluderer Masonite International Corporation (US:DOOR) , Wyndham Destinations, Inc. (US:) , Lamar Advertising Company (US:LAMR) , Cameron International Corporation (US:CAM) , and Stillwater Mining Company (US:SWC) .
De største økningene dette kvartalet
Vi bruker endringen i porteføljeallokeringen fordi dette er det mest meningsfulle målet. Endringer kan skyldes handler eller endringer i aksjekursene.
| Verdipapirer | Aksjer (MM) |
Verdi (MM$) |
Portefølje % | ΔPortefølje % |
|---|---|---|---|---|
| 1,24 | 60,54 | 7,6021 | 7,6021 | |
| 2,92 | 50,21 | 6,3056 | 5,1007 | |
| 0,78 | 28,97 | 3,6378 | 3,6378 | |
| 0,47 | 28,66 | 3,5986 | 3,5986 | |
| 0,52 | 22,37 | 2,8096 | 2,8096 | |
| 0,45 | 21,16 | 2,6578 | 2,6578 | |
| 0,12 | 19,45 | 2,4420 | 2,4420 | |
| 0,33 | 19,09 | 2,3969 | 2,3969 | |
| 0,02 | 18,66 | 2,3429 | 2,3429 | |
| 1,67 | 18,38 | 2,3077 | 2,3077 |
De største reduksjonene dette kvartalet
Vi bruker endringen i porteføljeallokeringen fordi dette er det mest meningsfulle målet. Endringer kan skyldes handler eller endringer i aksjekurser.
| Verdipapirer | Aksjer (MM) |
Verdi (MM$) |
Portefølje % | ΔPortefølje % |
|---|---|---|---|---|
| 0,00 | 0,00 | −2,4618 | ||
| 0,00 | 0,00 | −2,1002 | ||
| 0,00 | 0,00 | −2,0120 | ||
| 0,00 | 0,00 | −1,9392 | ||
| 0,00 | 0,00 | −1,3642 | ||
| 0,00 | 0,00 | −0,9732 | ||
| 0,11 | 9,44 | 1,1851 | −0,7655 | |
| 0,00 | 0,00 | −0,3220 | ||
| 0,00 | 0,00 | −0,0803 | ||
| 0,33 | 15,33 | 1,9254 | −0,0374 |
13F- og Fondsarkiveringer
Dette skjemaet ble sendt inn den 2013-11-14 for rapporteringsperioden 2013-09-30. Klikk på lenkeikonet for å se hele transaksjonshistorikken.
Oppgradere for å låse opp premiedata og eksportere til Excel![]() .
.
| Verdipapirer | Type | Gjennomsnittlig aksjekurs | Aksjer (MM) |
ΔAksjer (%) |
ΔAksjer (%) |
Verdi ($MM) |
Portefølje (%) |
ΔPortefølje (%) |
|
|---|---|---|---|---|---|---|---|---|---|
| DOOR / Masonite International Corporation | 1,24 | 60,54 | 7,6021 | 7,6021 | |||||
| AMED / Amedisys, Inc. | 2,92 | 283,52 | 50,21 | 468,33 | 6,3056 | 5,1007 | |||
| VRNT / Verint Systems Inc. | 0,78 | −52,51 | 28,97 | −50,39 | 3,6378 | 3,6378 | |||
| / Wyndham Destinations, Inc. | 0,47 | 28,66 | 3,5986 | 3,5986 | |||||
| CMCSA / Comcast Corporation | 0,54 | 55,88 | 24,45 | 68,45 | 3,0707 | 1,0910 | |||
| CIT / CIT Group Inc | 0,49 | 8,92 | 23,95 | 13,91 | 3,0071 | 0,1403 | |||
| RLGY / Realogy Holdings Corp | 0,52 | 31,06 | 22,37 | 17,37 | 2,8096 | 2,8096 | |||
| LAMR / Lamar Advertising Company | Call | 0,45 | 21,16 | 2,6578 | 2,6578 | ||||
| GM / General Motors Company | 0,59 | 0,00 | 21,16 | 7,98 | 2,6566 | −0,0151 | |||
| COMVERSE INC / (20585P105) | 0,62 | 19,70 | 0,0000 | ||||||
| PPG / PPG Industries, Inc. | 0,12 | −13,39 | 19,45 | −1,18 | 2,4420 | 2,4420 | |||
| PTEN / Patterson-UTI Energy, Inc. | 0,90 | 227,86 | 19,22 | 262,18 | 2,4138 | 1,6900 | |||
| ENB / Enbridge Inc. | 0,46 | 16,57 | 19,20 | 15,66 | 2,4111 | 0,1471 | |||
| CAM / Cameron International Corporation | 0,33 | 19,09 | 2,3969 | 2,3969 | |||||
| GOOGL / Alphabet Inc. | 0,02 | −0,47 | 18,66 | −0,97 | 2,3429 | 2,3429 | |||
| SWC / Stillwater Mining Company | 1,67 | 18,38 | 2,3077 | 2,3077 | |||||
| UNP / Union Pacific Corporation | 0,12 | 92,68 | 17,99 | 94,00 | 2,2589 | 0,9944 | |||
| APD / Air Products and Chemicals, Inc. | 0,15 | 15,68 | 1,9686 | 1,9686 | |||||
| NWSA / News Corporation | 0,97 | 229,39 | 15,66 | 246,90 | 1,9665 | 1,3508 | |||
| LAMR / Lamar Advertising Company | 0,33 | −1,72 | 15,33 | 6,53 | 1,9254 | −0,0374 | |||
| ITT / ITT Inc. | 0,41 | 14,56 | 1,8284 | 1,8284 | |||||
| FDX / FedEx Corporation | 0,13 | 14,44 | 1,8127 | 1,8127 | |||||
| EBAY / eBay Inc. | 0,26 | −54,62 | 14,26 | −51,04 | 1,7903 | 1,7903 | |||
| PCP / Precision Castparts Corporation | 0,06 | −1,90 | 14,09 | −1,37 | 1,7693 | 1,7693 | |||
| HAL / Halliburton Company | 0,29 | 165,08 | 13,96 | 205,96 | 1,7536 | 1,1312 | |||
| BEAM / Beam Therapeutics Inc. | 0,20 | −9,24 | 12,99 | −7,03 | 1,6319 | 1,6319 | |||
| EXP / Eagle Materials Inc. | 0,17 | −35,41 | 12,48 | −29,29 | 1,5671 | 1,5671 | |||
| HES / Hess Corporation | 0,15 | −30,27 | 11,92 | −18,89 | 1,4967 | 1,4967 | |||
| MDLZ / Mondelez International, Inc. | 0,37 | 11,69 | 1,4679 | 1,4679 | |||||
| XLV / The Select Sector SPDR Trust - The Health Care Select Sector SPDR Fund | 0,23 | −16,44 | 11,65 | −11,20 | 1,4631 | 1,4631 | |||
| MS / Morgan Stanley | 0,40 | 10,72 | 1,3463 | 1,3463 | |||||
| EMC / Global X Funds - Global X Emerging Markets Great Consumer ETF | 0,42 | 25,75 | 10,68 | 36,08 | 1,3417 | 0,2710 | |||
| CX / CEMEX, S.A.B. de C.V. - Depositary Receipt (Common Stock) | 0,94 | 10,51 | 1,3197 | 1,3197 | |||||
| AAP / Advance Auto Parts, Inc. | 0,12 | 9,91 | 1,2449 | 1,2449 | |||||
| EOG / EOG Resources, Inc. | 0,06 | −35,59 | 9,84 | −17,20 | 1,2351 | 1,2351 | |||
| ETN / Eaton Corporation plc | 0,14 | 9,78 | 1,2275 | 1,2275 | |||||
| HD / The Home Depot, Inc. | 0,13 | −27,09 | 9,51 | −28,62 | 1,1945 | 1,1945 | |||
| WBC / Wabco Holdings, Inc. | 0,11 | −41,51 | 9,44 | −34,02 | 1,1851 | −0,7655 | |||
| OMC / Omnicom Group Inc. | 0,15 | 9,27 | 1,1640 | 1,1640 | |||||
| VSI / Vitamin Shoppe, Inc. | 0,21 | 308,31 | 9,11 | 298,34 | 1,1440 | 0,8321 | |||
| GM.WS.A / General Motors Company | 0,31 | 0,00 | 8,25 | 10,08 | 1,0365 | 1,0365 | |||
| BEAV / B/E Aerospace, Inc. | 0,10 | −55,90 | 7,28 | −48,39 | 0,9141 | 0,9141 | |||
| JAH / Jarden Corporation | 0,15 | 7,26 | 0,9117 | 0,9117 | |||||
| RLGY / Realogy Holdings Corp | Call | 0,16 | 6,88 | 0,8644 | 0,8644 | ||||
| TWC / Spectrum Management Holding Company LLC | 0,06 | −59,34 | 6,88 | −59,66 | 0,8634 | 0,8634 | |||
| PRU / Prudential Financial, Inc. | 0,08 | 6,54 | 0,8217 | 0,8217 | |||||
| MET / MetLife, Inc. | 0,14 | 6,54 | 0,8213 | 0,8213 | |||||
| GM.WS.B / General Motors Company - Warrants 07/10/2019 | 0,31 | 0,00 | 5,81 | 13,76 | 0,7297 | 0,7297 | |||
| HP / Helmerich & Payne, Inc. | 0,05 | 3,72 | 0,4675 | 0,4675 | |||||
| BHI / Baker Hughes Inc. | 0,07 | −26,83 | 3,68 | −22,10 | 0,4625 | 0,4625 | |||
| PM / Philip Morris International Inc. | 0,04 | 3,55 | 0,4458 | 0,4458 | |||||
| / Wyndham Destinations, Inc. | 0,18 | 3,54 | 0,4444 | 0,4444 | |||||
| US20605P1012 / Concho Resources, Inc. | 0,03 | 3,11 | 0,3908 | 0,3908 | |||||
| GTIV / Gentiva Health Services Inc | 0,19 | 2,24 | 0,2812 | 0,2812 | |||||
| JO / Barclays Bank PLC - ZC SP ETN REDEEM 23/01/2048 USD 50 - Ser B_BJO | 0,08 | 2,07 | 0,2603 | 0,2603 | |||||
| ATHL / | 0,04 | 1,42 | 0,1782 | 0,1782 | |||||
| EWZ / iShares, Inc. - iShares MSCI Brazil ETF | 0,03 | 1,32 | 0,1660 | 0,1660 | |||||
| LPI / Laredo Petroleum Inc. | 0,04 | 1,21 | 0,1525 | 0,1525 | |||||
| XEC / Cimarex Energy Co. | 0,01 | 1,20 | 0,1501 | 0,1501 | |||||
| EWW / iShares, Inc. - iShares MSCI Mexico ETF | 0,02 | 1,17 | 0,1468 | 0,1468 | |||||
| GLDD / Great Lakes Dredge & Dock Corporation | 0,12 | 0,00 | 0,85 | −5,12 | 0,1071 | 0,1071 | |||
| ESSX / Essex Rental Corp. | 0,20 | 0,70 | 0,0874 | 0,0874 | |||||
| AGO / Assured Guaranty Ltd. | 0,03 | 0,47 | 0,0593 | 0,0593 | |||||
| TPR / Tapestry, Inc. | Put | 0,00 | −100,00 | 0,00 | −100,00 | −0,9732 | |||
| IP / International Paper Company | 0,00 | −100,00 | 0,00 | −100,00 | 0,0000 | 0,0000 | |||
| SPB / Spectrum Brands Holdings, Inc. | 0,00 | −100,00 | 0,00 | −100,00 | 0,0000 | 0,0000 | |||
| QCOM / QUALCOMM Incorporated | 0,00 | −100,00 | 0,00 | −100,00 | 0,0000 | 0,0000 | |||
| CVC / Cablevision Systems Corp. | 0,00 | −100,00 | 0,00 | −100,00 | −0,0803 | ||||
| XHB / SPDR Series Trust - SPDR S&P Homebuilders ETF | Call | 0,00 | −100,00 | 0,00 | −100,00 | 0,0000 | 0,0000 | ||
| EVTC / EVERTEC, Inc. | 0,00 | −100,00 | 0,00 | −100,00 | 0,0000 | ||||
| XLF / The Select Sector SPDR Trust - The Financial Select Sector SPDR Fund | 0,00 | −100,00 | 0,00 | −100,00 | −2,4618 | ||||
| MA / Mastercard Incorporated | 0,00 | −100,00 | 0,00 | −100,00 | 0,0000 | 0,0000 | |||
| SWN / Southwestern Energy Company | 0,00 | −100,00 | 0,00 | −100,00 | 0,0000 | ||||
| EQIX / Equinix, Inc. | 0,00 | −100,00 | 0,00 | −100,00 | 0,0000 | 0,0000 | |||
| COST / Costco Wholesale Corporation | 0,00 | −100,00 | 0,00 | −100,00 | −1,9392 | ||||
| TSCO / Tractor Supply Company | 0,00 | −100,00 | 0,00 | −100,00 | −1,3642 | ||||
| TDG / TransDigm Group Incorporated | 0,00 | −100,00 | 0,00 | −100,00 | 0,0000 | ||||
| 00B65Z9D7 / Noble Corporation plc | 0,00 | −100,00 | 0,00 | −100,00 | 0,0000 | ||||
| CSCO / Cisco Systems, Inc. | Call | 0,00 | −100,00 | 0,00 | −100,00 | 0,0000 | |||
| V / Visa Inc. | 0,00 | −100,00 | 0,00 | −100,00 | 0,0000 | 0,0000 | |||
| WMB / The Williams Companies, Inc. | 0,00 | −100,00 | 0,00 | −100,00 | 0,0000 | ||||
| WMB / The Williams Companies, Inc. | Call | 0,00 | −100,00 | 0,00 | −100,00 | 0,0000 | |||
| CSCO / Cisco Systems, Inc. | 0,00 | −100,00 | 0,00 | −100,00 | 0,0000 | ||||
| PLCMP0000017 / Comp SA | 0,00 | −100,00 | 0,00 | −100,00 | −0,3220 | ||||
| AMT / American Tower Corporation | 0,00 | −100,00 | 0,00 | −100,00 | 0,0000 | ||||
| PLCMP0000017 / Comp SA | Call | 0,00 | −100,00 | 0,00 | −100,00 | −2,0120 | |||
| SHW / The Sherwin-Williams Company | Call | 0,00 | −100,00 | 0,00 | −100,00 | 0,0000 | 0,0000 | ||
| LOW / Lowe's Companies, Inc. | Call | 0,00 | −100,00 | 0,00 | −100,00 | 0,0000 | 0,0000 | ||
| LOW / Lowe's Companies, Inc. | 0,00 | −100,00 | 0,00 | −100,00 | 0,0000 | 0,0000 | |||
| AAPL / Apple Inc. | 0,00 | −100,00 | 0,00 | −100,00 | 0,0000 | 0,0000 | |||
| EEM / iShares, Inc. - iShares MSCI Emerging Markets ETF | Call | 0,00 | −100,00 | 0,00 | −100,00 | −2,1002 | |||
| AEO / American Eagle Outfitters, Inc. | 0,00 | −100,00 | 0,00 | −100,00 | 0,0000 | 0,0000 |