Grunnleggende statistikk
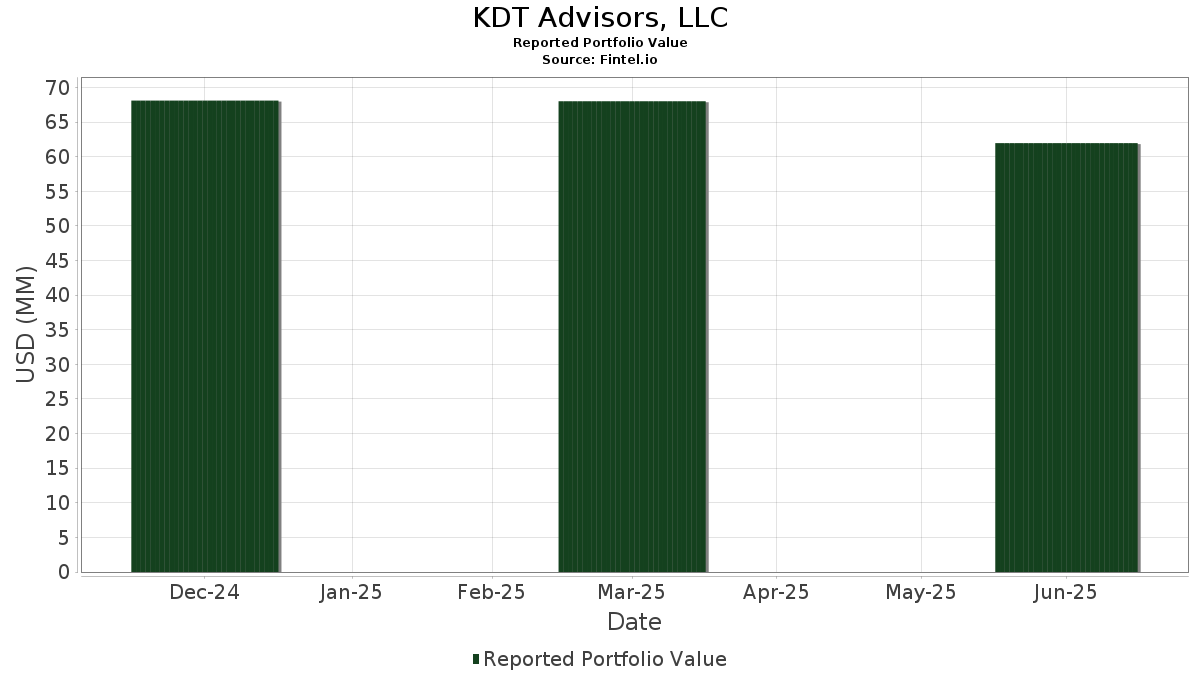
| Porteføljeverdi | $ 61 963 863 |
| Nåværende posisjoner | 67 |
Siste beholdninger, prestasjoner, forvaltet kapital (fra 13F, 13D)
KDT Advisors, LLC har oppgitt 67 totale beholdninger i sine siste SEC-arkiveringer. Siste porteføljeverdi er beregnet til 61 963 863 USD. Faktisk forvaltet kapital (AUM) er denne verdien pluss kontanter (som ikke er oppgitt). KDT Advisors, LLCs største beholdninger er Vanguard Index Funds - Vanguard S&P 500 ETF (US:VOO) , Microsoft Corporation (US:MSFT) , Apple Inc. (US:AAPL) , Vanguard Whitehall Funds - Vanguard High Dividend Yield ETF (US:VYM) , and Berkshire Hathaway Inc. (US:BRK.B) . KDT Advisors, LLCs nye posisjoner inkluderer Vanguard Index Funds - Vanguard Total Stock Market ETF (US:VTI) , Vanguard International Equity Index Funds - Vanguard FTSE Europe ETF (US:VGK) , Walmart Inc. (US:WMT) , ASML Holding N.V. - Depositary Receipt (Common Stock) (US:ASML) , and NextEra Energy, Inc. (US:NEE) .
De største økningene dette kvartalet
Vi bruker endringen i porteføljeallokeringen fordi dette er det mest meningsfulle målet. Endringer kan skyldes handler eller endringer i aksjekursene.
| Verdipapirer | Aksjer (MM) |
Verdi (MM$) |
Portefølje % | ΔPortefølje % |
|---|---|---|---|---|
| 0,01 | 5,93 | 9,5759 | 2,8732 | |
| 0,01 | 8,16 | 13,1640 | 2,3098 | |
| 0,00 | 1,02 | 1,6481 | 1,6481 | |
| 0,01 | 0,52 | 0,8442 | 0,8442 | |
| 0,01 | 1,38 | 2,2213 | 0,8330 | |
| 0,01 | 1,35 | 2,1780 | 0,7858 | |
| 0,03 | 3,67 | 5,9248 | 0,7031 | |
| 0,01 | 1,96 | 3,1655 | 0,6349 | |
| 0,00 | 0,35 | 0,5681 | 0,5681 | |
| 0,00 | 0,33 | 0,5389 | 0,5389 |
De største reduksjonene dette kvartalet
Vi bruker endringen i porteføljeallokeringen fordi dette er det mest meningsfulle målet. Endringer kan skyldes handler eller endringer i aksjekurser.
| Verdipapirer | Aksjer (MM) |
Verdi (MM$) |
Portefølje % | ΔPortefølje % |
|---|---|---|---|---|
| 0,01 | 0,56 | 0,9115 | −1,4941 | |
| 0,00 | 2,24 | 3,6125 | −1,2487 | |
| 0,00 | 0,58 | 0,9387 | −0,5506 | |
| 0,00 | 0,30 | 0,4910 | −0,5301 | |
| 0,00 | 0,41 | 0,6631 | −0,3505 | |
| 0,00 | 0,25 | 0,4018 | −0,3349 | |
| 0,01 | 1,33 | 2,1544 | −0,3210 | |
| 0,01 | 0,38 | 0,6148 | −0,2700 | |
| 0,01 | 0,71 | 1,1514 | −0,2353 | |
| 0,02 | 3,85 | 6,2199 | −0,2349 |
13F- og Fondsarkiveringer
Dette skjemaet ble sendt inn den 2025-08-05 for rapporteringsperioden 2025-06-30. Klikk på lenkeikonet for å se hele transaksjonshistorikken.
Oppgradere for å låse opp premiedata og eksportere til Excel![]() .
.
| Verdipapirer | Type | Gjennomsnittlig aksjekurs | Aksjer (MM) |
ΔAksjer (%) |
ΔAksjer (%) |
Verdi ($MM) |
Portefølje (%) |
ΔPortefølje (%) |
|
|---|---|---|---|---|---|---|---|---|---|
| VOO / Vanguard Index Funds - Vanguard S&P 500 ETF | 0,01 | −0,03 | 8,16 | 10,48 | 13,1640 | 2,3098 | |||
| MSFT / Microsoft Corporation | 0,01 | −1,77 | 5,93 | 30,17 | 9,5759 | 2,8732 | |||
| AAPL / Apple Inc. | 0,02 | −4,95 | 3,85 | −12,21 | 6,2199 | −0,2349 | |||
| VYM / Vanguard Whitehall Funds - Vanguard High Dividend Yield ETF | 0,03 | 0,00 | 3,67 | 3,38 | 5,9248 | 0,7031 | |||
| BRK.B / Berkshire Hathaway Inc. | 0,00 | −25,77 | 2,24 | −32,30 | 3,6125 | −1,2487 | |||
| VIG / Vanguard Specialized Funds - Vanguard Dividend Appreciation ETF | 0,01 | 0,00 | 2,03 | 5,50 | 3,2832 | 0,4481 | |||
| GOOGL / Alphabet Inc. | 0,01 | 0,00 | 1,96 | 13,95 | 3,1655 | 0,6349 | |||
| NVDA / NVIDIA Corporation | 0,01 | 0,00 | 1,38 | 45,76 | 2,2213 | 0,8330 | |||
| V / Visa Inc. | 0,00 | 0,00 | 1,37 | 1,33 | 2,2129 | 0,2229 | |||
| ORCL / Oracle Corporation | 0,01 | −8,86 | 1,35 | 42,60 | 2,1780 | 0,7858 | |||
| PG / The Procter & Gamble Company | 0,01 | −15,18 | 1,33 | −20,74 | 2,1544 | −0,3210 | |||
| XOM / Exxon Mobil Corporation | 0,01 | 4,76 | 1,14 | −5,08 | 1,8396 | 0,0745 | |||
| JPM / JPMorgan Chase & Co. | 0,00 | 0,00 | 1,08 | 18,24 | 1,7367 | 0,3980 | |||
| VTI / Vanguard Index Funds - Vanguard Total Stock Market ETF | 0,00 | 1,02 | 1,6481 | 1,6481 | |||||
| UNP / Union Pacific Corporation | 0,00 | 0,12 | 0,95 | −2,47 | 1,5276 | 0,1004 | |||
| META / Meta Platforms, Inc. | 0,00 | 8,61 | 0,93 | 39,16 | 1,5032 | 0,5185 | |||
| HON / Honeywell International Inc. | 0,00 | 0,00 | 0,89 | 10,00 | 1,4391 | 0,2470 | |||
| JNJ / Johnson & Johnson | 0,01 | 0,00 | 0,86 | −7,91 | 1,3899 | 0,0151 | |||
| GSCE / GS Connect S&P GSCI Enhanced Commodity Total Return ETN | 0,00 | 0,00 | 0,81 | 29,63 | 1,2998 | 0,3858 | |||
| QCOM / QUALCOMM Incorporated | 0,01 | 0,00 | 0,80 | 3,75 | 1,2962 | 0,1572 | |||
| VBR / Vanguard Index Funds - Vanguard Small-Cap Value ETF | 0,00 | 0,00 | 0,78 | 4,55 | 1,2620 | 0,1637 | |||
| APH / Amphenol Corporation | 0,01 | 0,00 | 0,72 | 50,52 | 1,1650 | 0,4600 | |||
| APD / Air Products and Chemicals, Inc. | 0,00 | 0,00 | 0,71 | −4,42 | 1,1517 | 0,0546 | |||
| CSCO / Cisco Systems, Inc. | 0,01 | −32,72 | 0,71 | −24,39 | 1,1514 | −0,2353 | |||
| ZTS / Zoetis Inc. | 0,00 | 4,35 | 0,71 | −1,25 | 1,1474 | 0,0897 | |||
| ADP / Automatic Data Processing, Inc. | 0,00 | 4,21 | 0,67 | 5,17 | 1,0835 | 0,1451 | |||
| INTU / Intuit Inc. | 0,00 | 0,00 | 0,66 | 28,35 | 1,0677 | 0,3094 | |||
| PM / Philip Morris International Inc. | 0,00 | 0,00 | 0,65 | 14,72 | 1,0446 | 0,2152 | |||
| AMZN / Amazon.com, Inc. | 0,00 | −26,11 | 0,62 | −14,82 | 0,9928 | −0,0688 | |||
| CVX / Chevron Corporation | 0,00 | −32,91 | 0,58 | −42,59 | 0,9387 | −0,5506 | |||
| GLW / Corning Incorporated | 0,01 | −69,95 | 0,56 | −65,53 | 0,9115 | −1,4941 | |||
| ABBV / AbbVie Inc. | 0,00 | 0,00 | 0,56 | −11,39 | 0,9044 | −0,0256 | |||
| VEU / Vanguard International Equity Index Funds - Vanguard FTSE All-World ex-US ETF | 0,01 | 0,00 | 0,54 | 10,86 | 0,8743 | 0,1555 | |||
| URTH / iShares, Inc. - iShares MSCI World ETF | 0,00 | 0,00 | 0,53 | 10,76 | 0,8474 | 0,1492 | |||
| ABT / Abbott Laboratories | 0,00 | 0,39 | 0,52 | 2,95 | 0,8444 | 0,0970 | |||
| VGK / Vanguard International Equity Index Funds - Vanguard FTSE Europe ETF | 0,01 | 0,52 | 0,8442 | 0,8442 | |||||
| LEN / Lennar Corporation | 0,00 | 0,00 | 0,50 | −3,65 | 0,8088 | 0,0442 | |||
| PLTR / Palantir Technologies Inc. | 0,00 | −50,00 | 0,49 | −19,28 | 0,7920 | −0,1015 | |||
| MRK / Merck & Co., Inc. | 0,01 | 0,00 | 0,47 | −11,68 | 0,7571 | −0,0250 | |||
| MCD / McDonald's Corporation | 0,00 | 0,00 | 0,46 | −6,52 | 0,7417 | 0,0193 | |||
| TSM / Taiwan Semiconductor Manufacturing Company Limited - Depositary Receipt (Common Stock) | 0,00 | −19,57 | 0,43 | 9,74 | 0,6908 | 0,1173 | |||
| TRI / Thomson Reuters Corporation | 0,00 | −48,80 | 0,41 | −40,49 | 0,6631 | −0,3505 | |||
| MRP / Millrose Properties, Inc. | 0,01 | −41,13 | 0,38 | −36,77 | 0,6148 | −0,2700 | |||
| SBUX / Starbucks Corporation | 0,00 | 0,00 | 0,38 | −6,67 | 0,6112 | 0,0151 | |||
| MDLZ / Mondelez International, Inc. | 0,01 | 0,00 | 0,38 | −0,53 | 0,6059 | 0,0505 | |||
| MO / Altria Group, Inc. | 0,01 | 0,00 | 0,37 | −2,14 | 0,5909 | 0,0398 | |||
| KMB / Kimberly-Clark Corporation | 0,00 | 0,00 | 0,35 | −9,25 | 0,5701 | −0,0029 | |||
| WMT / Walmart Inc. | 0,00 | 0,35 | 0,5681 | 0,5681 | |||||
| RIO / Rio Tinto Group - Depositary Receipt (Common Stock) | 0,01 | 0,00 | 0,35 | −3,07 | 0,5610 | 0,0346 | |||
| GLD / SPDR Gold Trust | 0,00 | 0,00 | 0,34 | 5,66 | 0,5431 | 0,0754 | |||
| ASML / ASML Holding N.V. - Depositary Receipt (Common Stock) | 0,00 | 0,33 | 0,5389 | 0,5389 | |||||
| PEP / PepsiCo, Inc. | 0,00 | 17,37 | 0,31 | 3,31 | 0,5040 | 0,0597 | |||
| CRM / Salesforce, Inc. | 0,00 | 15,51 | 0,30 | 17,37 | 0,4916 | 0,1100 | |||
| GEV / GE Vernova Inc. | 0,00 | −74,73 | 0,30 | −56,20 | 0,4910 | −0,5301 | |||
| NKE / NIKE, Inc. | 0,00 | −5,87 | 0,28 | 5,19 | 0,4597 | 0,0621 | |||
| NFLX / Netflix, Inc. | 0,00 | 0,28 | 0,4538 | 0,4538 | |||||
| VLO / Valero Energy Corporation | 0,00 | 0,00 | 0,28 | 1,82 | 0,4523 | 0,0474 | |||
| IXUS / iShares Trust - iShares Core MSCI Total International Stock ETF | 0,00 | 0,00 | 0,28 | 10,44 | 0,4454 | 0,0790 | |||
| GOOG / Alphabet Inc. | 0,00 | 0,00 | 0,26 | 13,27 | 0,4145 | 0,0819 | |||
| OKE / ONEOK, Inc. | 0,00 | −39,60 | 0,25 | −50,50 | 0,4018 | −0,3349 | |||
| CAT / Caterpillar Inc. | 0,00 | 0,25 | 0,4010 | 0,4010 | |||||
| EQIX / Equinix, Inc. | 0,00 | 0,32 | 0,25 | −1,99 | 0,3980 | 0,0275 | |||
| HD / The Home Depot, Inc. | 0,00 | 0,45 | 0,24 | 0,41 | 0,3929 | 0,0367 | |||
| NEE / NextEra Energy, Inc. | 0,00 | 0,22 | 0,3611 | 0,3611 | |||||
| ANET / Arista Networks Inc | 0,00 | 0,22 | 0,3591 | 0,3591 | |||||
| ECL / Ecolab Inc. | 0,00 | 0,00 | 0,22 | 6,44 | 0,3479 | 0,0497 | |||
| UNH / UnitedHealth Group Incorporated | 0,00 | −0,29 | 0,21 | −40,67 | 0,3449 | −0,1842 | |||
| T / AT&T Inc. | 0,00 | −100,00 | 0,00 | 0,0000 | |||||
| GEHC / GE HealthCare Technologies Inc. | 0,00 | −100,00 | 0,00 | 0,0000 | |||||
| AA / Alcoa Corporation | 0,00 | −100,00 | 0,00 | 0,0000 | |||||
| UAE / iShares Trust - iShares MSCI UAE ETF | 0,00 | −100,00 | 0,00 | 0,0000 | |||||
| IFN / The India Fund, Inc. | 0,00 | −100,00 | 0,00 | 0,0000 | |||||
| AEF / abrdn Emerging Markets ex-China Fund, Inc. | 0,00 | −100,00 | 0,00 | 0,0000 | |||||
| AGNC / AGNC Investment Corp. | 0,00 | −100,00 | 0,00 | 0,0000 | |||||
| TTE / TotalEnergies SE - Depositary Receipt (Common Stock) | 0,00 | −100,00 | 0,00 | 0,0000 | |||||
| THC / Tenet Healthcare Corporation | 0,00 | −100,00 | 0,00 | 0,0000 | |||||
| HWM / Howmet Aerospace Inc. | 0,00 | −100,00 | 0,00 | 0,0000 | |||||
| C / Citigroup Inc. | 0,00 | −100,00 | 0,00 | 0,0000 | |||||
| GE / General Electric Company | 0,00 | −100,00 | 0,00 | 0,0000 | |||||
| WFC / Wells Fargo & Company | 0,00 | −100,00 | 0,00 | 0,0000 | |||||
| AMGN / Amgen Inc. | 0,00 | −100,00 | 0,00 | 0,0000 |