Grunnleggende statistikk
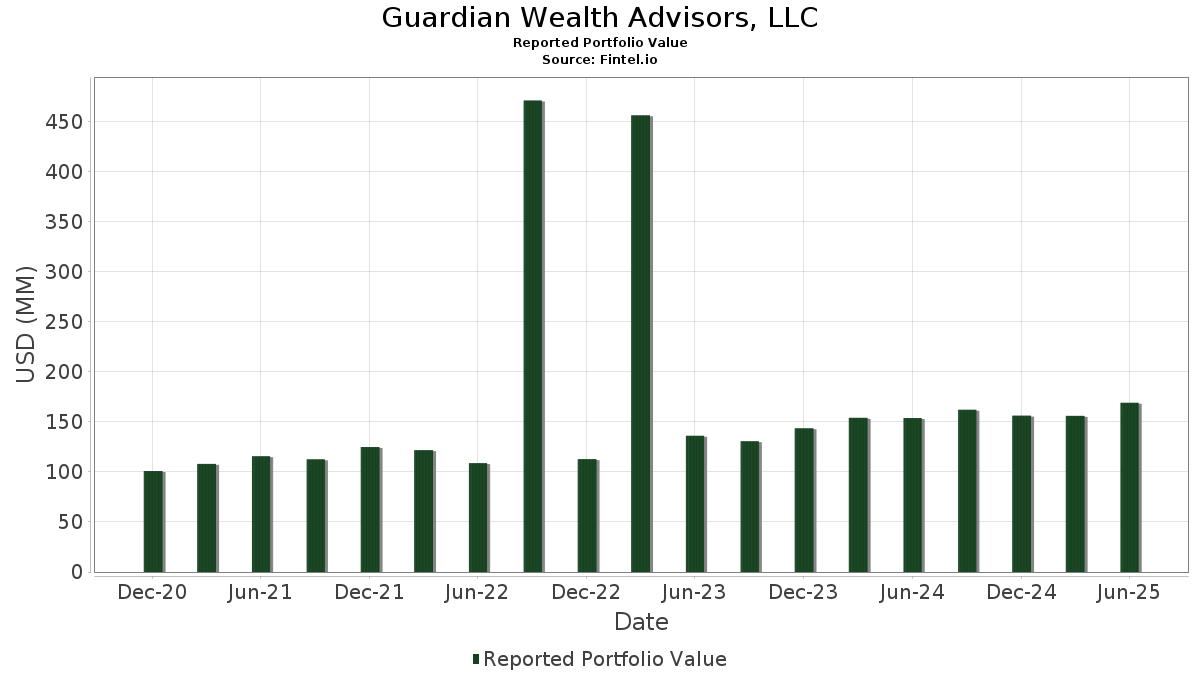
| Porteføljeverdi | $ 168 926 103 |
| Nåværende posisjoner | 74 |
Siste beholdninger, prestasjoner, forvaltet kapital (fra 13F, 13D)
Guardian Wealth Advisors, LLC har oppgitt 74 totale beholdninger i sine siste SEC-arkiveringer. Siste porteføljeverdi er beregnet til 168 926 103 USD. Faktisk forvaltet kapital (AUM) er denne verdien pluss kontanter (som ikke er oppgitt). Guardian Wealth Advisors, LLCs største beholdninger er SPDR S&P 500 ETF (US:SPY) , Vanguard Tax-Managed Funds - Vanguard FTSE Developed Markets ETF (US:VEA) , iShares Trust - iShares Russell 2000 ETF (US:IWM) , iShares Trust - iShares Core S&P Mid-Cap ETF (US:IJH) , and SPDR Series Trust - SPDR Portfolio S&P 500 Growth ETF (US:SPYG) .
De største økningene dette kvartalet
Vi bruker endringen i porteføljeallokeringen fordi dette er det mest meningsfulle målet. Endringer kan skyldes handler eller endringer i aksjekursene.
| Verdipapirer | Aksjer (MM) |
Verdi (MM$) |
Portefølje % | ΔPortefølje % |
|---|---|---|---|---|
| 0,10 | 9,98 | 5,9087 | 1,3468 | |
| 0,18 | 9,58 | 5,6684 | 0,7492 | |
| 0,39 | 22,06 | 13,0578 | 0,6494 | |
| 0,04 | 24,71 | 14,6259 | 0,5428 | |
| 0,24 | 14,95 | 8,8510 | 0,5140 | |
| 0,08 | 17,24 | 10,2031 | 0,3893 | |
| 0,02 | 9,31 | 5,5136 | 0,3644 | |
| 0,14 | 6,68 | 3,9556 | 0,2111 | |
| 0,00 | 0,22 | 0,1321 | 0,1321 | |
| 0,00 | 0,21 | 0,1239 | 0,1239 |
De største reduksjonene dette kvartalet
Vi bruker endringen i porteføljeallokeringen fordi dette er det mest meningsfulle målet. Endringer kan skyldes handler eller endringer i aksjekurser.
| Verdipapirer | Aksjer (MM) |
Verdi (MM$) |
Portefølje % | ΔPortefølje % |
|---|---|---|---|---|
| 0,03 | 5,39 | 3,1888 | −0,7178 | |
| 0,05 | 2,67 | 1,5824 | −0,4310 | |
| 0,14 | 3,50 | 2,0748 | −0,4082 | |
| 0,06 | 1,75 | 1,0364 | −0,3711 | |
| 0,06 | 6,19 | 3,6643 | −0,3138 | |
| 0,02 | 2,08 | 1,2305 | −0,2641 | |
| 0,00 | 0,27 | 0,1589 | −0,2007 | |
| 0,00 | 0,21 | 0,1253 | −0,1939 | |
| 0,00 | 0,56 | 0,3341 | −0,1776 | |
| 0,01 | 1,11 | 0,6561 | −0,1709 |
13F- og Fondsarkiveringer
Dette skjemaet ble sendt inn den 2025-07-31 for rapporteringsperioden 2025-06-30. Klikk på lenkeikonet for å se hele transaksjonshistorikken.
Oppgradere for å låse opp premiedata og eksportere til Excel![]() .
.
| Verdipapirer | Type | Gjennomsnittlig aksjekurs | Aksjer (MM) |
ΔAksjer (%) |
ΔAksjer (%) |
Verdi ($MM) |
Portefølje (%) |
ΔPortefølje (%) |
|
|---|---|---|---|---|---|---|---|---|---|
| SPY / SPDR S&P 500 ETF | 0,04 | 1,91 | 24,71 | 12,55 | 14,6259 | 0,5428 | |||
| VEA / Vanguard Tax-Managed Funds - Vanguard FTSE Developed Markets ETF | 0,39 | 1,69 | 22,06 | 14,05 | 13,0578 | 0,6494 | |||
| IWM / iShares Trust - iShares Russell 2000 ETF | 0,08 | 4,17 | 17,24 | 12,68 | 10,2031 | 0,3893 | |||
| IJH / iShares Trust - iShares Core S&P Mid-Cap ETF | 0,24 | 8,25 | 14,95 | 15,06 | 8,8510 | 0,5140 | |||
| SPYG / SPDR Series Trust - SPDR Portfolio S&P 500 Growth ETF | 0,10 | 18,36 | 9,98 | 40,38 | 5,9087 | 1,3468 | |||
| SPYV / SPDR Series Trust - SPDR Portfolio S&P 500 Value ETF | 0,18 | 21,85 | 9,58 | 24,89 | 5,6684 | 0,7492 | |||
| QQQ / Invesco QQQ Trust, Series 1 | 0,02 | −1,36 | 9,31 | 16,04 | 5,5136 | 0,3644 | |||
| VERSX / Vanguard Emerging Markets Stock Index Fund | 0,14 | 4,77 | 6,68 | 14,48 | 3,9556 | 0,2111 | |||
| IVW / iShares Trust - iShares S&P 500 Growth ETF | 0,06 | −15,83 | 6,19 | −0,16 | 3,6643 | −0,3138 | |||
| IVE / iShares Trust - iShares S&P 500 Value ETF | 0,03 | −13,73 | 5,39 | −11,55 | 3,1888 | −0,7178 | |||
| SJNK / SPDR Series Trust - SPDR Bloomberg Short Term High Yield Bond ETF | 0,14 | −10,58 | 3,50 | −9,46 | 2,0748 | −0,4082 | |||
| NEAR / iShares U.S. ETF Trust - iShares Short Duration Bond Active ETF | 0,05 | −15,20 | 2,67 | −14,82 | 1,5824 | −0,4310 | |||
| JPST / J.P. Morgan Exchange-Traded Fund Trust - JPMorgan Ultra-Short Income ETF | 0,05 | 7,97 | 2,37 | 8,11 | 1,4043 | −0,0039 | |||
| IWR / iShares Trust - iShares Russell Mid-Cap ETF | 0,02 | −17,47 | 2,08 | −10,78 | 1,2305 | −0,2641 | |||
| ICSH / iShares U.S. ETF Trust - iShares Ultra Short Duration Bond Active ETF | 0,04 | −4,70 | 1,90 | −4,71 | 1,1264 | −0,1543 | |||
| PFF / iShares Trust - iShares Preferred and Income Securities ETF | 0,06 | −20,07 | 1,75 | −20,20 | 1,0364 | −0,3711 | |||
| CHRW / C.H. Robinson Worldwide, Inc. | 0,02 | 0,00 | 1,60 | −6,32 | 0,9483 | −0,1485 | |||
| CAH / Cardinal Health, Inc. | 0,01 | −1,17 | 1,12 | 20,58 | 0,6628 | 0,0668 | |||
| ABBV / AbbVie Inc. | 0,01 | −2,94 | 1,11 | −14,04 | 0,6561 | −0,1709 | |||
| SPGI / S&P Global Inc. | 0,00 | −4,46 | 0,96 | −0,83 | 0,5684 | −0,0528 | |||
| JNJ / Johnson & Johnson | 0,01 | 0,80 | 0,94 | −7,19 | 0,5587 | −0,0935 | |||
| CINF / Cincinnati Financial Corporation | 0,01 | −1,93 | 0,93 | −1,06 | 0,5518 | −0,0530 | |||
| CVX / Chevron Corporation | 0,01 | 2,59 | 0,88 | −12,21 | 0,5196 | −0,1216 | |||
| ABT / Abbott Laboratories | 0,01 | −0,33 | 0,87 | 2,11 | 0,5161 | −0,0313 | |||
| ECL / Ecolab Inc. | 0,00 | −0,81 | 0,86 | 5,39 | 0,5101 | −0,0142 | |||
| XOM / Exxon Mobil Corporation | 0,01 | 0,72 | 0,78 | −8,74 | 0,4639 | −0,0868 | |||
| PG / The Procter & Gamble Company | 0,00 | 5,62 | 0,72 | −1,23 | 0,4272 | −0,0418 | |||
| GGG / Graco Inc. | 0,01 | 0,64 | 0,65 | 3,50 | 0,3853 | −0,0178 | |||
| LOW / Lowe's Companies, Inc. | 0,00 | −1,17 | 0,64 | −6,03 | 0,3788 | −0,0578 | |||
| VO / Vanguard Index Funds - Vanguard Mid-Cap ETF | 0,00 | −3,86 | 0,61 | 4,07 | 0,3635 | −0,0152 | |||
| PEP / PepsiCo, Inc. | 0,00 | 1,65 | 0,60 | −10,42 | 0,3566 | −0,0751 | |||
| EMR / Emerson Electric Co. | 0,00 | 0,69 | 0,60 | 22,45 | 0,3557 | 0,0409 | |||
| MSFT / Microsoft Corporation | 0,00 | −2,13 | 0,57 | 29,55 | 0,3379 | 0,0556 | |||
| ED / Consolidated Edison, Inc. | 0,01 | −4,84 | 0,57 | −13,68 | 0,3366 | −0,0859 | |||
| SCHF / Schwab Strategic Trust - Schwab International Equity ETF | 0,03 | 0,18 | 0,57 | 12,03 | 0,3364 | 0,0107 | |||
| AAPL / Apple Inc. | 0,00 | −23,39 | 0,56 | −29,23 | 0,3341 | −0,1776 | |||
| HYG / iShares Trust - iShares iBoxx $ High Yield Corporate Bond ETF | 0,01 | −3,84 | 0,56 | −1,60 | 0,3287 | −0,0337 | |||
| IBM / International Business Machines Corporation | 0,00 | 7,66 | 0,55 | 27,61 | 0,3261 | 0,0492 | |||
| MMM / 3M Company | 0,00 | −24,51 | 0,54 | −21,79 | 0,3211 | −0,1236 | |||
| SYY / Sysco Corporation | 0,01 | −0,73 | 0,50 | 0,20 | 0,2981 | −0,0244 | |||
| FAST / Fastenal Company | 0,01 | 238,02 | 0,50 | 83,15 | 0,2964 | 0,1209 | |||
| TROW / T. Rowe Price Group, Inc. | 0,00 | −16,44 | 0,45 | −12,23 | 0,2639 | −0,0619 | |||
| VOO / Vanguard Index Funds - Vanguard S&P 500 ETF | 0,00 | −1,52 | 0,44 | 8,91 | 0,2606 | 0,0011 | |||
| GPC / Genuine Parts Company | 0,00 | 1,39 | 0,43 | 3,33 | 0,2571 | −0,0128 | |||
| GIS / General Mills, Inc. | 0,01 | 2,72 | 0,41 | −10,92 | 0,2418 | −0,0526 | |||
| TGT / Target Corporation | 0,00 | 1,71 | 0,41 | −3,80 | 0,2401 | −0,0306 | |||
| WMT / Walmart Inc. | 0,00 | −3,30 | 0,38 | 7,93 | 0,2256 | −0,0015 | |||
| APD / Air Products and Chemicals, Inc. | 0,00 | −5,94 | 0,37 | −10,07 | 0,2169 | −0,0444 | |||
| ADP / Automatic Data Processing, Inc. | 0,00 | −4,96 | 0,35 | −4,07 | 0,2097 | −0,0273 | |||
| SCHM / Schwab Strategic Trust - Schwab U.S. Mid-Cap ETF | 0,01 | 2,74 | 0,33 | 9,87 | 0,1983 | 0,0029 | |||
| IVV / iShares Trust - iShares Core S&P 500 ETF | 0,00 | −9,78 | 0,33 | −0,30 | 0,1966 | −0,0171 | |||
| MDT / Medtronic plc | 0,00 | −3,58 | 0,32 | −6,41 | 0,1903 | −0,0302 | |||
| CB / Chubb Limited | 0,00 | 2,04 | 0,30 | −1,94 | 0,1800 | −0,0194 | |||
| BRK.B / Berkshire Hathaway Inc. | 0,00 | −0,97 | 0,30 | −9,73 | 0,1763 | −0,0352 | |||
| CLX / The Clorox Company | 0,00 | −13,13 | 0,30 | −29,19 | 0,1753 | −0,0929 | |||
| CTAS / Cintas Corporation | 0,00 | −29,01 | 0,30 | −22,92 | 0,1753 | −0,0715 | |||
| MCD / McDonald's Corporation | 0,00 | −7,35 | 0,29 | −13,27 | 0,1743 | −0,0437 | |||
| PNR / Pentair plc | 0,00 | −0,50 | 0,29 | 17,14 | 0,1700 | 0,0123 | |||
| KMB / Kimberly-Clark Corporation | 0,00 | −8,32 | 0,28 | −16,96 | 0,1656 | −0,0504 | |||
| NOBL / ProShares Trust - ProShares S&P 500 Dividend Aristocrats ETF | 0,00 | 9,05 | 0,27 | 7,57 | 0,1601 | −0,0013 | |||
| UNH / UnitedHealth Group Incorporated | 0,00 | −19,63 | 0,27 | −52,14 | 0,1589 | −0,2007 | |||
| SCHE / Schwab Strategic Trust - Schwab Emerging Markets Equity ETF | 0,01 | 0,06 | 0,26 | 9,70 | 0,1541 | 0,0014 | |||
| SCHX / Schwab Strategic Trust - Schwab U.S. Large-Cap ETF | 0,01 | 0,00 | 0,25 | 10,53 | 0,1497 | 0,0031 | |||
| EXPD / Expeditors International of Washington, Inc. | 0,00 | −1,03 | 0,24 | −5,88 | 0,1424 | −0,0217 | |||
| BSX / Boston Scientific Corporation | 0,00 | 0,00 | 0,24 | 6,22 | 0,1420 | −0,0025 | |||
| KO / The Coca-Cola Company | 0,00 | −14,83 | 0,23 | −15,94 | 0,1376 | −0,0397 | |||
| FDS / FactSet Research Systems Inc. | 0,00 | 0,22 | 0,1321 | 0,1321 | |||||
| IGSB / iShares Trust - iShares 1-5 Year Investment Grade Corporate Bond ETF | 0,00 | −7,18 | 0,22 | −6,44 | 0,1293 | −0,0206 | |||
| COST / Costco Wholesale Corporation | 0,00 | −9,47 | 0,22 | −5,24 | 0,1289 | −0,0185 | |||
| AMZN / Amazon.com, Inc. | 0,00 | −63,10 | 0,21 | −57,55 | 0,1253 | −0,1939 | |||
| SPSM / SPDR Series Trust - SPDR Portfolio S&P 600 Small Cap ETF | 0,00 | 0,00 | 0,21 | 4,50 | 0,1241 | −0,0046 | |||
| SPMD / SPDR Series Trust - SPDR Portfolio S&P 400 Mid Cap ETF | 0,00 | 0,21 | 0,1239 | 0,1239 | |||||
| HRL / Hormel Foods Corporation | 0,01 | −9,33 | 0,21 | −11,26 | 0,1216 | −0,0271 | |||
| SHW / The Sherwin-Williams Company | 0,00 | 2,57 | 0,21 | 0,99 | 0,1216 | −0,0090 | |||
| AFL / Aflac Incorporated | 0,00 | −100,00 | 0,00 | 0,0000 |