Grunnleggende statistikk
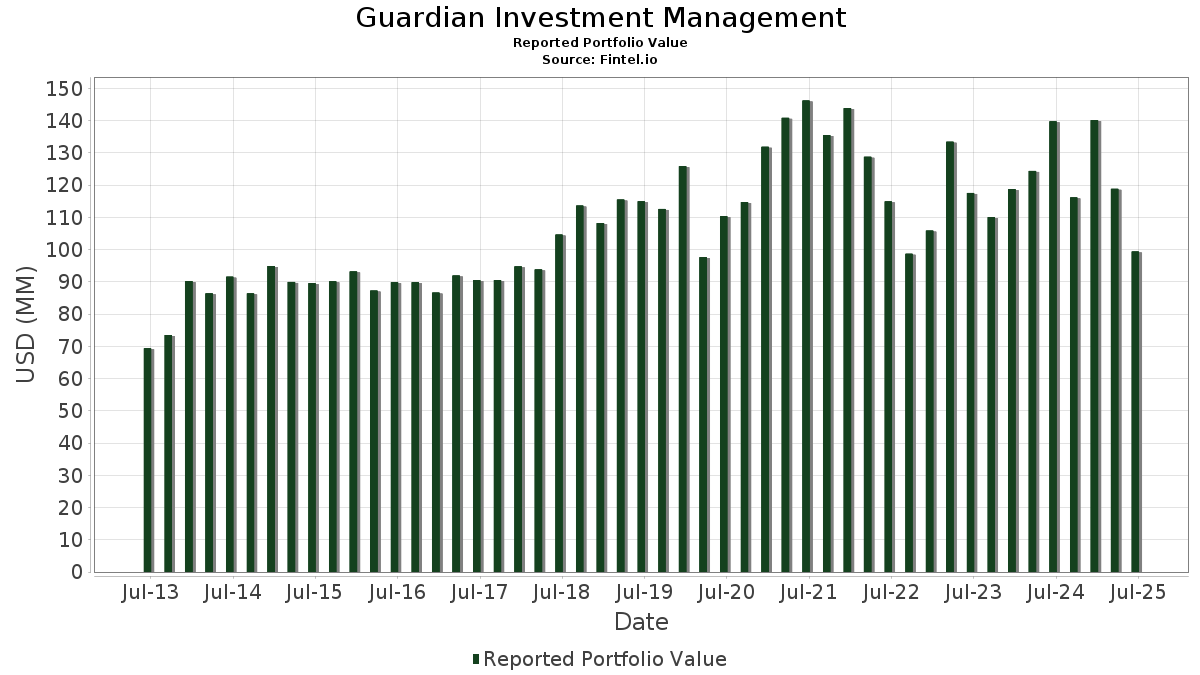
| Porteføljeverdi | $ 99 371 050 |
| Nåværende posisjoner | 51 |
Siste beholdninger, prestasjoner, forvaltet kapital (fra 13F, 13D)
Guardian Investment Management har oppgitt 51 totale beholdninger i sine siste SEC-arkiveringer. Siste porteføljeverdi er beregnet til 99 371 050 USD. Faktisk forvaltet kapital (AUM) er denne verdien pluss kontanter (som ikke er oppgitt). Guardian Investment Managements største beholdninger er Apple Inc. (US:AAPL) , Danaher Corporation (US:DHR) , Amgen Inc. (US:AMGN) , Costco Wholesale Corporation (US:COST) , and Microsoft Corporation (US:MSFT) .
De største økningene dette kvartalet
Vi bruker endringen i porteføljeallokeringen fordi dette er det mest meningsfulle målet. Endringer kan skyldes handler eller endringer i aksjekursene.
| Verdipapirer | Aksjer (MM) |
Verdi (MM$) |
Portefølje % | ΔPortefølje % |
|---|---|---|---|---|
| 0,06 | 10,03 | 10,0957 | 6,4728 | |
| 0,01 | 5,00 | 5,0278 | 1,4115 | |
| 0,05 | 2,74 | 2,7594 | 1,2486 | |
| 0,01 | 4,15 | 4,1767 | 1,1770 | |
| 0,07 | 3,42 | 3,4414 | 0,9383 | |
| 0,01 | 1,73 | 1,7435 | 0,8512 | |
| 0,00 | 1,45 | 1,4596 | 0,7473 | |
| 0,00 | 1,94 | 1,9483 | 0,6750 | |
| 0,00 | 0,89 | 0,8935 | 0,5332 | |
| 0,01 | 1,49 | 1,4971 | 0,4994 |
De største reduksjonene dette kvartalet
Vi bruker endringen i porteføljeallokeringen fordi dette er det mest meningsfulle målet. Endringer kan skyldes handler eller endringer i aksjekurser.
| Verdipapirer | Aksjer (MM) |
Verdi (MM$) |
Portefølje % | ΔPortefølje % |
|---|---|---|---|---|
| 0,00 | 0,00 | −0,9266 | ||
| 0,00 | 1,42 | 1,4323 | −0,6207 | |
| 0,01 | 1,66 | 1,6690 | −0,4696 | |
| 0,08 | 16,13 | 16,2321 | −0,3584 | |
| 0,01 | 2,45 | 2,4650 | −0,2704 | |
| 0,01 | 2,65 | 2,6702 | −0,2218 | |
| 0,01 | 0,67 | 0,6698 | −0,1709 | |
| 0,01 | 0,44 | 0,4425 | −0,0631 | |
| 0,00 | 0,56 | 0,5649 | −0,0308 | |
| 0,03 | 1,03 | 1,0340 | −0,0086 |
13F- og Fondsarkiveringer
Dette skjemaet ble sendt inn den 2025-07-17 for rapporteringsperioden 2025-06-30. Klikk på lenkeikonet for å se hele transaksjonshistorikken.
Oppgradere for å låse opp premiedata og eksportere til Excel![]() .
.
| Verdipapirer | Type | Gjennomsnittlig aksjekurs | Aksjer (MM) |
ΔAksjer (%) |
ΔAksjer (%) |
Verdi ($MM) |
Portefølje (%) |
ΔPortefølje (%) |
|
|---|---|---|---|---|---|---|---|---|---|
| AAPL / Apple Inc. | 0,08 | −11,41 | 16,13 | −18,17 | 16,2321 | −0,3584 | |||
| DHR / Danaher Corporation | 0,06 | 49,04 | 10,03 | 133,09 | 10,0957 | 6,4728 | |||
| AMGN / Amgen Inc. | 0,02 | 2,75 | 5,22 | −7,92 | 5,2530 | 0,4818 | |||
| COST / Costco Wholesale Corporation | 0,01 | 11,09 | 5,00 | 16,29 | 5,0278 | 1,4115 | |||
| MSFT / Microsoft Corporation | 0,01 | −12,11 | 4,15 | 16,47 | 4,1767 | 1,1770 | |||
| BAC / Bank of America Corporation | 0,07 | 1,40 | 3,42 | 14,96 | 3,4414 | 0,9383 | |||
| WMT / Walmart Inc. | 0,03 | −24,24 | 3,41 | −15,63 | 3,4292 | 0,0303 | |||
| QS / QuantumScape Corporation | 0,05 | 336,21 | 2,74 | 52,76 | 2,7594 | 1,2486 | |||
| ABBV / AbbVie Inc. | 0,01 | −12,84 | 2,65 | −22,79 | 2,6702 | −0,2218 | |||
| CVX / Chevron Corporation | 0,02 | −1,11 | 2,55 | −15,36 | 2,5617 | 0,0304 | |||
| JPM / JPMorgan Chase & Co. | 0,01 | −36,23 | 2,45 | −24,62 | 2,4650 | −0,2704 | |||
| JNJ / Johnson & Johnson | 0,02 | −7,56 | 2,45 | −14,80 | 2,4629 | 0,0450 | |||
| GE / General Electric Company | 0,01 | −1,10 | 2,19 | 0,00 | 2,2005 | 0,3601 | |||
| CAT / Caterpillar Inc. | 0,00 | 8,72 | 1,94 | 28,04 | 1,9483 | 0,6750 | |||
| AMZN / Amazon.com, Inc. | 0,01 | 41,73 | 1,73 | 63,40 | 1,7435 | 0,8512 | |||
| GJR / Strats Trust For Procter & Gambel Security - Preferred Security | 0,01 | −30,18 | 1,66 | −34,72 | 1,6690 | −0,4696 | |||
| KKR / KKR & Co. Inc. | 0,01 | −1,21 | 1,63 | 20,00 | 1,6366 | 0,4958 | |||
| BA / The Boeing Company | 0,01 | 2,16 | 1,49 | 25,49 | 1,4971 | 0,4994 | |||
| ITW / Illinois Tool Works Inc. | 0,01 | −15,49 | 1,48 | −15,74 | 1,4929 | 0,0109 | |||
| GEV / GE Vernova Inc. | 0,00 | −1,12 | 1,45 | 71,39 | 1,4596 | 0,7473 | |||
| BRK.B / Berkshire Hathaway Inc. | 0,00 | −41,16 | 1,42 | −41,66 | 1,4323 | −0,6207 | |||
| MMM / 3M Company | 0,01 | −8,16 | 1,37 | −4,20 | 1,3788 | 0,1747 | |||
| PEP / PepsiCo, Inc. | 0,01 | −0,17 | 1,33 | −12,10 | 1,3394 | 0,0652 | |||
| XOM / Exxon Mobil Corporation | 0,01 | 9,31 | 1,27 | −0,39 | 1,2735 | 0,2040 | |||
| CSX / CSX Corporation | 0,04 | 0,00 | 1,26 | 10,88 | 1,2724 | 0,3126 | |||
| INTC / Intel Corporation | 0,06 | 2,66 | 1,25 | 1,29 | 1,2623 | 0,2197 | |||
| MRK / Merck & Co., Inc. | 0,02 | 0,00 | 1,20 | −11,81 | 1,2029 | 0,0621 | |||
| CMCSA / Comcast Corporation | 0,03 | −5,71 | 1,18 | −8,83 | 1,1852 | 0,0982 | |||
| CSCO / Cisco Systems, Inc. | 0,02 | −2,33 | 1,16 | 9,74 | 1,1691 | 0,2786 | |||
| ADM / Archer-Daniels-Midland Company | 0,01 | 6,04 | 1,12 | 46,54 | 1,1281 | 0,4839 | |||
| TXN / Texas Instruments Incorporated | 0,01 | 0,00 | 1,08 | 15,52 | 1,0865 | 0,3000 | |||
| WBD / Warner Bros. Discovery, Inc. | 0,09 | 9,37 | 1,05 | 16,80 | 1,0576 | 0,3002 | |||
| SLB / Schlumberger Limited | 0,03 | 0,00 | 1,03 | −17,04 | 1,0340 | −0,0086 | |||
| T / AT&T Inc. | 0,03 | −1,75 | 0,97 | 0,62 | 0,9793 | 0,1646 | |||
| C / Citigroup Inc. | 0,01 | 0,00 | 0,90 | 19,89 | 0,9101 | 0,2750 | |||
| AMAT / Applied Materials, Inc. | 0,00 | 64,41 | 0,89 | 107,24 | 0,8935 | 0,5332 | |||
| ABT / Abbott Laboratories | 0,01 | −18,44 | 0,78 | −16,36 | 0,7870 | −0,0001 | |||
| DE / Deere & Company | 0,00 | 0,00 | 0,73 | 8,35 | 0,7317 | 0,1668 | |||
| MDLZ / Mondelez International, Inc. | 0,01 | −2,42 | 0,68 | −2,99 | 0,6855 | 0,0944 | |||
| BIIB / Biogen Inc. | 0,01 | −27,40 | 0,67 | −33,37 | 0,6698 | −0,1709 | |||
| HD / The Home Depot, Inc. | 0,00 | 0,00 | 0,56 | −20,65 | 0,5649 | −0,0308 | |||
| EMR / Emerson Electric Co. | 0,00 | 0,00 | 0,45 | 21,68 | 0,4527 | 0,1414 | |||
| BMY / Bristol-Myers Squibb Company | 0,01 | −3,55 | 0,44 | −26,83 | 0,4425 | −0,0631 | |||
| GT / The Goodyear Tire & Rubber Company | 0,04 | 5,06 | 0,43 | 18,13 | 0,4331 | 0,1266 | |||
| GILD / Gilead Sciences, Inc. | 0,00 | 0,00 | 0,42 | −1,19 | 0,4184 | 0,0647 | |||
| IBM / International Business Machines Corporation | 0,00 | −20,00 | 0,35 | −5,11 | 0,3560 | 0,0420 | |||
| NOC / Northrop Grumman Corporation | 0,00 | −12,63 | 0,35 | −14,81 | 0,3482 | 0,0069 | |||
| EL / The Estée Lauder Companies Inc. | 0,00 | −4,49 | 0,34 | 17,06 | 0,3456 | 0,0984 | |||
| PFE / Pfizer Inc. | 0,01 | 17,02 | 0,33 | 13,65 | 0,3355 | 0,0883 | |||
| RTX / RTX Corporation | 0,00 | 0,00 | 0,31 | 0,00 | 0,3086 | 0,0509 | |||
| V / Visa Inc. | 0,01 | −3,58 | 0,29 | −7,91 | 0,2931 | 0,0266 | |||
| UPS / United Parcel Service, Inc. | 0,00 | −100,00 | 0,00 | 0,0000 | |||||
| BX / Blackstone Inc. | 0,00 | −100,00 | 0,00 | 0,0000 | |||||
| GS / The Goldman Sachs Group, Inc. | 0,00 | −100,00 | 0,00 | 0,0000 | |||||
| ADP / Automatic Data Processing, Inc. | 0,00 | −100,00 | 0,00 | 0,0000 | |||||
| PARAA / Paramount Global | 0,00 | −100,00 | 0,00 | 0,0000 | |||||
| AXP / American Express Company | 0,00 | −100,00 | 0,00 | −100,00 | −0,9266 |