Grunnleggende statistikk
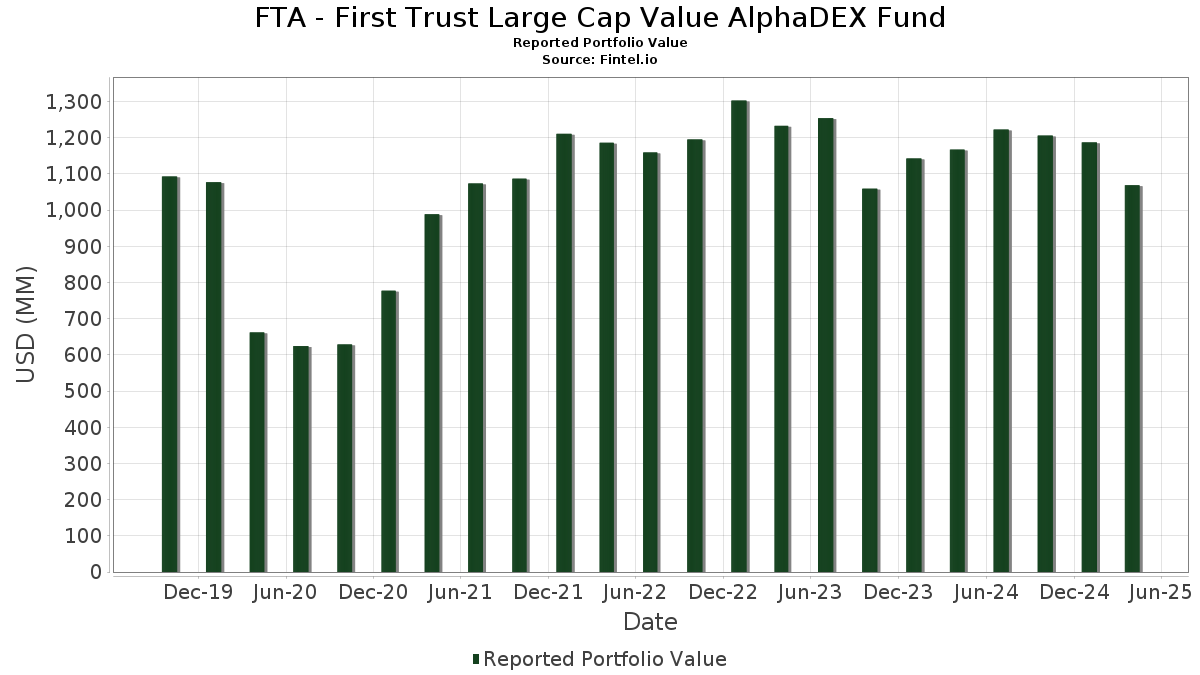
| Porteføljeverdi | $ 1 068 960 601 |
| Nåværende posisjoner | 188 |
Siste beholdninger, prestasjoner, forvaltet kapital (fra 13F, 13D)
FTA - First Trust Large Cap Value AlphaDEX Fund har oppgitt 188 totale beholdninger i sine siste SEC-arkiveringer. Siste porteføljeverdi er beregnet til 1 068 960 601 USD. Faktisk forvaltet kapital (AUM) er denne verdien pluss kontanter (som ikke er oppgitt). FTA - First Trust Large Cap Value AlphaDEX Funds største beholdninger er Newmont Corporation (US:NEM) , Western Digital Corporation (US:WDC) , Block, Inc. (US:SQ) , Hewlett Packard Enterprise Company (US:HPE) , and Steel Dynamics, Inc. (US:STLD) . FTA - First Trust Large Cap Value AlphaDEX Funds nye posisjoner inkluderer Block, Inc. (US:SQ) , Avantor, Inc. (US:AVTR) , NRG Energy, Inc. (US:NRG) , Uber Technologies, Inc. (US:UBER) , and NXP Semiconductors N.V. (US:NXPI) .
De største økningene dette kvartalet
Vi bruker endringen i porteføljeallokeringen fordi dette er det mest meningsfulle målet. Endringer kan skyldes handler eller endringer i aksjekursene.
| Verdipapirer | Aksjer (MM) |
Verdi (MM$) |
Portefølje % | ΔPortefølje % |
|---|---|---|---|---|
| 0,19 | 10,84 | 1,0141 | 1,0141 | |
| 0,25 | 10,93 | 1,0222 | 0,8357 | |
| 0,21 | 10,99 | 1,0282 | 0,8321 | |
| 0,12 | 8,92 | 0,8345 | 0,6465 | |
| 0,50 | 6,46 | 0,6041 | 0,6041 | |
| 0,06 | 9,79 | 0,9153 | 0,5669 | |
| 0,15 | 9,54 | 0,8919 | 0,5451 | |
| 0,04 | 5,80 | 0,5426 | 0,5426 | |
| 0,01 | 7,61 | 0,7117 | 0,5411 | |
| 0,02 | 8,98 | 0,8401 | 0,4743 |
De største reduksjonene dette kvartalet
Vi bruker endringen i porteføljeallokeringen fordi dette er det mest meningsfulle målet. Endringer kan skyldes handler eller endringer i aksjekurser.
| Verdipapirer | Aksjer (MM) |
Verdi (MM$) |
Portefølje % | ΔPortefølje % |
|---|---|---|---|---|
| 0,00 | 0,00 | −0,9754 | ||
| 0,00 | 0,00 | −0,5044 | ||
| 0,05 | 4,96 | 0,4639 | −0,4436 | |
| 0,10 | 5,18 | 0,4843 | −0,4399 | |
| 0,04 | 1,82 | 0,1698 | −0,3984 | |
| 0,01 | 3,90 | 0,3645 | −0,3883 | |
| 0,12 | 7,94 | 0,7423 | −0,3614 | |
| 0,02 | 1,94 | 0,1810 | −0,3292 | |
| 0,19 | 6,41 | 0,5996 | −0,3219 | |
| 0,11 | 6,66 | 0,6233 | −0,2708 |
13F- og Fondsarkiveringer
Dette skjemaet ble sendt inn den 2025-06-25 for rapporteringsperioden 2025-04-30. Klikk på lenkeikonet for å se hele transaksjonshistorikken.
Oppgradere for å låse opp premiedata og eksportere til Excel![]() .
.
| Verdipapirer | Type | Gjennomsnittlig aksjekurs | Aksjer (MM) |
ΔAksjer (%) |
ΔAksjer (%) |
Verdi ($MM) |
Portefølje (%) |
ΔPortefølje (%) |
|
|---|---|---|---|---|---|---|---|---|---|
| NEM / Newmont Corporation | 0,21 | 282,82 | 10,99 | 372,16 | 1,0282 | 0,8321 | |||
| WDC / Western Digital Corporation | 0,25 | 632,44 | 10,93 | 393,41 | 1,0222 | 0,8357 | |||
| SQ / Block, Inc. | 0,19 | 10,84 | 1,0141 | 1,0141 | |||||
| HPE / Hewlett Packard Enterprise Company | 0,65 | 33,81 | 10,59 | 2,42 | 0,9905 | 0,1199 | |||
| STLD / Steel Dynamics, Inc. | 0,08 | −11,81 | 10,45 | −10,77 | 0,9772 | −0,0087 | |||
| CF / CF Industries Holdings, Inc. | 0,13 | 5,58 | 10,10 | −10,27 | 0,9449 | −0,0031 | |||
| F / Ford Motor Company | 1,00 | −4,55 | 10,05 | −5,21 | 0,9404 | 0,0473 | |||
| PHM / PulteGroup, Inc. | 0,10 | 2,44 | 10,05 | −7,64 | 0,9403 | 0,0238 | |||
| ADM / Archer-Daniels-Midland Company | 0,21 | 1,76 | 10,02 | −5,15 | 0,9372 | 0,0477 | |||
| DHI / D.R. Horton, Inc. | 0,08 | 6,36 | 10,01 | −5,30 | 0,9364 | 0,0462 | |||
| NUE / Nucor Corporation | 0,08 | −6,21 | 9,99 | −12,83 | 0,9347 | −0,0306 | |||
| CNC / Centene Corporation | 0,17 | −3,50 | 9,93 | −9,80 | 0,9289 | 0,0018 | |||
| SYF / Synchrony Financial | 0,19 | 48,42 | 9,89 | 11,78 | 0,9247 | 0,1800 | |||
| ON / ON Semiconductor Corporation | 0,25 | 87,31 | 9,83 | 42,08 | 0,9194 | 0,3368 | |||
| MKL / Markel Group Inc. | 0,01 | −18,65 | 9,80 | −9,73 | 0,9165 | 0,0290 | |||
| DOV / Dover Corporation | 0,06 | 147,94 | 9,79 | 129,66 | 0,9153 | 0,5669 | |||
| VZ / Verizon Communications Inc. | 0,22 | 6,57 | 9,79 | 19,20 | 0,9153 | 0,2241 | |||
| TROW / T. Rowe Price Group, Inc. | 0,11 | 19,04 | 9,71 | −9,84 | 0,9082 | 0,0013 | |||
| GM / General Motors Company | 0,21 | 9,54 | 9,69 | 0,20 | 0,9064 | 0,0920 | |||
| TRMB / Trimble Inc. | 0,15 | 90,06 | 9,54 | 119,52 | 0,8919 | 0,5451 | |||
| LEN / Lennar Corporation | 0,09 | 14,89 | 9,53 | −4,92 | 0,8916 | 0,0474 | |||
| ACGL / Arch Capital Group Ltd. | 0,10 | 1,28 | 9,50 | −4,11 | 0,8884 | 0,0785 | |||
| CINF / Cincinnati Financial Corporation | 0,07 | −5,93 | 9,49 | −4,44 | 0,8880 | 0,0514 | |||
| CMCSA / Comcast Corporation | 0,27 | −1,64 | 9,34 | −0,06 | 0,8733 | 0,0866 | |||
| CSL / Carlisle Companies Incorporated | 0,02 | 78,10 | 8,98 | 115,09 | 0,8401 | 0,4743 | |||
| XOM / Exxon Mobil Corporation | 0,08 | −12,53 | 8,95 | −13,51 | 0,8369 | −0,0342 | |||
| MU / Micron Technology, Inc. | 0,12 | 251,64 | 8,92 | 279,01 | 0,8345 | 0,6465 | |||
| BIIB / Biogen Inc. | 0,07 | 8,07 | 8,91 | −9,09 | 0,8338 | 0,0082 | |||
| VLO / Valero Energy Corporation | 0,08 | −10,24 | 8,86 | −21,66 | 0,8283 | −0,1234 | |||
| EOG / EOG Resources, Inc. | 0,08 | −7,57 | 8,67 | −18,93 | 0,8107 | −0,0895 | |||
| COG / Cabot Oil & Gas Corp. | 0,35 | −14,54 | 8,56 | −24,29 | 0,8008 | −0,1513 | |||
| COP / ConocoPhillips | 0,10 | −8,68 | 8,55 | −17,66 | 0,7996 | −0,0745 | |||
| FANG / Diamondback Energy, Inc. | 0,06 | −0,90 | 8,32 | −20,41 | 0,7780 | −0,1020 | |||
| EXC / Exelon Corporation | 0,17 | −21,01 | 8,20 | −7,38 | 0,7673 | 0,0215 | |||
| CVX / Chevron Corporation | 0,06 | −16,27 | 8,19 | −23,64 | 0,7664 | −0,1372 | |||
| DVN / Devon Energy Corporation | 0,27 | −15,37 | 8,19 | −24,53 | 0,7662 | −0,1477 | |||
| COF / Capital One Financial Corporation | 0,04 | −3,82 | 8,10 | −14,89 | 0,7579 | −0,0438 | |||
| BRK.B / Berkshire Hathaway Inc. | 0,02 | −41,00 | 8,07 | −28,25 | 0,7548 | −0,1648 | |||
| XEL / Xcel Energy Inc. | 0,11 | −7,76 | 8,05 | −2,95 | 0,7529 | 0,0544 | |||
| RS / Reliance, Inc. | 0,03 | −27,86 | 8,05 | −28,18 | 0,7525 | −0,1907 | |||
| OXY / Occidental Petroleum Corporation | 0,20 | −3,20 | 8,04 | −18,23 | 0,7523 | −0,0759 | |||
| NWSA / News Corporation | 0,30 | 95,68 | 8,03 | 88,72 | 0,7511 | 0,3928 | |||
| WFC / Wells Fargo & Company | 0,11 | 29,56 | 7,97 | 16,75 | 0,7456 | 0,1707 | |||
| EG / Everest Group, Ltd. | 0,02 | −22,82 | 7,96 | −20,30 | 0,7445 | −0,0965 | |||
| CVS / CVS Health Corporation | 0,12 | −48,74 | 7,94 | −39,46 | 0,7423 | −0,3614 | |||
| STT / State Street Corporation | 0,09 | 45,17 | 7,93 | 25,87 | 0,7418 | 0,2112 | |||
| T / AT&T Inc. | 0,29 | −22,14 | 7,89 | −9,11 | 0,7384 | 0,0070 | |||
| HAL / Halliburton Company | 0,40 | 3,64 | 7,87 | −21,06 | 0,7362 | −0,1033 | |||
| GPN / Global Payments Inc. | 0,10 | −4,65 | 7,85 | −28,41 | 0,7343 | −0,1624 | |||
| HBAN / Huntington Bancshares Incorporated | 0,54 | 4,82 | 7,80 | −11,44 | 0,7297 | −0,0121 | |||
| PFE / Pfizer Inc. | 0,32 | 102,49 | 7,76 | 86,39 | 0,7262 | 0,3754 | |||
| C / Citigroup Inc. | 0,11 | 31,30 | 7,76 | 10,25 | 0,7261 | 0,1333 | |||
| CTSH / Cognizant Technology Solutions Corporation | 0,11 | −2,79 | 7,75 | −13,43 | 0,7250 | −0,0289 | |||
| TSN / Tyson Foods, Inc. | 0,13 | −12,95 | 7,74 | −5,62 | 0,7235 | 0,0333 | |||
| ES / Eversource Energy | 0,13 | 32,07 | 7,72 | 44,88 | 0,7219 | 0,2553 | |||
| BLDR / Builders FirstSource, Inc. | 0,06 | 10,63 | 7,72 | −20,88 | 0,7218 | −0,0995 | |||
| KHC / The Kraft Heinz Company | 0,26 | 95,19 | 7,71 | 90,34 | 0,7209 | 0,3799 | |||
| USB / U.S. Bancorp | 0,19 | 50,02 | 7,70 | 26,64 | 0,7203 | 0,2083 | |||
| MTB / M&T Bank Corporation | 0,05 | 39,28 | 7,65 | 17,50 | 0,7159 | 0,1674 | |||
| MRK / Merck & Co., Inc. | 0,09 | 108,69 | 7,65 | 99,01 | 0,7155 | 0,3842 | |||
| REGN / Regeneron Pharmaceuticals, Inc. | 0,01 | 557,42 | 7,61 | 264,77 | 0,7117 | 0,5411 | |||
| MPC / Marathon Petroleum Corporation | 0,06 | −7,40 | 7,60 | −12,68 | 0,7110 | −0,0220 | |||
| US21871X1090 / Corebridge Financial, Inc. | 0,26 | −15,12 | 7,56 | −20,84 | 0,7075 | −0,0863 | |||
| AIG / American International Group, Inc. | 0,09 | −19,02 | 7,56 | −10,38 | 0,7068 | −0,0032 | |||
| TFC / Truist Financial Corporation | 0,20 | −12,92 | 7,51 | −9,91 | 0,7024 | −0,0277 | |||
| TGT / Target Corporation | 0,08 | 25,26 | 7,47 | −12,16 | 0,6985 | −0,0174 | |||
| PCAR / PACCAR Inc | 0,08 | 3,31 | 7,47 | −15,95 | 0,6984 | −0,0496 | |||
| EIX / Edison International | 0,14 | 79,44 | 7,32 | 77,82 | 0,6846 | 0,3380 | |||
| CFG / Citizens Financial Group, Inc. | 0,20 | 3,29 | 7,26 | −19,90 | 0,6788 | −0,0841 | |||
| DOW / Dow Inc. | 0,23 | 11,13 | 7,06 | −12,95 | 0,6604 | −0,0225 | |||
| FDX / FedEx Corporation | 0,03 | 11,60 | 6,95 | −11,38 | 0,6504 | −0,0103 | |||
| LYB / LyondellBasell Industries N.V. | 0,11 | −18,38 | 6,66 | −37,24 | 0,6233 | −0,2708 | |||
| AVTR / Avantor, Inc. | 0,50 | 6,46 | 0,6041 | 0,6041 | |||||
| LDOS / Leidos Holdings, Inc. | 0,04 | 3,24 | 6,42 | 6,98 | 0,6004 | 0,0952 | |||
| SLB / Schlumberger Limited | 0,19 | −29,04 | 6,41 | −41,43 | 0,5996 | −0,3219 | |||
| ULTA / Ulta Beauty, Inc. | 0,02 | 67,62 | 6,35 | 60,92 | 0,5942 | 0,2618 | |||
| KR / The Kroger Co. | 0,09 | −36,20 | 6,28 | −25,27 | 0,5873 | −0,1201 | |||
| DG / Dollar General Corporation | 0,07 | −39,11 | 6,27 | −19,72 | 0,5866 | −0,0711 | |||
| CHTR / Charter Communications, Inc. | 0,02 | 31,35 | 6,26 | 49,00 | 0,5853 | 0,2316 | |||
| ATO / Atmos Energy Corporation | 0,04 | −12,87 | 6,12 | −1,78 | 0,5720 | 0,0477 | |||
| ED / Consolidated Edison, Inc. | 0,05 | −43,02 | 6,00 | −31,47 | 0,5613 | −0,1760 | |||
| OC / Owens Corning | 0,04 | −15,78 | 5,99 | −33,64 | 0,5605 | −0,1999 | |||
| AKAM / Akamai Technologies, Inc. | 0,07 | 67,81 | 5,89 | 35,36 | 0,5510 | 0,1846 | |||
| DUK / Duke Energy Corporation | 0,05 | −37,62 | 5,89 | −32,03 | 0,5507 | −0,1787 | |||
| TRV / The Travelers Companies, Inc. | 0,02 | −35,67 | 5,88 | −30,70 | 0,5498 | −0,1644 | |||
| AEP / American Electric Power Company, Inc. | 0,05 | −40,39 | 5,84 | −34,35 | 0,5458 | −0,2026 | |||
| HIG / The Hartford Insurance Group, Inc. | 0,05 | −37,56 | 5,84 | −31,34 | 0,5458 | −0,1698 | |||
| DTE / DTE Energy Company | 0,04 | −38,33 | 5,83 | −29,53 | 0,5454 | −0,1513 | |||
| ABT / Abbott Laboratories | 0,04 | 5,80 | 0,5426 | 0,5426 | |||||
| NVR / NVR, Inc. | 0,00 | 59,72 | 5,79 | 41,99 | 0,5418 | 0,1983 | |||
| HSY / The Hershey Company | 0,03 | 39,84 | 5,75 | 56,67 | 0,5381 | 0,2289 | |||
| AFL / Aflac Incorporated | 0,05 | 169,90 | 5,75 | 173,12 | 0,5381 | 0,3608 | |||
| D / Dominion Energy, Inc. | 0,10 | −32,16 | 5,71 | −33,64 | 0,5339 | −0,1904 | |||
| BK / The Bank of New York Mellon Corporation | 0,07 | −63,53 | 5,64 | −35,35 | 0,5278 | −0,1691 | |||
| BAC / Bank of America Corporation | 0,14 | 48,75 | 5,62 | 28,11 | 0,5261 | 0,1565 | |||
| CSX / CSX Corporation | 0,20 | 6,04 | 5,61 | −9,45 | 0,5251 | 0,0031 | |||
| GIS / General Mills, Inc. | 0,10 | 3,14 | 5,59 | −2,68 | 0,5224 | 0,0391 | |||
| CB / Chubb Limited | 0,02 | −35,39 | 5,58 | −32,02 | 0,5215 | −0,1690 | |||
| L / Loews Corporation | 0,06 | −34,93 | 5,56 | −33,88 | 0,5201 | −0,1880 | |||
| HOLX / Hologic, Inc. | 0,10 | 12,86 | 5,55 | −8,95 | 0,5187 | 0,0059 | |||
| RF / Regions Financial Corporation | 0,27 | 4,67 | 5,53 | −13,30 | 0,5171 | −0,0198 | |||
| SNA / Snap-on Incorporated | 0,02 | −2,59 | 5,48 | −13,93 | 0,5126 | −0,0236 | |||
| HPQ / HP Inc. | 0,21 | 66,44 | 5,44 | 30,96 | 0,5083 | 0,1589 | |||
| OMC / Omnicom Group Inc. | 0,07 | 46,57 | 5,41 | 28,62 | 0,5057 | 0,1517 | |||
| FITB / Fifth Third Bancorp | 0,15 | 4,30 | 5,40 | −15,40 | 0,5047 | −0,0323 | |||
| ZBH / Zimmer Biomet Holdings, Inc. | 0,05 | −34,09 | 5,36 | −37,96 | 0,5012 | −0,2261 | |||
| BBY / Best Buy Co., Inc. | 0,08 | 12,72 | 5,33 | −12,45 | 0,4988 | −0,0141 | |||
| JBHT / J.B. Hunt Transport Services, Inc. | 0,04 | 62,92 | 5,19 | 24,26 | 0,4859 | 0,1338 | |||
| FOXA / Fox Corporation | 0,10 | −51,51 | 5,18 | −52,83 | 0,4843 | −0,4399 | |||
| UPS / United Parcel Service, Inc. | 0,05 | 61,92 | 5,10 | 35,07 | 0,4770 | 0,1591 | |||
| PSX / Phillips 66 | 0,05 | −47,87 | 4,96 | −53,98 | 0,4639 | −0,4436 | |||
| NRG / NRG Energy, Inc. | 0,04 | 4,63 | 0,4327 | 0,4327 | |||||
| BAH / Booz Allen Hamilton Holding Corporation | 0,04 | 4,62 | 0,4326 | 0,4326 | |||||
| ARE / Alexandria Real Estate Equities, Inc. | 0,06 | 1,97 | 4,62 | −23,89 | 0,4324 | −0,0790 | |||
| UBER / Uber Technologies, Inc. | 0,06 | 4,48 | 0,4191 | 0,4191 | |||||
| STX / Seagate Technology Holdings plc | 0,05 | −1,75 | 4,32 | −7,18 | 0,4039 | 0,0122 | |||
| CNP / CenterPoint Energy, Inc. | 0,11 | −42,01 | 4,31 | −30,96 | 0,4034 | −0,1226 | |||
| FE / FirstEnergy Corp. | 0,10 | −34,84 | 4,28 | −29,79 | 0,3999 | −0,1129 | |||
| DGX / Quest Diagnostics Incorporated | 0,02 | −40,97 | 4,24 | −35,50 | 0,3970 | −0,1570 | |||
| LHX / L3Harris Technologies, Inc. | 0,02 | 99,56 | 4,24 | 107,14 | 0,3962 | 0,2240 | |||
| ZM / Zoom Communications Inc. | 0,05 | 6,98 | 4,24 | −4,60 | 0,3962 | 0,0224 | |||
| AMAT / Applied Materials, Inc. | 0,03 | 4,19 | 0,3914 | 0,3914 | |||||
| LH / Labcorp Holdings Inc. | 0,02 | 4,17 | 0,3903 | 0,3903 | |||||
| BFB / Brown-Forman Corp. - Class B | 0,12 | 8,21 | 4,14 | 14,22 | 0,3869 | 0,0819 | |||
| DELL / Dell Technologies Inc. | 0,04 | −47,92 | 4,06 | 6,04 | 0,3794 | 0,0497 | |||
| WEC / WEC Energy Group, Inc. | 0,04 | −16,55 | 4,05 | −7,94 | 0,3788 | 0,0084 | |||
| MDLZ / Mondelez International, Inc. | 0,06 | 74,86 | 4,05 | 105,49 | 0,3785 | 0,2126 | |||
| HCA / HCA Healthcare, Inc. | 0,01 | −10,22 | 4,02 | −14,67 | 0,3764 | −0,0092 | |||
| PPG / PPG Industries, Inc. | 0,04 | 5,64 | 4,01 | −0,35 | 0,3752 | 0,0363 | |||
| MOH / Molina Healthcare, Inc. | 0,01 | −41,50 | 4,00 | −38,38 | 0,3742 | −0,1724 | |||
| AEE / Ameren Corporation | 0,04 | −41,21 | 3,98 | −38,07 | 0,3726 | −0,1690 | |||
| FNF / Fidelity National Financial, Inc. | 0,06 | −16,58 | 3,97 | −8,13 | 0,3710 | 0,0074 | |||
| CMS / CMS Energy Corporation | 0,05 | −41,25 | 3,95 | −34,44 | 0,3696 | −0,1379 | |||
| NXPI / NXP Semiconductors N.V. | 0,02 | 3,91 | 0,3655 | 0,3655 | |||||
| ELV / Elevance Health, Inc. | 0,01 | −58,99 | 3,90 | −56,42 | 0,3645 | −0,3883 | |||
| QCOM / QUALCOMM Incorporated | 0,03 | 157,16 | 3,89 | 110,94 | 0,3643 | 0,2133 | |||
| HRL / Hormel Foods Corporation | 0,13 | −1,95 | 3,89 | −2,21 | 0,3643 | 0,0289 | |||
| AVY / Avery Dennison Corporation | 0,02 | 108,86 | 3,87 | 92,45 | 0,3624 | 0,1928 | |||
| ALL / The Allstate Corporation | 0,02 | −68,56 | 3,86 | −46,68 | 0,3611 | −0,2631 | |||
| NOC / Northrop Grumman Corporation | 0,01 | −39,24 | 3,83 | −33,83 | 0,3582 | −0,1487 | |||
| LNT / Alliant Energy Corporation | 0,06 | −39,15 | 3,82 | −36,92 | 0,3575 | −0,1527 | |||
| NSC / Norfolk Southern Corporation | 0,02 | 96,85 | 3,81 | 72,76 | 0,3565 | 0,1707 | |||
| KIM / Kimco Realty Corporation | 0,19 | 6,68 | 3,79 | −5,06 | 0,3546 | 0,0184 | |||
| PKG / Packaging Corporation of America | 0,02 | 9,93 | 3,78 | −4,04 | 0,3533 | 0,0218 | |||
| PRU / Prudential Financial, Inc. | 0,04 | −29,73 | 3,71 | −40,23 | 0,3467 | −0,1755 | |||
| PNC / The PNC Financial Services Group, Inc. | 0,02 | 6,11 | 3,68 | −15,13 | 0,3446 | −0,0210 | |||
| CG / The Carlyle Group Inc. | 0,09 | 3,57 | 0,3341 | 0,3341 | |||||
| JEF / Jefferies Financial Group Inc. | 0,08 | 3,52 | 0,3288 | 0,3288 | |||||
| LUV / Southwest Airlines Co. | 0,12 | 98,87 | 3,36 | 81,06 | 0,3138 | 0,1578 | |||
| ALGN / Align Technology, Inc. | 0,01 | 2,14 | 0,2002 | 0,2002 | |||||
| ROST / Ross Stores, Inc. | 0,02 | 2,13 | 0,1996 | 0,1996 | |||||
| LMT / Lockheed Martin Corporation | 0,00 | −48,79 | 2,10 | −47,15 | 0,1963 | −0,1381 | |||
| CASY / Casey's General Stores, Inc. | 0,00 | 2,09 | 0,1955 | 0,1955 | |||||
| CI / The Cigna Group | 0,01 | −60,49 | 2,03 | −54,34 | 0,1896 | −0,1842 | |||
| IFF / International Flavors & Fragrances Inc. | 0,03 | 1,26 | 1,98 | −1,54 | 0,1855 | 0,0091 | |||
| WRB / W. R. Berkley Corporation | 0,03 | −20,47 | 1,98 | −3,09 | 0,1849 | 0,0131 | |||
| GD / General Dynamics Corporation | 0,01 | −54,50 | 1,96 | −51,82 | 0,1832 | −0,1590 | |||
| HUM / Humana Inc. | 0,01 | −54,87 | 1,94 | −59,66 | 0,1818 | −0,2238 | |||
| GPC / Genuine Parts Company | 0,02 | −68,41 | 1,94 | −68,06 | 0,1810 | −0,3292 | |||
| RJF / Raymond James Financial, Inc. | 0,01 | −60,56 | 1,94 | −63,54 | 0,1810 | −0,2599 | |||
| LRCX / Lam Research Corporation | 0,03 | 1,93 | 0,1809 | 0,1809 | |||||
| IEX / IDEX Corporation | 0,01 | 8,93 | 1,89 | −11,70 | 0,1764 | −0,0011 | |||
| EMR / Emerson Electric Co. | 0,02 | −22,28 | 1,88 | −10,60 | 0,1759 | 0,0080 | |||
| LOW / Lowe's Companies, Inc. | 0,01 | 2,31 | 1,88 | −12,07 | 0,1759 | −0,0041 | |||
| FTV / Fortive Corporation | 0,03 | −0,88 | 1,87 | −15,05 | 0,1748 | −0,0105 | |||
| FCX / Freeport-McMoRan Inc. | 0,05 | −2,73 | 1,87 | −2,25 | 0,1746 | 0,0138 | |||
| MMM / 3M Company | 0,01 | −58,62 | 1,86 | −62,24 | 0,1736 | −0,2401 | |||
| MDT / Medtronic plc | 0,02 | −58,15 | 1,85 | −60,95 | 0,1731 | −0,2258 | |||
| MET / MetLife, Inc. | 0,02 | −33,62 | 1,84 | −20,58 | 0,1723 | −0,0128 | |||
| TDY / Teledyne Technologies Incorporated | 0,00 | −56,10 | 1,84 | −60,00 | 0,1718 | −0,2148 | |||
| KMB / Kimberly-Clark Corporation | 0,01 | −6,17 | 1,82 | −8,41 | 0,1700 | 0,0077 | |||
| ODFL / Old Dominion Freight Line, Inc. | 0,01 | 3,10 | 1,82 | −14,85 | 0,1700 | −0,0097 | |||
| EQT / EQT Corporation | 0,04 | −72,18 | 1,82 | −73,10 | 0,1698 | −0,3984 | |||
| RPM / RPM International Inc. | 0,02 | 2,89 | 1,81 | −13,27 | 0,1693 | −0,0064 | |||
| DIS / The Walt Disney Company | 0,02 | −56,40 | 1,81 | −58,79 | 0,1691 | −0,1952 | |||
| PLD / Prologis, Inc. | 0,02 | 1,79 | 0,1678 | 0,1678 | |||||
| EXPD / Expeditors International of Washington, Inc. | 0,02 | −10,92 | 1,79 | −13,80 | 0,1677 | −0,0074 | |||
| UNP / Union Pacific Corporation | 0,01 | −1,13 | 1,79 | −12,81 | 0,1675 | −0,0021 | |||
| SSNC / SS&C Technologies Holdings, Inc. | 0,02 | −12,27 | 1,78 | −18,09 | 0,1661 | −0,0164 | |||
| TER / Teradyne, Inc. | 0,02 | 27,51 | 1,76 | −2,06 | 0,1649 | 0,0073 | |||
| NKE / NIKE, Inc. | 0,03 | 15,28 | 1,74 | −15,43 | 0,1630 | −0,0106 | |||
| DD / DuPont de Nemours, Inc. | 0,03 | −51,93 | 1,73 | −58,71 | 0,1622 | −0,1913 | |||
| PKI / Revvity Inc. | 0,02 | 2,01 | 1,73 | −24,43 | 0,1620 | −0,0310 | |||
| IQV / IQVIA Holdings Inc. | 0,01 | 7,79 | 1,73 | −17,03 | 0,1614 | −0,0136 | |||
| PFG / Principal Financial Group, Inc. | 0,02 | −6,43 | 1,72 | −15,78 | 0,1613 | −0,0089 | |||
| MAS / Masco Corporation | 0,03 | 0,92 | 1,71 | −22,88 | 0,1599 | −0,0267 | |||
| GEHC / GE HealthCare Technologies Inc. | 0,02 | −54,73 | 1,71 | −56,61 | 0,1599 | −0,1851 | |||
| US61747C5821 / Morgan Stanley Institutional Liquidity Funds - Treasury Portfolio | 1,23 | 10,32 | 1,23 | 10,38 | 0,1155 | 0,0212 | |||
| J / Jacobs Solutions Inc. | 0,00 | −100,00 | 0,00 | −100,00 | −0,1792 | ||||
| NDSN / Nordson Corporation | 0,00 | −100,00 | 0,00 | −100,00 | −0,1798 | ||||
| DAL / Delta Air Lines, Inc. | 0,00 | −100,00 | 0,00 | −100,00 | −0,9754 | ||||
| RGA / Reinsurance Group of America, Incorporated | 0,00 | −100,00 | 0,00 | −100,00 | −0,1822 | ||||
| EQR / Equity Residential | 0,00 | −100,00 | 0,00 | −100,00 | −0,5044 |