Grunnleggende statistikk
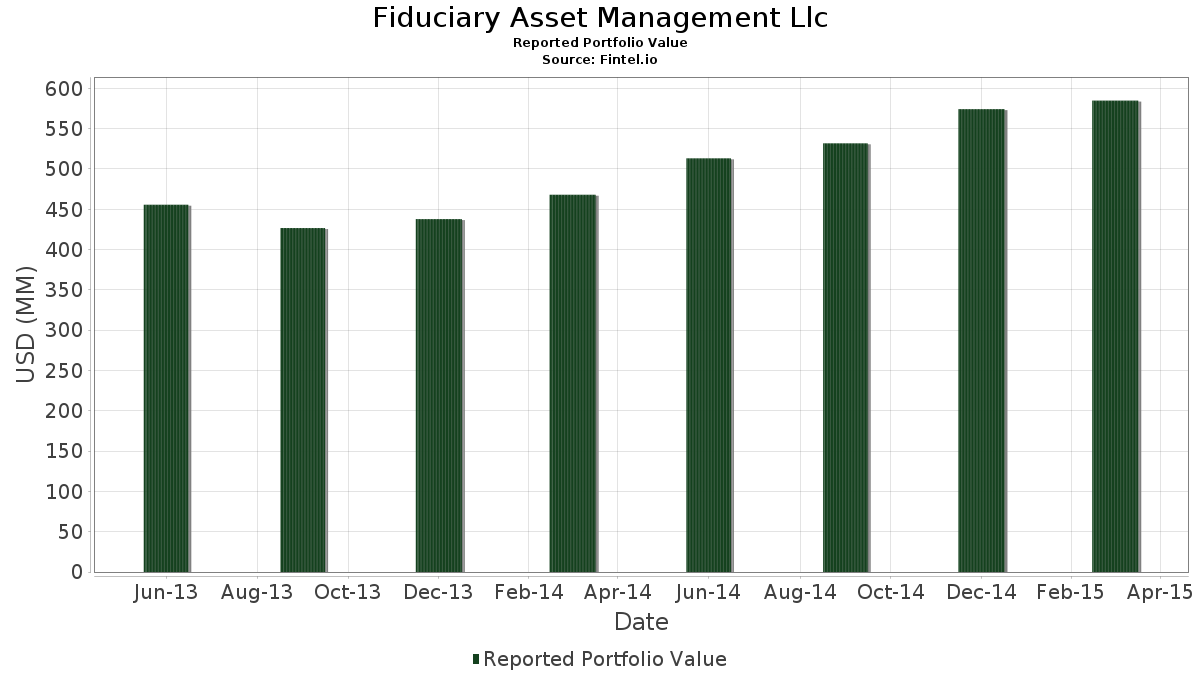
| Porteføljeverdi | $ 584 802 000 |
| Nåværende posisjoner | 86 |
Siste beholdninger, prestasjoner, forvaltet kapital (fra 13F, 13D)
Fiduciary Asset Management Llc har oppgitt 86 totale beholdninger i sine siste SEC-arkiveringer. Siste porteføljeverdi er beregnet til 584 802 000 USD. Faktisk forvaltet kapital (AUM) er denne verdien pluss kontanter (som ikke er oppgitt). Fiduciary Asset Management Llcs største beholdninger er The Coca-Cola Company (US:KO) , Union Pacific Corporation (US:UNP) , Apple Inc. (US:AAPL) , Whirlpool Corporation (US:WHR) , and The Home Depot, Inc. (US:HD) . Fiduciary Asset Management Llcs nye posisjoner inkluderer Ford Motor Company (US:F) , Macy's, Inc. (US:M) , Walgreens Boots Alliance, Inc. (US:WBA) , Western Midstream Partners, LP - Limited Partnership (US:WES) , and .
De største økningene dette kvartalet
Vi bruker endringen i porteføljeallokeringen fordi dette er det mest meningsfulle målet. Endringer kan skyldes handler eller endringer i aksjekursene.
| Verdipapirer | Aksjer (MM) |
Verdi (MM$) |
Portefølje % | ΔPortefølje % |
|---|---|---|---|---|
| 0,32 | 15,15 | 2,5903 | 2,5903 | |
| 0,90 | 14,56 | 2,4902 | 2,4902 | |
| 0,06 | 12,62 | 2,1587 | 1,9884 | |
| 0,10 | 10,09 | 1,7252 | 1,6806 | |
| 0,13 | 8,71 | 1,4892 | 1,4892 | |
| 0,28 | 12,42 | 2,1231 | 0,6548 | |
| 0,19 | 18,38 | 3,1423 | 0,6485 | |
| 0,19 | 23,14 | 3,9569 | 0,6288 | |
| 0,29 | 14,22 | 2,4311 | 0,3332 | |
| 0,02 | 1,92 | 0,3285 | 0,3285 |
De største reduksjonene dette kvartalet
Vi bruker endringen i porteføljeallokeringen fordi dette er det mest meningsfulle målet. Endringer kan skyldes handler eller endringer i aksjekurser.
| Verdipapirer | Aksjer (MM) |
Verdi (MM$) |
Portefølje % | ΔPortefølje % |
|---|---|---|---|---|
| 0,04 | 2,68 | 0,4578 | −2,2100 | |
| 0,03 | 3,11 | 0,5318 | −1,2671 | |
| 0,08 | 4,27 | 0,7302 | −1,2620 | |
| 0,03 | 2,42 | 0,4142 | −0,9939 | |
| 0,00 | 0,00 | −0,7583 | ||
| 0,24 | 25,84 | 4,4186 | −0,6635 | |
| 0,11 | 13,27 | 2,2698 | −0,5391 | |
| 0,03 | 1,43 | 0,2442 | −0,2923 | |
| 0,10 | 10,50 | 1,7962 | −0,2718 | |
| 0,12 | 13,08 | 2,2365 | −0,2445 |
13F- og Fondsarkiveringer
Dette skjemaet ble sendt inn den 2015-04-14 for rapporteringsperioden 2015-03-31. Klikk på lenkeikonet for å se hele transaksjonshistorikken.
Oppgradere for å låse opp premiedata og eksportere til Excel![]() .
.
| Verdipapirer | Type | Gjennomsnittlig aksjekurs | Aksjer (MM) |
ΔAksjer (%) |
ΔAksjer (%) |
Verdi ($MM) |
Portefølje (%) |
ΔPortefølje (%) |
|
|---|---|---|---|---|---|---|---|---|---|
| KO / The Coca-Cola Company | 0,95 | 7,84 | 38,64 | 3,58 | 6,6067 | 0,1103 | |||
| UNP / Union Pacific Corporation | 0,24 | −2,60 | 25,84 | −11,45 | 4,4186 | −0,6635 | |||
| AAPL / Apple Inc. | 0,19 | 7,42 | 23,14 | 21,09 | 3,9569 | 0,6288 | |||
| WHR / Whirlpool Corporation | 0,10 | −3,96 | 19,66 | 0,16 | 3,3627 | −0,0565 | |||
| HD / The Home Depot, Inc. | 0,16 | −4,15 | 18,73 | 3,75 | 3,2033 | 0,0587 | |||
| PEP / PepsiCo, Inc. | 0,19 | 26,91 | 18,38 | 28,33 | 3,1423 | 0,6485 | |||
| CVS / CVS Health Corporation | 0,17 | −3,68 | 17,73 | 3,23 | 3,0309 | 0,0405 | |||
| JNJ / Johnson & Johnson | 0,17 | 7,03 | 16,97 | 2,97 | 2,9018 | 0,0316 | |||
| GE / General Electric Company | 0,63 | −0,33 | 15,68 | −2,15 | 2,6811 | −0,1094 | |||
| PFE / Pfizer Inc. | 0,45 | −7,38 | 15,59 | 3,44 | 2,6650 | 0,0410 | |||
| HON / Honeywell International Inc. | 0,15 | 0,52 | 15,58 | 4,94 | 2,6641 | 0,0785 | |||
| DOW / Dow Inc. | 0,32 | 2,76 | 15,15 | 8,10 | 2,5903 | 2,5903 | |||
| BAX / Baxter International Inc. | 0,22 | 19,85 | 15,10 | 12,01 | 2,5816 | 0,2343 | |||
| F / Ford Motor Company | 0,90 | 14,56 | 2,4902 | 2,4902 | |||||
| T / AT&T Inc. | 0,44 | 16,31 | 14,46 | 13,05 | 2,4726 | 0,2450 | |||
| VZ / Verizon Communications Inc. | 0,29 | 13,52 | 14,22 | 18,02 | 2,4311 | 0,3332 | |||
| C.WSA / Citigroup, Inc. | 0,04 | −0,27 | 14,01 | 2,04 | 2,3950 | 0,0045 | |||
| CSCO / Cisco Systems, Inc. | 0,50 | −4,24 | 13,82 | −5,24 | 2,3629 | −0,1767 | |||
| JPM / JPMorgan Chase & Co. | 0,22 | 0,67 | 13,40 | −2,54 | 2,2917 | −0,1031 | |||
| WMT / Walmart Inc. | 0,16 | 12,65 | 13,35 | 7,90 | 2,2830 | 0,1280 | |||
| RTX / RTX Corporation | 0,11 | −19,25 | 13,27 | −17,70 | 2,2698 | −0,5391 | |||
| RTN / Raytheon Co. | 0,12 | −9,10 | 13,08 | −8,19 | 2,2365 | −0,2445 | |||
| SPY / SPDR S&P 500 ETF | 0,06 | 1 185,81 | 12,62 | 1 190,80 | 2,1587 | 1,9884 | |||
| DAL / Delta Air Lines, Inc. | 0,28 | 61,12 | 12,42 | 47,27 | 2,1231 | 0,6548 | |||
| LMT / Lockheed Martin Corporation | 0,06 | −3,60 | 12,25 | 1,60 | 2,0952 | −0,0051 | |||
| EMC / Global X Funds - Global X Emerging Markets Great Consumer ETF | 0,47 | 25,47 | 11,95 | 7,84 | 2,0436 | 0,1136 | |||
| TWX / Warner Media LLC | 0,13 | −4,33 | 11,40 | −5,43 | 1,9487 | −0,1499 | |||
| CVX / Chevron Corporation | 0,10 | −5,47 | 10,50 | −11,54 | 1,7962 | −0,2718 | |||
| UPS / United Parcel Service, Inc. | 0,10 | 4 415,31 | 10,09 | 3 841,02 | 1,7252 | 1,6806 | |||
| EPD / Enterprise Products Partners L.P. - Limited Partnership | 0,30 | −0,26 | 9,99 | −9,06 | 1,7088 | −0,2050 | |||
| M / Macy's, Inc. | 0,13 | 8,71 | 1,4892 | 1,4892 | |||||
| IBM / International Business Machines Corporation | 0,05 | 20,73 | 8,57 | 20,78 | 1,4658 | 0,2298 | |||
| COP / ConocoPhillips | 0,13 | −3,02 | 7,98 | −12,57 | 1,3639 | −0,2249 | |||
| KMI / Kinder Morgan, Inc. | 0,18 | −1,69 | 7,72 | −2,28 | 1,3199 | −0,0557 | |||
| EPC / Edgewell Personal Care Company | 0,04 | 0,00 | 6,16 | 7,39 | 1,0539 | 0,0544 | |||
| PG / The Procter & Gamble Company | 0,07 | −4,17 | 6,04 | −13,78 | 1,0337 | −0,1873 | |||
| MMP / Magellan Midstream Partners L.P. | 0,06 | −0,43 | 4,88 | −7,60 | 0,8352 | −0,0854 | |||
| GIS / General Mills, Inc. | 0,08 | −64,83 | 4,27 | −62,67 | 0,7302 | −1,2620 | |||
| PAA / Plains All American Pipeline, L.P. - Limited Partnership | 0,09 | −0,28 | 4,26 | −5,25 | 0,7285 | −0,0546 | |||
| 30064K105 / Exacttarget, Inc. | 0,05 | −2,37 | 3,24 | 7,81 | 0,5545 | 0,0307 | |||
| 19041P105 / CBS Corp. | 0,05 | 0,00 | 3,13 | 9,58 | 0,5361 | 0,0378 | |||
| KMB / Kimberly-Clark Corporation | 0,03 | −67,51 | 3,11 | −69,89 | 0,5318 | −1,2671 | |||
| TGT / Target Corporation | 0,04 | 0,00 | 2,87 | 8,09 | 0,4911 | 0,0284 | |||
| QCOM / QUALCOMM Incorporated | 0,04 | −81,27 | 2,68 | −82,52 | 0,4578 | −2,2100 | |||
| US1182301010 / Buckeye Partners, L.P. | 0,03 | −1,13 | 2,51 | −1,34 | 0,4294 | −0,0139 | |||
| DFS / Discover Financial Services | 0,04 | 76,01 | 2,43 | 51,40 | 0,4155 | 0,1360 | |||
| AXP / American Express Company | 0,03 | −64,32 | 2,42 | −70,04 | 0,4142 | −0,9939 | |||
| ETN / Eaton Corporation plc | 0,03 | 0,00 | 2,24 | −0,04 | 0,3834 | −0,0073 | |||
| TJX / The TJX Companies, Inc. | 0,03 | −3,39 | 2,23 | −1,33 | 0,3810 | −0,0123 | |||
| INTC / Intel Corporation | 0,07 | 598,50 | 2,19 | 501,65 | 0,3745 | 0,3111 | |||
| EEP / Enbridge Energy Partners, L.P. | 0,06 | 0,00 | 2,04 | −9,75 | 0,3483 | −0,0447 | |||
| CAT / Caterpillar Inc. | 0,02 | 1,92 | 0,3285 | 0,3285 | |||||
| STJ / St. Jude Medical, Inc. | 0,03 | 0,00 | 1,64 | 0,55 | 0,2796 | −0,0036 | |||
| US87233Q1085 / TC Pipelines, LP | 0,02 | −1,36 | 1,61 | −9,75 | 0,2755 | −0,0354 | |||
| OXY / Occidental Petroleum Corporation | 0,02 | 0,00 | 1,47 | −9,44 | 0,2509 | −0,0313 | |||
| EMR / Emerson Electric Co. | 0,03 | −28,74 | 1,43 | −37,61 | 0,2442 | −0,2923 | |||
| WES / Western Midstream Partners, LP - Limited Partnership | 0,02 | 2,39 | 1,38 | −7,67 | 0,2367 | −0,0244 | |||
| WPZ / Access Midstream Partners, L.P | 0,03 | −8,66 | 1,36 | 0,44 | 0,2331 | −0,0033 | |||
| SXL / Sunoco Logistics Partners L.P. | 0,02 | 0,00 | 1,31 | −14,23 | 0,2237 | −0,0419 | |||
| GEL / Genesis Energy, L.P. - Limited Partnership | 0,02 | −1,54 | 1,10 | 9,05 | 0,1876 | 0,0124 | |||
| WBA / Walgreens Boots Alliance, Inc. | 0,01 | 1,02 | 0,1737 | 0,1737 | |||||
| XOM / Exxon Mobil Corporation | 0,01 | 0,00 | 0,84 | −8,00 | 0,1435 | −0,0154 | |||
| OKS / ONEOK Partners, L.P. | 0,02 | 0,00 | 0,80 | 2,96 | 0,1366 | 0,0015 | |||
| DCP / DCP Midstream LP - Unit | 0,02 | −0,40 | 0,79 | −19,06 | 0,1351 | −0,0349 | |||
| EEQ / Enbridge Energy Management LLC. | 0,02 | 1,53 | 0,55 | −4,85 | 0,0939 | −0,0066 | |||
| HSIC / Henry Schein, Inc. | 0,00 | −25,05 | 0,52 | −23,04 | 0,0891 | −0,0288 | |||
| AET / Aetna, Inc. | 0,00 | −32,05 | 0,48 | −18,43 | 0,0817 | −0,0203 | |||
| KDP / Keurig Dr Pepper Inc. | 0,01 | 0,00 | 0,46 | 9,38 | 0,0778 | 0,0054 | |||
| RGP / Resources Connection, Inc. | 0,02 | 0,00 | 0,40 | −4,49 | 0,0691 | −0,0046 | |||
| AB / AllianceBernstein Holding L.P. - Limited Partnership | 0,01 | 0,00 | 0,39 | 19,39 | 0,0674 | 0,0099 | |||
| TOO / Teekay Offshore Partners L.P. | 0,02 | −1,03 | 0,39 | −22,02 | 0,0660 | −0,0202 | |||
| ANDX / Tesoro Logistics LP | 0,01 | 2,04 | 0,38 | −6,70 | 0,0643 | −0,0059 | |||
| DTE / DTE Energy Company | 0,00 | 0,00 | 0,35 | −6,65 | 0,0600 | −0,0055 | |||
| DOW / Dow Inc. | 0,00 | 0,00 | 0,33 | −3,48 | 0,0569 | −0,0031 | |||
| NGLS / Targa Resources Partners LP | 0,01 | 51,87 | 0,31 | 31,38 | 0,0537 | 0,0121 | |||
| NS / NuStar Energy L.P. - Limited Partnership | 0,01 | 0,00 | 0,31 | 5,37 | 0,0537 | 0,0018 | |||
| MWE / MarkWest Energy Partners, LP | 0,00 | 0,00 | 0,31 | −1,59 | 0,0528 | −0,0018 | |||
| MCD / McDonald's Corporation | 0,00 | −16,34 | 0,29 | −13,21 | 0,0494 | −0,0086 | |||
| KRFT / | 0,00 | 0,27 | 0,0455 | 0,0455 | |||||
| MRK / Merck & Co., Inc. | 0,00 | 0,00 | 0,25 | 1,21 | 0,0427 | −0,0003 | |||
| USB / U.S. Bancorp | 0,01 | 0,00 | 0,23 | −2,55 | 0,0392 | −0,0018 | |||
| WES / Western Midstream Partners, LP - Limited Partnership | 0,00 | 0,22 | 0,0373 | −0,0028 | |||||
| PM / Philip Morris International Inc. | 0,00 | 0,00 | 0,21 | −7,59 | 0,0354 | −0,0036 | |||
| CEQP / Crestwood Equity Partners LP - Unit | 0,03 | −1,89 | 0,19 | −27,44 | 0,0330 | −0,0133 | |||
| ARNGF / Argonaut Gold Inc. | 0,03 | 0,00 | 0,04 | −12,50 | 0,0060 | −0,0010 | |||
| IFUE / Fuel Performance Solutions, Inc. | 0,10 | 0,00 | 0,01 | 0,00 | 0,0014 | −0,0000 | |||
| ROST / Ross Stores, Inc. | 0,00 | −100,00 | 0,00 | −100,00 | −0,7583 |