Grunnleggende statistikk
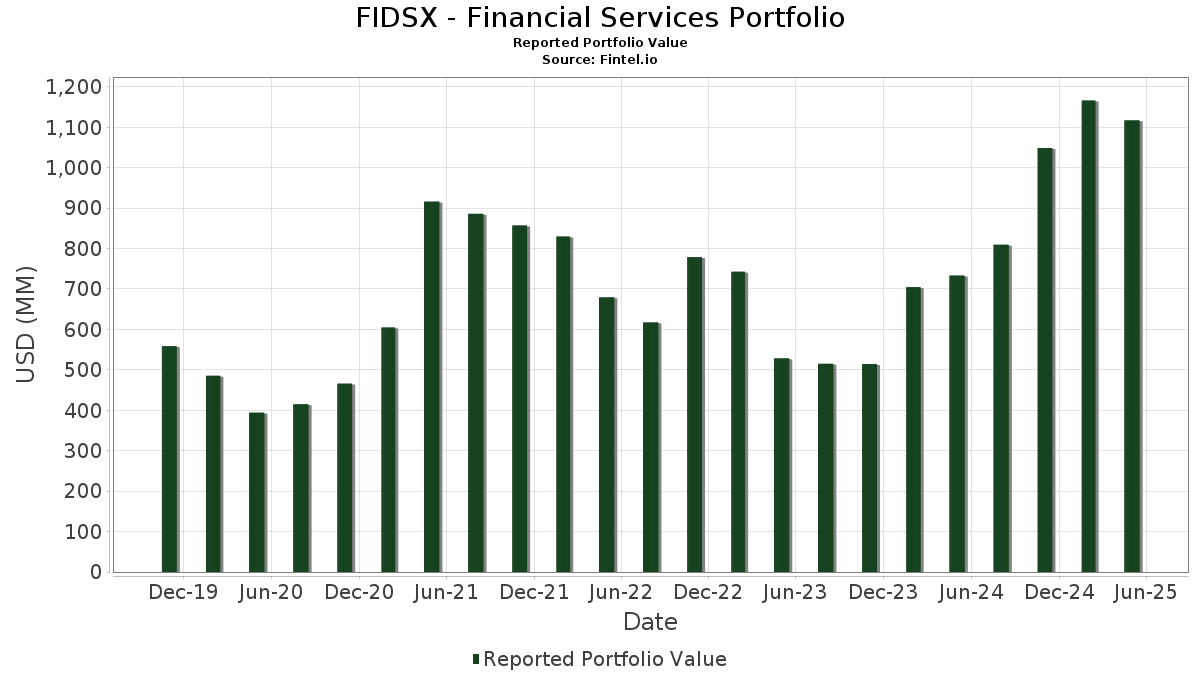
| Porteføljeverdi | $ 1 116 875 022 |
| Nåværende posisjoner | 65 |
Siste beholdninger, prestasjoner, forvaltet kapital (fra 13F, 13D)
FIDSX - Financial Services Portfolio har oppgitt 65 totale beholdninger i sine siste SEC-arkiveringer. Siste porteføljeverdi er beregnet til 1 116 875 022 USD. Faktisk forvaltet kapital (AUM) er denne verdien pluss kontanter (som ikke er oppgitt). FIDSX - Financial Services Portfolios største beholdninger er Mastercard Incorporated (US:MA) , Fidelity Securities Lending Cash Central Fund (US:US31635A3032) , Wells Fargo & Company (US:WFC) , Bank of America Corporation (US:BAC) , and Reinsurance Group of America, Incorporated (US:RGA) . FIDSX - Financial Services Portfolios nye posisjoner inkluderer PayPal Holdings, Inc. (US:PYPL) , TransUnion (US:TRU) , AUB Group Limited (US:AUBBF) , United Community Banks, Inc. (US:UCBI) , and .
De største økningene dette kvartalet
Vi bruker endringen i porteføljeallokeringen fordi dette er det mest meningsfulle målet. Endringer kan skyldes handler eller endringer i aksjekursene.
| Verdipapirer | Aksjer (MM) |
Verdi (MM$) |
Portefølje % | ΔPortefølje % |
|---|---|---|---|---|
| 71,68 | 71,68 | 6,8509 | 2,3967 | |
| 0,19 | 109,74 | 10,4881 | 1,5638 | |
| 0,19 | 13,52 | 1,2923 | 1,2923 | |
| 0,15 | 12,72 | 1,2161 | 1,2161 | |
| 0,53 | 11,75 | 1,1233 | 1,1233 | |
| 0,43 | 37,55 | 3,5890 | 1,0362 | |
| 0,11 | 21,67 | 2,0707 | 0,8796 | |
| 1,30 | 57,49 | 5,4942 | 0,5483 | |
| 0,19 | 5,54 | 0,5296 | 0,5296 | |
| 0,25 | 20,87 | 1,9944 | 0,4087 |
De største reduksjonene dette kvartalet
Vi bruker endringen i porteføljeallokeringen fordi dette er det mest meningsfulle målet. Endringer kan skyldes handler eller endringer i aksjekurser.
| Verdipapirer | Aksjer (MM) |
Verdi (MM$) |
Portefølje % | ΔPortefølje % |
|---|---|---|---|---|
| 0,21 | 8,59 | 0,8209 | −0,8295 | |
| 0,23 | 7,35 | 0,7028 | −0,5457 | |
| 0,48 | 36,38 | 3,4768 | −0,5221 | |
| 0,08 | 19,37 | 1,8513 | −0,4884 | |
| 0,27 | 10,39 | 0,9932 | −0,4666 | |
| 1,71 | 1,71 | 0,1637 | −0,2567 | |
| 0,14 | 18,07 | 1,7274 | −0,2554 | |
| 0,33 | 13,38 | 1,2787 | −0,2260 | |
| 0,24 | 12,63 | 1,2069 | −0,2059 | |
| 0,50 | 10,49 | 1,0028 | −0,1622 |
13F- og Fondsarkiveringer
Dette skjemaet ble sendt inn den 2025-07-24 for rapporteringsperioden 2025-05-31. Klikk på lenkeikonet for å se hele transaksjonshistorikken.
Oppgradere for å låse opp premiedata og eksportere til Excel![]() .
.
| Verdipapirer | Type | Gjennomsnittlig aksjekurs | Aksjer (MM) |
ΔAksjer (%) |
ΔAksjer (%) |
Verdi ($MM) |
Portefølje (%) |
ΔPortefølje (%) |
|
|---|---|---|---|---|---|---|---|---|---|
| MA / Mastercard Incorporated | 0,19 | 8,32 | 109,74 | 10,07 | 10,4881 | 1,5638 | |||
| US31635A3032 / Fidelity Securities Lending Cash Central Fund | 71,68 | 44,05 | 71,68 | 44,05 | 6,8509 | 2,3967 | |||
| WFC / Wells Fargo & Company | 0,86 | 0,00 | 64,03 | −4,52 | 6,1190 | 0,1168 | |||
| BAC / Bank of America Corporation | 1,30 | 8,69 | 57,49 | 4,04 | 5,4942 | 0,5483 | |||
| RGA / Reinsurance Group of America, Incorporated | 0,19 | 0,00 | 39,06 | 0,30 | 3,7334 | 0,2471 | |||
| SCHW / The Charles Schwab Corporation | 0,43 | 18,54 | 37,55 | 31,68 | 3,5890 | 1,0362 | |||
| C / Citigroup Inc. | 0,48 | −13,56 | 36,38 | −18,57 | 3,4768 | −0,5221 | |||
| CB / Chubb Limited | 0,12 | −2,46 | 34,18 | 1,54 | 3,2664 | 0,2537 | |||
| STT / State Street Corporation | 0,26 | 9,90 | 25,12 | 6,63 | 2,4007 | 0,2921 | |||
| MS / Morgan Stanley | 0,19 | −6,34 | 24,21 | −9,91 | 2,3138 | −0,0918 | |||
| COF / Capital One Financial Corporation | 0,11 | 112,52 | 21,67 | 260,02 | 2,0707 | 0,8796 | |||
| LPLA / LPL Financial Holdings Inc. | 0,06 | −7,32 | 21,56 | −3,48 | 2,0610 | 0,0612 | |||
| NDAQ / Nasdaq, Inc. | 0,25 | 16,73 | 20,87 | 17,81 | 1,9944 | 0,4087 | |||
| MMC / Marsh & McLennan Companies, Inc. | 0,08 | −24,57 | 19,37 | −25,89 | 1,8513 | −0,4884 | |||
| SLM / SLM Corporation | 0,59 | −10,54 | 19,18 | −4,08 | 1,8327 | 0,0432 | |||
| AJG / Arthur J. Gallagher & Co. | 0,05 | −13,48 | 18,73 | −11,00 | 1,7898 | −0,0936 | |||
| USB / U.S. Bancorp | 0,42 | −6,77 | 18,38 | −13,35 | 1,7564 | −0,1420 | |||
| APO / Apollo Global Management, Inc. | 0,14 | −6,81 | 18,07 | −18,41 | 1,7274 | −0,2554 | |||
| FCFS / FirstCash Holdings, Inc. | 0,13 | −18,65 | 17,13 | −7,33 | 1,6370 | −0,0174 | |||
| MTB / M&T Bank Corporation | 0,09 | −6,37 | 16,92 | −10,80 | 1,6170 | −0,0809 | |||
| FI / Fiserv, Inc. | 0,10 | 26,06 | 16,46 | −12,93 | 1,5729 | −0,1190 | |||
| NTRS / Northern Trust Corporation | 0,15 | −0,53 | 15,94 | −3,68 | 1,5231 | 0,0422 | |||
| H2X3 / Hiscox Ltd | 0,92 | −4,43 | 15,70 | 8,85 | 1,5007 | 0,2094 | |||
| VOYA / Voya Financial, Inc. | 0,23 | 1,97 | 15,51 | −6,13 | 1,4819 | 0,0033 | |||
| TFC / Truist Financial Corporation | 0,38 | 80,08 | 15,07 | 103,36 | 1,4406 | 0,3795 | |||
| MCO / Moody's Corporation | 0,03 | −7,99 | 14,91 | −12,49 | 1,4247 | −0,1000 | |||
| MKTX / MarketAxess Holdings Inc. | 0,07 | −0,30 | 14,56 | 11,92 | 1,3919 | 0,2271 | |||
| AFG / American Financial Group, Inc. | 0,12 | 2,77 | 14,27 | 0,90 | 1,3638 | 0,0978 | |||
| AIZ / Assurant, Inc. | 0,07 | −3,58 | 13,66 | −5,86 | 1,3056 | 0,0067 | |||
| PYPL / PayPal Holdings, Inc. | 0,19 | 13,52 | 1,2923 | 1,2923 | |||||
| VIRT / Virtu Financial, Inc. | 0,33 | −27,60 | 13,38 | −20,41 | 1,2787 | −0,2260 | |||
| BPOP / Popular, Inc. | 0,13 | −4,48 | 13,24 | −1,53 | 1,2655 | 0,0618 | |||
| TRU / TransUnion | 0,15 | 12,72 | 1,2161 | 1,2161 | |||||
| OMF / OneMain Holdings, Inc. | 0,24 | −17,06 | 12,63 | −19,99 | 1,2069 | −0,2059 | |||
| AUBBF / AUB Group Limited | 0,53 | 11,75 | 1,1233 | 1,1233 | |||||
| UMBF / UMB Financial Corporation | 0,11 | −8,84 | 11,59 | −14,80 | 1,1073 | −0,1099 | |||
| CG / The Carlyle Group Inc. | 0,25 | 27,76 | 11,42 | 15,87 | 1,0916 | 0,2092 | |||
| LNH / Lancashire Holdings Limited | 1,38 | 36,41 | 11,23 | 43,04 | 1,0732 | 0,3705 | |||
| EWBC / East West Bancorp, Inc. | 0,12 | −6,69 | 10,94 | −9,87 | 1,0459 | −0,0411 | |||
| ONB / Old National Bancorp | 0,50 | −8,21 | 10,49 | −19,39 | 1,0028 | −0,1622 | |||
| BWIN / The Baldwin Insurance Group, Inc. | 0,27 | −31,96 | 10,39 | −36,28 | 0,9932 | −0,4666 | |||
| FIBK / First Interstate BancSystem, Inc. | 0,36 | 11,41 | 9,75 | −1,48 | 0,9321 | 0,0461 | |||
| LAZ / Lazard, Inc. | 0,22 | 71,06 | 9,54 | 48,04 | 0,9117 | 0,3349 | |||
| AB / AllianceBernstein Holding L.P. - Limited Partnership | 0,21 | −56,09 | 8,59 | −53,42 | 0,8209 | −0,8295 | |||
| ASB / Associated Banc-Corp | 0,36 | 0,00 | 8,42 | −6,77 | 0,8047 | −0,0036 | |||
| EBC / Eastern Bankshares, Inc. | 0,54 | −6,70 | 8,11 | −21,77 | 0,7748 | −0,1528 | |||
| KEY / KeyCorp | 0,48 | −2,70 | 7,54 | −10,90 | 0,7204 | −0,0369 | |||
| BOKF / BOK Financial Corporation | 0,08 | −4,02 | 7,44 | −16,83 | 0,7111 | −0,0896 | |||
| US21871X1090 / Corebridge Financial, Inc. | 0,23 | −43,93 | 7,35 | −47,28 | 0,7028 | −0,5457 | |||
| FLT / Corpay, Inc. | 0,02 | −1,42 | 6,79 | −12,68 | 0,6494 | −0,0471 | |||
| FNF / Fidelity National Financial, Inc. | 0,12 | −2,62 | 6,52 | −17,35 | 0,6229 | −0,0829 | |||
| BRDG / Bridge Investment Group Holdings Inc. | 0,68 | −1,57 | 6,28 | −13,67 | 0,6001 | −0,0510 | |||
| WSBC / WesBanco, Inc. | 0,19 | −7,69 | 5,99 | −18,99 | 0,5722 | −0,0893 | |||
| FHB / First Hawaiian, Inc. | 0,24 | 0,00 | 5,81 | −11,26 | 0,5553 | −0,0308 | |||
| RJF / Raymond James Financial, Inc. | 0,04 | 0,00 | 5,59 | −4,97 | 0,5338 | 0,0077 | |||
| UCBI / United Community Banks, Inc. | 0,19 | 5,54 | 0,5296 | 0,5296 | |||||
| PAX / Patria Investments Limited | 0,39 | 0,00 | 4,99 | 12,44 | 0,4768 | 0,0797 | |||
| SF / Stifel Financial Corp. | 0,05 | −16,72 | 4,88 | −26,12 | 0,4664 | −0,1248 | |||
| BOLSAA / Bolsa Mexicana de Valores SAB de CV | 2,23 | −0,17 | 4,87 | 22,87 | 0,4653 | 0,1106 | |||
| ZION / Zions Bancorporation, National Association | 0,10 | 0,00 | 4,79 | −12,36 | 0,4576 | −0,0314 | |||
| TCBK / TriCo Bancshares | 0,11 | −0,09 | 4,58 | −8,81 | 0,4381 | −0,0119 | |||
| WTFC / Wintrust Financial Corporation | 0,03 | 0,00 | 3,87 | −4,07 | 0,3698 | 0,0088 | |||
| PWP / Perella Weinberg Partners | 0,21 | 0,00 | 3,69 | −24,85 | 0,3526 | −0,0868 | |||
| CADE / Cadence Bank | 0,12 | 0,00 | 3,53 | −8,63 | 0,3372 | −0,0084 | |||
| US31635A1051 / Fidelity Cash Central Fund | 1,71 | −63,53 | 1,71 | −63,54 | 0,1637 | −0,2567 |