Grunnleggende statistikk
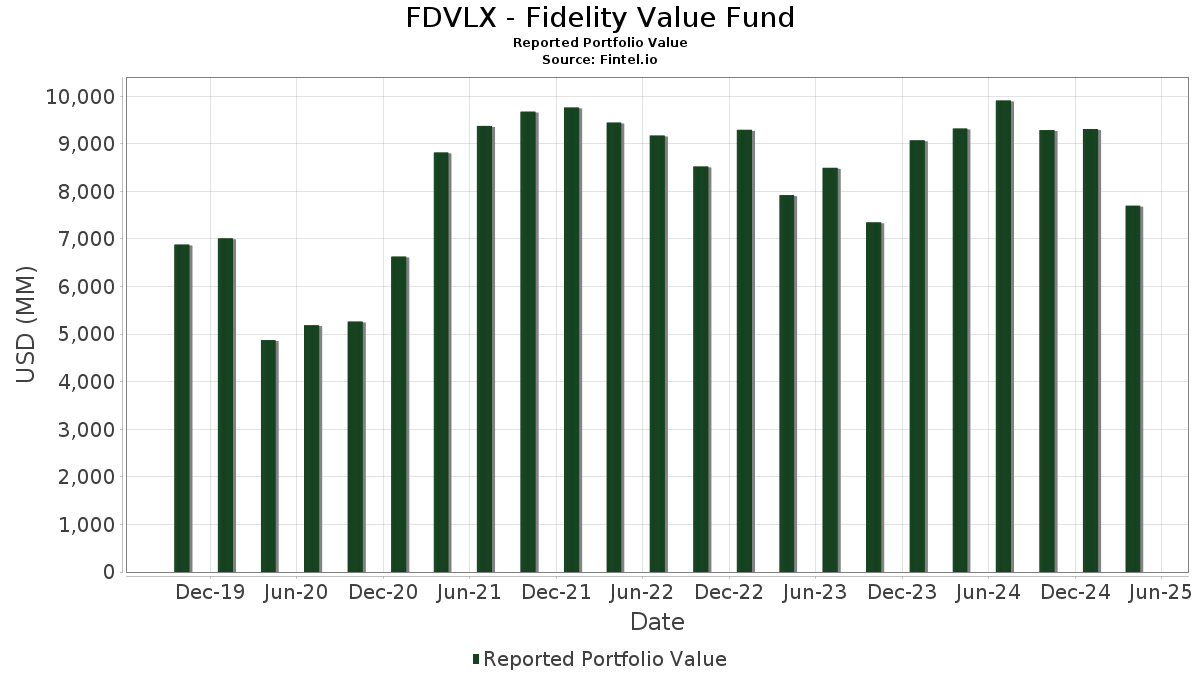
| Porteføljeverdi | $ 7 698 622 995 |
| Nåværende posisjoner | 274 |
Siste beholdninger, prestasjoner, forvaltet kapital (fra 13F, 13D)
FDVLX - Fidelity Value Fund har oppgitt 274 totale beholdninger i sine siste SEC-arkiveringer. Siste porteføljeverdi er beregnet til 7 698 622 995 USD. Faktisk forvaltet kapital (AUM) er denne verdien pluss kontanter (som ikke er oppgitt). FDVLX - Fidelity Value Funds største beholdninger er Fidelity Securities Lending Cash Central Fund (US:US31635A3032) , PG&E Corporation (US:PCG) , Ventas, Inc. (US:VTR) , Eversource Energy (US:ES) , and Cheniere Energy, Inc. (US:LNG) . FDVLX - Fidelity Value Funds nye posisjoner inkluderer Evergy, Inc. (US:EVRG) , Hasbro, Inc. (US:HAS) , James Hardie Industries plc (US:JHX) , Ingevity Corporation (US:NGVT) , and Avnet, Inc. (US:AVT) .
De største økningene dette kvartalet
Vi bruker endringen i porteføljeallokeringen fordi dette er det mest meningsfulle målet. Endringer kan skyldes handler eller endringer i aksjekursene.
| Verdipapirer | Aksjer (MM) |
Verdi (MM$) |
Portefølje % | ΔPortefølje % |
|---|---|---|---|---|
| 194,80 | 194,82 | 2,5934 | 1,3049 | |
| 0,70 | 48,55 | 0,6463 | 0,6463 | |
| 0,73 | 45,45 | 0,6051 | 0,6051 | |
| 0,18 | 33,33 | 0,4436 | 0,3896 | |
| 1,13 | 34,21 | 0,4553 | 0,3454 | |
| 0,43 | 38,08 | 0,5069 | 0,3371 | |
| 0,83 | 49,09 | 0,6534 | 0,3288 | |
| 0,13 | 38,36 | 0,5106 | 0,3237 | |
| 6,29 | 103,95 | 1,3838 | 0,3139 | |
| 0,46 | 62,97 | 0,8383 | 0,3129 |
De største reduksjonene dette kvartalet
Vi bruker endringen i porteføljeallokeringen fordi dette er det mest meningsfulle målet. Endringer kan skyldes handler eller endringer i aksjekurser.
| Verdipapirer | Aksjer (MM) |
Verdi (MM$) |
Portefølje % | ΔPortefølje % |
|---|---|---|---|---|
| 0,10 | 13,35 | 0,1777 | −1,0395 | |
| 0,96 | 18,64 | 0,2481 | −0,6266 | |
| 0,02 | 0,50 | 0,0067 | −0,6017 | |
| 0,07 | 6,83 | 0,0909 | −0,5429 | |
| 0,02 | 1,18 | 0,0157 | −0,5105 | |
| 0,34 | 11,68 | 0,1555 | −0,4886 | |
| 25,19 | 25,19 | 0,3354 | −0,3498 | |
| 0,00 | 0,00 | −0,3077 | ||
| 0,00 | 0,00 | −0,2709 | ||
| 0,54 | 41,39 | 0,5510 | −0,2555 |
13F- og Fondsarkiveringer
Dette skjemaet ble sendt inn den 2025-06-26 for rapporteringsperioden 2025-04-30. Klikk på lenkeikonet for å se hele transaksjonshistorikken.
Oppgradere for å låse opp premiedata og eksportere til Excel![]() .
.
| Verdipapirer | Type | Gjennomsnittlig aksjekurs | Aksjer (MM) |
ΔAksjer (%) |
ΔAksjer (%) |
Verdi ($MM) |
Portefølje (%) |
ΔPortefølje (%) |
|
|---|---|---|---|---|---|---|---|---|---|
| US31635A3032 / Fidelity Securities Lending Cash Central Fund | 194,80 | 64,27 | 194,82 | 64,27 | 2,5934 | 1,3049 | |||
| PCG / PG&E Corporation | 6,29 | 0,00 | 103,95 | 5,56 | 1,3838 | 0,3139 | |||
| VTR / Ventas, Inc. | 1,10 | −0,92 | 76,82 | 14,92 | 1,0226 | 0,2963 | |||
| ES / Eversource Energy | 1,22 | 0,00 | 72,74 | 3,12 | 0,9684 | 0,2019 | |||
| SMURFIT WESTROCK PLC / EC (IE00028FXN24) | 1,55 | 12,02 | 65,22 | −11,34 | 0,8682 | 0,0690 | |||
| LNG / Cheniere Energy, Inc. | 0,28 | −10,45 | 64,17 | −7,46 | 0,8542 | 0,1008 | |||
| MOH / Molina Healthcare, Inc. | 0,19 | −6,83 | 63,17 | −1,85 | 0,8409 | 0,1417 | |||
| APO / Apollo Global Management, Inc. | 0,46 | 63,15 | 62,97 | 30,23 | 0,8383 | 0,3129 | |||
| FQVLF / First Quantum Minerals Ltd. | 4,36 | 1,75 | 58,56 | 9,15 | 0,7796 | 0,1967 | |||
| UGI / UGI Corporation | 1,77 | −9,67 | 58,07 | −3,61 | 0,7731 | 0,1184 | |||
| SUI / Sun Communities, Inc. | 0,46 | −8,94 | 57,54 | −10,43 | 0,7659 | 0,0680 | |||
| SRE / Sempra | 0,76 | 7,83 | 56,37 | −3,43 | 0,7504 | 0,1162 | |||
| TRGP / Targa Resources Corp. | 0,33 | −7,23 | 55,95 | −19,44 | 0,7449 | −0,0097 | |||
| IP / International Paper Company | 1,22 | −2,78 | 55,77 | −20,17 | 0,7423 | −0,0166 | |||
| CH1300646267 / Bunge Global SA | 0,70 | 16,39 | 55,24 | 20,35 | 0,7353 | 0,2366 | |||
| CNC / Centene Corporation | 0,91 | 50,87 | 54,73 | 41,03 | 0,7286 | 0,3069 | |||
| ENR / Siemens Energy AG | 0,69 | −23,59 | 53,16 | −0,88 | 0,7077 | 0,1250 | |||
| PSX / Phillips 66 | 0,51 | 53,29 | 52,80 | 35,33 | 0,7029 | 0,2790 | |||
| RS / Reliance, Inc. | 0,18 | −3,91 | 52,43 | −4,33 | 0,6979 | 0,1025 | |||
| CEG / Constellation Energy Corporation | 0,23 | 44,42 | 52,37 | 7,58 | 0,6972 | 0,1682 | |||
| OMF / OneMain Holdings, Inc. | 1,11 | −2,36 | 52,23 | −17,25 | 0,6952 | 0,0095 | |||
| DLTR / Dollar Tree, Inc. | 0,64 | −14,91 | 52,20 | −5,15 | 0,6949 | 0,0970 | |||
| FSLR / First Solar, Inc. | 0,41 | 26,22 | 51,54 | −5,20 | 0,6860 | 0,0954 | |||
| RGA / Reinsurance Group of America, Incorporated | 0,28 | −9,57 | 51,52 | −25,66 | 0,6858 | −0,0671 | |||
| LNTH / Lantheus Holdings, Inc. | 0,49 | −13,95 | 50,76 | −2,95 | 0,6757 | 0,1074 | |||
| GXO / GXO Logistics, Inc. | 1,39 | 33,11 | 50,43 | 6,13 | 0,6713 | 0,1551 | |||
| CSTM / Constellium SE | 4,98 | 13,03 | 50,37 | 15,08 | 0,6705 | 0,1950 | |||
| SLM / SLM Corporation | 1,73 | 2,97 | 49,91 | 6,66 | 0,6644 | 0,1560 | |||
| AES / The AES Corporation | 4,97 | −5,85 | 49,71 | −14,40 | 0,6617 | 0,0307 | |||
| ALSN / Allison Transmission Holdings, Inc. | 0,54 | −4,10 | 49,63 | −24,74 | 0,6606 | −0,0558 | |||
| CVS / CVS Health Corporation | 0,74 | −19,30 | 49,62 | −4,69 | 0,6605 | 0,0949 | |||
| SGI / Somnigroup International Inc. | 0,81 | 1,35 | 49,42 | −1,99 | 0,6578 | 0,1100 | |||
| SIG / Signet Jewelers Limited | 0,83 | 64,09 | 49,09 | 64,28 | 0,6534 | 0,3288 | |||
| EVRG / Evergy, Inc. | 0,70 | 48,55 | 0,6463 | 0,6463 | |||||
| BLDR / Builders FirstSource, Inc. | 0,40 | 1,13 | 48,13 | −27,68 | 0,6407 | −0,0823 | |||
| ARW / Arrow Electronics, Inc. | 0,42 | −5,60 | 47,33 | −9,80 | 0,6300 | 0,0599 | |||
| FCNCA / First Citizens BancShares, Inc. | 0,03 | −2,22 | 46,96 | −21,09 | 0,6251 | −0,0215 | |||
| GTES / Gates Industrial Corporation plc | 2,48 | 5,04 | 46,84 | −3,94 | 0,6236 | 0,0937 | |||
| ACHC / Acadia Healthcare Company, Inc. | 1,99 | 22,02 | 46,55 | −36,70 | 0,6196 | −0,1794 | |||
| HAS / Hasbro, Inc. | 0,73 | 45,45 | 0,6051 | 0,6051 | |||||
| BPOP / Popular, Inc. | 0,47 | 1,93 | 45,26 | −5,51 | 0,6025 | 0,0821 | |||
| IMP / Imperial Oil Limited | 0,67 | 4,25 | 45,13 | 5,72 | 0,6007 | 0,1370 | |||
| AHR / American Healthcare REIT, Inc. | 1,37 | −14,00 | 44,30 | −1,87 | 0,5898 | 0,0992 | |||
| LAD / Lithia Motors, Inc. | 0,15 | −9,19 | 43,97 | −29,31 | 0,5854 | −0,0905 | |||
| ON / ON Semiconductor Corporation | 1,10 | −8,95 | 43,78 | −30,94 | 0,5828 | −0,1060 | |||
| VK / Vallourec S.A. | 2,36 | −10,97 | 43,50 | −13,80 | 0,5791 | 0,0308 | |||
| FA / First Advantage Corporation | 3,06 | 52,16 | 43,12 | 13,64 | 0,5741 | 0,1617 | |||
| KDP / Keurig Dr Pepper Inc. | 1,25 | −18,16 | 43,11 | −11,81 | 0,5739 | 0,0428 | |||
| DAR / Darling Ingredients Inc. | 1,34 | 1,91 | 43,09 | −12,43 | 0,5736 | 0,0390 | |||
| AMTM / Amentum Holdings, Inc. | 1,96 | 15,89 | 42,86 | 20,58 | 0,5706 | 0,1844 | |||
| TRV / The Travelers Companies, Inc. | 0,16 | −17,19 | 42,76 | −10,79 | 0,5692 | 0,0485 | |||
| CNR / Core Natural Resources, Inc. | 0,59 | 27,27 | 42,59 | 1,73 | 0,5670 | 0,1121 | |||
| HIG / The Hartford Insurance Group, Inc. | 0,35 | −17,10 | 42,41 | −8,83 | 0,5645 | 0,0591 | |||
| WCC / WESCO International, Inc. | 0,26 | −17,14 | 41,67 | −27,01 | 0,5547 | −0,0656 | |||
| HGV / Hilton Grand Vacations Inc. | 1,24 | 4,81 | 41,54 | −14,45 | 0,5530 | 0,0254 | |||
| GO / Grocery Outlet Holding Corp. | 2,47 | 66,60 | 41,50 | 72,78 | 0,5524 | 0,2915 | |||
| OI / O-I Glass, Inc. | 3,27 | −8,15 | 41,43 | −2,61 | 0,5515 | 0,0893 | |||
| GPN / Global Payments Inc. | 0,54 | −17,54 | 41,39 | −44,24 | 0,5510 | −0,2555 | |||
| UPBD / Upbound Group, Inc. | 2,07 | 27,05 | 41,21 | −13,83 | 0,5486 | 0,0290 | |||
| LPLA / LPL Financial Holdings Inc. | 0,13 | −7,08 | 40,71 | −19,01 | 0,5419 | −0,0042 | |||
| CTRI / Centuri Holdings, Inc. | 2,26 | 5,22 | 40,68 | −15,19 | 0,5415 | 0,0204 | |||
| AHCO / AdaptHealth Corp. | 4,77 | 11,18 | 40,60 | −12,55 | 0,5405 | 0,0360 | |||
| CXT / Crane NXT, Co. | 0,86 | 31,78 | 40,57 | −3,34 | 0,5400 | 0,0840 | |||
| CTVA / Corteva, Inc. | 0,65 | −9,26 | 40,21 | −13,82 | 0,5353 | 0,0283 | |||
| BBWI / Bath & Body Works, Inc. | 1,31 | 97,30 | 39,84 | 62,42 | 0,5303 | 0,2333 | |||
| BCO / The Brink's Company | 0,45 | −1,00 | 39,74 | −5,34 | 0,5290 | 0,0729 | |||
| GEO / The GEO Group, Inc. | 1,27 | −8,36 | 39,69 | −9,02 | 0,5284 | 0,0544 | |||
| SCT / SSE plc | 1,76 | 1,22 | 39,64 | 13,28 | 0,5277 | 0,1475 | |||
| AIZ / Assurant, Inc. | 0,21 | −9,60 | 39,58 | −19,03 | 0,5269 | −0,0042 | |||
| DRVN / Driven Brands Holdings Inc. | 2,38 | −18,08 | 39,38 | −18,03 | 0,5242 | 0,0023 | |||
| WLK / Westlake Corporation | 0,42 | 4,85 | 39,00 | −15,19 | 0,5191 | 0,0195 | |||
| US7587501039 / Regal-Beloit Corp. | 0,37 | 14,74 | 38,73 | −23,50 | 0,5156 | −0,0345 | |||
| UFPI / UFP Industries, Inc. | 0,39 | 29,01 | 38,46 | 10,27 | 0,5120 | 0,1330 | |||
| CNH / CNH Industrial N.V. | 3,32 | −15,39 | 38,46 | −24,00 | 0,5119 | −0,0378 | |||
| BGC / BGC Group, Inc. | 4,24 | −16,13 | 38,46 | −20,35 | 0,5119 | −0,0126 | |||
| QDEL / QuidelOrtho Corporation | 1,38 | 49,14 | 38,40 | −4,63 | 0,5112 | 0,0737 | |||
| BLD / TopBuild Corp. | 0,13 | 158,37 | 38,36 | 123,00 | 0,5106 | 0,3237 | |||
| VSTS / Vestis Corporation | 4,38 | 78,51 | 38,35 | 11,86 | 0,5105 | 0,1380 | |||
| STT / State Street Corporation | 0,43 | 181,01 | 38,08 | 143,62 | 0,5069 | 0,3371 | |||
| CLNX / Cellnex Telecom, S.A. | 0,93 | −6,94 | 37,67 | 12,45 | 0,5014 | 0,1375 | |||
| EGP / EastGroup Properties, Inc. | 0,23 | −20,07 | 37,49 | −22,99 | 0,4990 | −0,0299 | |||
| NATL / NCR Atleos Corporation | 1,33 | −8,22 | 37,14 | −19,58 | 0,4944 | −0,0073 | |||
| OSK / Oshkosh Corporation | 0,44 | 3,61 | 37,04 | −25,45 | 0,4931 | −0,0467 | |||
| CNXC / Concentrix Corporation | 0,72 | −12,71 | 36,95 | −14,75 | 0,4918 | 0,0210 | |||
| GIL / Gildan Activewear Inc. | 0,80 | −18,84 | 36,90 | −27,48 | 0,4913 | −0,0616 | |||
| EIX / Edison International | 0,69 | 0,00 | 36,69 | −0,91 | 0,4884 | 0,0861 | |||
| WEX / WEX Inc. | 0,28 | −15,67 | 36,56 | −40,21 | 0,4866 | −0,1777 | |||
| NXST / Nexstar Media Group, Inc. | 0,24 | 6,32 | 36,49 | 3,85 | 0,4857 | 0,1040 | |||
| EWBC / East West Bancorp, Inc. | 0,43 | −13,04 | 36,46 | −27,75 | 0,4853 | −0,0629 | |||
| HRI / Herc Holdings Inc. | 0,33 | 59,17 | 36,39 | −14,60 | 0,4844 | 0,0215 | |||
| UHALB / U-Haul Holding Company - Series N | 0,66 | −4,31 | 36,24 | −19,00 | 0,4824 | −0,0037 | |||
| G / Genpact Limited | 0,72 | −6,44 | 36,08 | −3,42 | 0,4802 | 0,0744 | |||
| MHK / Mohawk Industries, Inc. | 0,34 | −9,77 | 36,03 | −21,54 | 0,4796 | −0,0193 | |||
| R / Ryder System, Inc. | 0,26 | −14,37 | 35,93 | −26,05 | 0,4783 | −0,0496 | |||
| SECYF / SECURE Waste Infrastructure Corp. | 3,77 | −14,52 | 35,87 | −21,23 | 0,4774 | −0,0172 | |||
| INGR / Ingredion Incorporated | 0,27 | 26,21 | 35,76 | 22,86 | 0,4760 | 0,1598 | |||
| RJF / Raymond James Financial, Inc. | 0,26 | −9,90 | 35,69 | −26,71 | 0,4750 | −0,0540 | |||
| KEY / KeyCorp | 2,39 | −8,03 | 35,48 | −24,09 | 0,4723 | −0,0355 | |||
| KBR / KBR, Inc. | 0,67 | −18,58 | 35,34 | −0,93 | 0,4704 | 0,0958 | |||
| OUT / OUTFRONT Media Inc. | 2,34 | 1,21 | 35,34 | −16,77 | 0,4704 | 0,0091 | |||
| ALLY / Ally Financial Inc. | 1,08 | 28,05 | 35,20 | 7,32 | 0,4686 | 0,1122 | |||
| PAG / Penske Automotive Group, Inc. | 0,23 | −16,70 | 35,10 | −21,71 | 0,4673 | −0,0198 | |||
| CNQ / Canadian Natural Resources Limited | 1,22 | −6,51 | 35,08 | −11,69 | 0,4670 | 0,0354 | |||
| GMS / GMS Inc. | 0,47 | 6,40 | 34,72 | −7,58 | 0,4621 | 0,0540 | |||
| COMP / Compass, Inc. | 4,46 | −35,12 | 34,46 | −30,92 | 0,4588 | −0,0833 | |||
| TEX / Terex Corporation | 0,98 | 4,62 | 34,42 | −23,42 | 0,4581 | −0,0301 | |||
| SSNC / SS&C Technologies Holdings, Inc. | 0,45 | −8,18 | 34,35 | −14,25 | 0,4573 | 0,0220 | |||
| MOS / The Mosaic Company | 1,13 | 210,23 | 34,21 | 238,17 | 0,4553 | 0,3454 | |||
| WSC / WillScot Holdings Corporation | 1,36 | 114,33 | 34,16 | 45,28 | 0,4547 | 0,1993 | |||
| TEVA / Teva Pharmaceutical Industries Limited - Depositary Receipt (Common Stock) | 2,17 | 52,55 | 33,61 | 33,45 | 0,4474 | 0,1738 | |||
| PRI / Primerica, Inc. | 0,13 | 0,00 | 33,48 | −9,69 | 0,4456 | 0,0429 | |||
| STZ / Constellation Brands, Inc. | 0,18 | 546,18 | 33,33 | 570,25 | 0,4436 | 0,3896 | |||
| WELL / Welltower Inc. | 0,22 | −33,10 | 33,31 | −25,20 | 0,4434 | −0,0404 | |||
| VTRS / Viatris Inc. | 3,95 | −7,45 | 33,24 | −30,91 | 0,4425 | −0,0802 | |||
| ICLR / ICON Public Limited Company | 0,22 | 127,12 | 33,23 | 72,77 | 0,4423 | 0,2334 | |||
| HNI / HNI Corporation | 0,78 | 4,91 | 33,09 | −10,98 | 0,4405 | 0,0366 | |||
| MEOH / Methanex Corporation | 1,05 | 11,43 | 32,89 | −33,21 | 0,4379 | −0,0972 | |||
| SYENS / Syensqo SA/NV | 0,46 | −11,80 | 32,89 | −21,16 | 0,4378 | −0,0154 | |||
| ET / Energy Transfer LP - Limited Partnership | 1,97 | −8,27 | 32,57 | −25,92 | 0,4336 | −0,0441 | |||
| PFSI / PennyMac Financial Services, Inc. | 0,33 | −24,35 | 32,54 | −29,59 | 0,4332 | −0,0689 | |||
| CVE / Cenovus Energy Inc. | 2,76 | −11,30 | 32,48 | −27,80 | 0,4324 | −0,0564 | |||
| JAZZ / Jazz Pharmaceuticals plc | 0,27 | 10,14 | 32,15 | 3,58 | 0,4280 | 0,0907 | |||
| MBC / MasterBrand, Inc. | 2,63 | 226,32 | 31,95 | 128,92 | 0,4253 | 0,2737 | |||
| TGLS / Tecnoglass Inc. | 0,44 | −6,93 | 31,22 | −12,72 | 0,4156 | 0,0270 | |||
| GLPEY / Galp Energia, SGPS, S.A. - Depositary Receipt (Common Stock) | 2,01 | −6,84 | 31,11 | −13,76 | 0,4141 | 0,0222 | |||
| CPRI / Capri Holdings Limited | 2,04 | 67,12 | 30,73 | 1,43 | 0,4091 | 0,0799 | |||
| BTSG / BrightSpring Health Services, Inc. | 1,74 | −4,52 | 30,42 | −29,08 | 0,4049 | −0,0611 | |||
| FDX / FedEx Corporation | 0,14 | −6,47 | 30,41 | −25,73 | 0,4049 | −0,0400 | |||
| IFSPF / Interfor Corporation | 3,15 | −7,97 | 30,34 | −24,21 | 0,4039 | −0,0310 | |||
| STC / Stewart Information Services Corporation | 0,46 | 28,40 | 29,96 | 28,97 | 0,3989 | 0,1464 | |||
| ACI / Albertsons Companies, Inc. | 1,34 | −43,77 | 29,38 | −38,36 | 0,3911 | −0,1267 | |||
| PVH / PVH Corp. | 0,42 | −23,86 | 28,74 | −41,39 | 0,3826 | −0,1502 | |||
| WBS / Webster Financial Corporation | 0,61 | 170,35 | 28,68 | 112,29 | 0,3818 | 0,2350 | |||
| MGRC / McGrath RentCorp | 0,27 | 0,41 | 28,67 | −12,69 | 0,3817 | 0,0249 | |||
| GAP / The Gap, Inc. | 1,30 | 16,15 | 28,51 | 5,67 | 0,3796 | 0,0864 | |||
| PUK / Prudential plc - Depositary Receipt (Common Stock) | 2,65 | 6,53 | 28,14 | 36,11 | 0,3746 | 0,1500 | |||
| JBL / Jabil Inc. | 0,19 | 2,18 | 27,49 | −7,79 | 0,3660 | 0,0420 | |||
| PM / Philip Morris International Inc. | 0,16 | −40,61 | 27,49 | −21,84 | 0,3659 | −0,0162 | |||
| VOYA / Voya Financial, Inc. | 0,46 | 25,99 | 27,46 | 5,07 | 0,3656 | 0,0816 | |||
| NCR / NCR Corp. | 3,19 | 0,64 | 27,34 | −29,83 | 0,3639 | −0,0593 | |||
| KGS / Kodiak Gas Services, Inc. | 0,80 | −23,88 | 27,23 | −44,66 | 0,3625 | −0,1721 | |||
| BC / Brunswick Corporation | 0,58 | 70,28 | 26,68 | −1,66 | 0,3551 | 0,0581 | |||
| PLD / Prologis, Inc. | 0,26 | 5,16 | 26,64 | −9,87 | 0,3547 | 0,0335 | |||
| NFI / NFI Group Inc. | 3,11 | −4,52 | 26,14 | −2,87 | 0,3479 | 0,0556 | |||
| UBSG / UBS Group AG | 0,87 | −14,16 | 26,11 | −27,10 | 0,3476 | −0,0416 | |||
| AMP / Ameriprise Financial, Inc. | 0,05 | −7,01 | 25,62 | −19,39 | 0,3411 | −0,0043 | |||
| CC / The Chemours Company | 2,05 | −6,60 | 25,38 | −39,11 | 0,3379 | −0,1150 | |||
| TEN / Tenaris S.A. | 1,52 | −7,05 | 25,29 | −17,99 | 0,3367 | 0,0016 | |||
| US31635A1051 / Fidelity Cash Central Fund | 25,19 | −60,05 | 25,19 | −60,05 | 0,3354 | −0,3498 | |||
| DOOO / BRP Inc. | 0,74 | 8,34 | 25,09 | −23,26 | 0,3339 | −0,0212 | |||
| WDC / Western Digital Corporation | 0,57 | 19,72 | 24,90 | −19,38 | 0,3315 | −0,0041 | |||
| SOLV / Solventum Corporation | 0,38 | 13,79 | 24,89 | 1,59 | 0,3313 | 0,0651 | |||
| XPO / XPO, Inc. | 0,23 | −6,97 | 24,66 | −26,14 | 0,3283 | −0,0345 | |||
| 1SO / Samsonite Group S.A. | 13,57 | −7,84 | 24,39 | −42,89 | 0,3247 | −0,1393 | |||
| TKR / The Timken Company | 0,37 | −37,57 | 24,09 | −50,03 | 0,3206 | −0,2031 | |||
| LEN / Lennar Corporation | 0,22 | 55,78 | 23,99 | 28,92 | 0,3194 | 0,1172 | |||
| TFII / TFI International Inc. | 0,29 | 26,23 | 23,87 | −22,14 | 0,3177 | −0,0153 | |||
| MLKN / MillerKnoll, Inc. | 1,44 | 6,21 | 23,63 | −22,38 | 0,3146 | −0,0162 | |||
| PCAR / PACCAR Inc | 0,25 | −4,52 | 22,87 | −22,32 | 0,3044 | −0,0154 | |||
| PATK / Patrick Industries, Inc. | 0,30 | 2 046,08 | 22,80 | 1 601,34 | 0,3035 | 0,2889 | |||
| HII / Huntington Ingalls Industries, Inc. | 0,10 | 156,36 | 22,73 | 199,37 | 0,3026 | 0,2201 | |||
| ASGN / ASGN Incorporated | 0,44 | 31,28 | 22,08 | −25,02 | 0,2939 | −0,0260 | |||
| GTM / ZoomInfo Technologies Inc. | 2,57 | −43,90 | 21,98 | −53,33 | 0,2926 | −0,2191 | |||
| PRMB / Primo Brands Corporation | 0,66 | −28,21 | 21,68 | −27,54 | 0,2886 | −0,0365 | |||
| XPRO / Expro Group Holdings N.V. | 2,62 | −6,65 | 21,64 | −38,87 | 0,2881 | −0,0966 | |||
| PRG / PROG Holdings, Inc. | 0,82 | 30,38 | 21,58 | −19,61 | 0,2872 | −0,0044 | |||
| MLM / Martin Marietta Materials, Inc. | 0,04 | −7,42 | 21,56 | −10,85 | 0,2870 | 0,0243 | |||
| THRY / Thryv Holdings, Inc. | 1,55 | −7,02 | 21,27 | −27,25 | 0,2831 | −0,0345 | |||
| AYI / Acuity Inc. | 0,09 | −4,49 | 21,27 | −30,00 | 0,2831 | −0,0470 | |||
| LAMR / Lamar Advertising Company | 0,18 | 19,43 | 21,05 | 7,52 | 0,2803 | 0,0675 | |||
| JHX / James Hardie Industries plc | 0,88 | 20,96 | 0,2790 | 0,2790 | |||||
| ELAN / Elanco Animal Health Incorporated | 2,21 | 1 084,17 | 20,93 | 833,32 | 0,2786 | 0,2542 | |||
| SOBO / South Bow Corporation | 0,85 | −4,52 | 20,90 | −1,46 | 0,2783 | 0,0478 | |||
| JLL / Jones Lang LaSalle Incorporated | 0,09 | 20,42 | 0,2718 | 0,2718 | |||||
| ATS / ATS Corporation | 0,81 | −4,52 | 20,42 | −11,05 | 0,2718 | 0,0224 | |||
| GLPG / Galapagos NV | 0,75 | −4,53 | 20,18 | 12,35 | 0,2687 | 0,0735 | |||
| ECN / ECN Capital Corp. | 9,97 | 0,00 | 20,17 | −6,62 | 0,2685 | 0,0338 | |||
| STLD / Steel Dynamics, Inc. | 0,16 | −13,62 | 20,15 | −12,61 | 0,2683 | 0,0177 | |||
| IRM / Iron Mountain Incorporated | 0,22 | −6,51 | 20,10 | −18,25 | 0,2676 | 0,0174 | |||
| NGVT / Ingevity Corporation | 0,61 | 20,05 | 0,2669 | 0,2669 | |||||
| DK / Delek US Holdings, Inc. | 1,45 | 6,95 | 18,86 | −22,03 | 0,2511 | −0,0117 | |||
| LDOS / Leidos Holdings, Inc. | 0,13 | −24,81 | 18,78 | 0,18 | 0,2500 | 0,0383 | |||
| COLD / Americold Realty Trust, Inc. | 0,96 | −53,66 | 18,64 | −76,93 | 0,2481 | −0,6266 | |||
| BNTX / BioNTech SE - Depositary Receipt (Common Stock) | 0,17 | 9,53 | 18,20 | −7,83 | 0,2422 | 0,0277 | |||
| MRNA / Moderna, Inc. | 0,64 | 24,67 | 18,17 | −9,74 | 0,2419 | 0,0232 | |||
| AVT / Avnet, Inc. | 0,38 | 18,08 | 0,2407 | 0,2407 | |||||
| OLN / Olin Corporation | 0,83 | −4,52 | 17,96 | −29,52 | 0,2390 | −0,0378 | |||
| FANG / Diamondback Energy, Inc. | 0,14 | −8,69 | 17,89 | −26,66 | 0,2381 | −0,0269 | |||
| RRC / Range Resources Corporation | 0,52 | −8,71 | 17,68 | −16,37 | 0,2353 | 0,0057 | |||
| FTRE / Fortrea Holdings Inc. | 2,83 | 28,38 | 17,61 | −52,42 | 0,2345 | −0,1677 | |||
| PACS / PACS Group, Inc. | 1,80 | 93,85 | 17,35 | 28,47 | 0,2310 | 0,0842 | |||
| GSK / GSK plc - Depositary Receipt (Common Stock) | 0,43 | 17,33 | 0,2307 | 0,2307 | |||||
| TV / Grupo Televisa, S.A.B. - Depositary Receipt (Common Stock) | 9,39 | −4,52 | 17,08 | −9,50 | 0,2274 | 0,0223 | |||
| FLR / Fluor Corporation | 0,48 | −4,52 | 16,73 | −30,90 | 0,2228 | −0,0404 | |||
| ONEXF / Onex Corporation | 0,23 | −4,53 | 16,58 | −11,86 | 0,2207 | 0,0163 | |||
| MTX / Minerals Technologies Inc. | 0,32 | −6,12 | 16,55 | −36,84 | 0,2203 | −0,0644 | |||
| ASO / Academy Sports and Outdoors, Inc. | 0,42 | −2,81 | 15,78 | −29,99 | 0,2100 | −0,0348 | |||
| NOMD / Nomad Foods Limited | 0,77 | 0,00 | 15,34 | 11,93 | 0,2042 | 0,0553 | |||
| SATS / EchoStar Corporation | 0,66 | 14,76 | 0,1964 | 0,1964 | |||||
| TGC / TGS ASA | 1,97 | 8,36 | 14,56 | −20,70 | 0,1938 | −0,0057 | |||
| NWL / Newell Brands Inc. | 3,02 | 19,36 | 14,45 | −42,72 | 0,1923 | −0,0817 | |||
| VST / Vistra Corp. | 0,10 | −88,42 | 13,35 | −87,99 | 0,1777 | −1,0395 | |||
| XGGB / Gerdau S.A. - Preferred Stock | 5,03 | 0,00 | 13,28 | −10,36 | 0,1768 | 0,0158 | |||
| A / Agilent Technologies, Inc. | 0,12 | −17,66 | 13,22 | −41,53 | 0,1760 | −0,0697 | |||
| GPK / Graphic Packaging Holding Company | 0,50 | −61,29 | 12,61 | −67,45 | 0,1679 | −0,2263 | |||
| PHLLF / Petershill Partners plc | 4,31 | −13,70 | 12,45 | −27,37 | 0,1657 | −0,0205 | |||
| AR / Antero Resources Corporation | 0,34 | −78,89 | 11,68 | −80,30 | 0,1555 | −0,4886 | |||
| LPX / Louisiana-Pacific Corporation | 0,13 | −13,62 | 11,39 | −36,26 | 0,1516 | −0,0425 | |||
| AMBC / Ambac Financial Group, Inc. | 1,42 | −4,71 | 11,36 | −34,62 | 0,1512 | −0,0375 | |||
| GCC / GCC, S.A.B. de C.V. | 1,32 | 0,00 | 11,11 | −9,76 | 0,1479 | 0,0141 | |||
| IQV / IQVIA Holdings Inc. | 0,07 | −17,66 | 11,08 | −36,59 | 0,1475 | −0,0424 | |||
| SQ / Block, Inc. | 0,19 | 10,87 | 0,1447 | 0,1447 | |||||
| MMS / Maximus, Inc. | 0,16 | 68,30 | 10,84 | 49,68 | 0,1443 | 0,0656 | |||
| ASTL / Algoma Steel Group Inc. | 2,07 | −4,52 | 10,59 | −40,15 | 0,1410 | −0,0513 | |||
| REXR / Rexford Industrial Realty, Inc. | 0,30 | 10,03 | 0,1335 | 0,1335 | |||||
| GEHC / GE HealthCare Technologies Inc. | 0,14 | −22,85 | 9,92 | −38,56 | 0,1320 | −0,0433 | |||
| JCDXF / JCDecaux SE | 0,57 | 9,81 | 0,1305 | 0,1305 | |||||
| HUM / Humana Inc. | 0,04 | −14,89 | 9,69 | −23,89 | 0,1290 | −0,0093 | |||
| EHC / Encompass Health Corporation | 0,08 | −14,66 | 9,65 | 0,57 | 0,1285 | 0,0242 | |||
| SNX / TD SYNNEX Corporation | 0,09 | 9,50 | 0,1264 | 0,1264 | |||||
| MEGEF / MEG Energy Corp. | 0,67 | −9,95 | 9,46 | −22,96 | 0,1259 | −0,0075 | |||
| COR / Cencora, Inc. | 0,03 | −47,21 | 9,04 | −39,22 | 0,1204 | −0,0413 | |||
| FCNCB / First Citizens BancShares, Inc. | 0,01 | 0,00 | 8,82 | −11,97 | 0,1174 | 0,0086 | |||
| LILAB / Liberty Latin America Ltd. | 1,60 | 0,00 | 8,78 | −10,29 | 0,1168 | 0,0106 | |||
| RPM / RPM International Inc. | 0,08 | 8,67 | 0,1154 | 0,1154 | |||||
| FWRD / Forward Air Corporation | 0,59 | 8,65 | 0,1152 | 0,1152 | |||||
| COO / The Cooper Companies, Inc. | 0,10 | −15,97 | 8,54 | −28,92 | 0,1136 | −0,0168 | |||
| STE / STERIS plc | 0,04 | −22,48 | 8,30 | −21,06 | 0,1105 | −0,0037 | |||
| LBRT / Liberty Energy Inc. | 0,70 | −8,72 | 8,09 | −42,67 | 0,1077 | −0,0456 | |||
| YETI / YETI Holdings, Inc. | 0,28 | 7,99 | 0,1064 | 0,1064 | |||||
| WAL / Western Alliance Bancorporation | 0,11 | 7,51 | 0,1000 | 0,1000 | |||||
| ZBH / Zimmer Biomet Holdings, Inc. | 0,07 | −87,57 | 6,83 | −88,30 | 0,0909 | −0,5429 | |||
| APD / Air Products and Chemicals, Inc. | 0,02 | −13,68 | 6,67 | −30,21 | 0,0888 | −0,0150 | |||
| SNDK.V / Sandisk Corporation | 0,19 | 6,19 | 0,0824 | 0,0824 | |||||
| MASI / Masimo Corporation | 0,03 | −8,87 | 5,62 | −15,81 | 0,0749 | 0,0023 | |||
| EXAS / Exact Sciences Corporation | 0,12 | −17,66 | 5,39 | −32,95 | 0,0718 | −0,0156 | |||
| AVNT / Avient Corporation | 0,16 | −13,64 | 5,19 | −32,95 | 0,0691 | −0,0150 | |||
| KOS / Kosmos Energy Ltd. | 3,37 | −7,34 | 5,19 | −55,13 | 0,0691 | −0,0566 | |||
| THC / Tenet Healthcare Corporation | 0,04 | −17,66 | 5,14 | −16,46 | 0,0684 | 0,0016 | |||
| ALGN / Align Technology, Inc. | 0,03 | −17,66 | 4,70 | −34,88 | 0,0626 | −0,0158 | |||
| BAX / Baxter International Inc. | 0,15 | −21,66 | 4,70 | −25,00 | 0,0625 | −0,0055 | |||
| AVTR / Avantor, Inc. | 0,36 | −17,66 | 4,62 | −52,00 | 0,0615 | −0,0431 | |||
| CHE / Chemed Corporation | 0,01 | −59,04 | 4,55 | −57,62 | 0,0605 | −0,0560 | |||
| LH / Labcorp Holdings Inc. | 0,02 | 11,95 | 4,10 | 8,03 | 0,0546 | 0,0133 | |||
| HOLX / Hologic, Inc. | 0,07 | −17,66 | 3,96 | −33,57 | 0,0528 | −0,0121 | |||
| RPRX / Royalty Pharma plc | 0,12 | −27,09 | 3,91 | −24,23 | 0,0520 | −0,0040 | |||
| WST / West Pharmaceutical Services, Inc. | 0,02 | −17,66 | 3,63 | −49,06 | 0,0484 | −0,0291 | |||
| PKI / Revvity Inc. | 0,04 | −15,90 | 3,58 | −37,70 | 0,0476 | −0,0148 | |||
| TFX / Teleflex Incorporated | 0,03 | −83,34 | 3,51 | −87,34 | 0,0467 | −0,2545 | |||
| WFRD / Weatherford International plc | 0,08 | −8,78 | 3,48 | −40,01 | 0,0464 | −0,0167 | |||
| UST BILLS 0% 06/12/2025 / DBT (US912797LN52) | 3,43 | 0,0457 | 0,0457 | ||||||
| DGX / Quest Diagnostics Incorporated | 0,02 | −78,30 | 2,76 | −72,01 | 0,0368 | −0,0709 | |||
| UTHR / United Therapeutics Corporation | 0,01 | −33,46 | 2,76 | −13,92 | 0,0367 | 0,0018 | |||
| EAF / GrafTech International Ltd. | 4,30 | 0,00 | 2,72 | −57,80 | 0,0362 | −0,0338 | |||
| RMD / ResMed Inc. | 0,01 | 2,38 | 0,0316 | 0,0316 | |||||
| GMED / Globus Medical, Inc. | 0,03 | 19,00 | 2,14 | −7,91 | 0,0285 | 0,0033 | |||
| MTD / Mettler-Toledo International Inc. | 0,00 | −31,45 | 2,13 | −46,21 | 0,0283 | −0,0147 | |||
| UST BILLS 0% 07/10/2025 / DBT (US912797LW51) | 2,07 | 0,0276 | 0,0276 | ||||||
| ALNY / Alnylam Pharmaceuticals, Inc. | 0,01 | −18,88 | 1,74 | −21,31 | 0,0232 | −0,0009 | |||
| ROIV / Roivant Sciences Ltd. | 0,15 | −17,66 | 1,70 | −14,04 | 0,0226 | 0,0011 | |||
| ILMN / Illumina, Inc. | 0,02 | −17,66 | 1,59 | −51,87 | 0,0212 | −0,0147 | |||
| LEGN / Legend Biotech Corporation - Depositary Receipt (Common Stock) | 0,04 | −17,66 | 1,38 | −24,45 | 0,0184 | −0,0015 | |||
| HSIC / Henry Schein, Inc. | 0,02 | −97,01 | 1,18 | −97,57 | 0,0157 | −0,5105 | |||
| BMRN / BioMarin Pharmaceutical Inc. | 0,02 | −17,66 | 1,11 | −17,27 | 0,0148 | 0,0002 | |||
| TROX / Tronox Holdings plc | 0,20 | −87,88 | 1,07 | −93,62 | 0,0143 | −0,1683 | |||
| WAY / Waystar Holding Corp. | 0,03 | 0,94 | 0,0125 | 0,0125 | |||||
| BIO / Bio-Rad Laboratories, Inc. | 0,00 | −17,65 | 0,86 | −44,29 | 0,0115 | −0,0054 | |||
| S and P MID 400 EMINI FUT JUN25 FAM5 / DE (N/A) | 0,74 | 0,0099 | 0,0099 | ||||||
| CRL / Charles River Laboratories International, Inc. | 0,01 | −17,65 | 0,64 | −40,75 | 0,0086 | −0,0032 | |||
| SGRY / Surgery Partners, Inc. | 0,02 | 0,52 | 0,0069 | 0,0069 | |||||
| PRGO / Perrigo Company plc | 0,02 | −99,13 | 0,50 | −99,10 | 0,0067 | −0,6017 | |||
| BRKR / Bruker Corporation | 0,01 | −17,65 | 0,45 | −43,29 | 0,0060 | −0,0026 | |||
| NVST / Envista Holdings Corporation | 0,03 | −17,66 | 0,44 | −35,49 | 0,0058 | −0,0015 | |||
| P1UK34 / Prudential plc - Depositary Receipt (Common Stock) | 2,37 | 0,40 | 0,0053 | 0,0053 | |||||
| PFGC / Performance Food Group Company | 0,00 | −100,00 | 0,00 | −100,00 | −0,1409 | ||||
| BCC / Boise Cascade Company | 0,00 | −100,00 | 0,00 | −100,00 | −0,3077 | ||||
| RDUS / Radius Recycling, Inc. | 0,00 | −100,00 | 0,00 | −100,00 | −0,1124 | ||||
| PCRX / Pacira BioSciences, Inc. | 0,00 | −100,00 | 0,00 | −100,00 | −0,0179 | ||||
| RKT / Rocket Companies, Inc. | 0,00 | −100,00 | 0,00 | −100,00 | −0,0652 | ||||
| WOR / Worthington Enterprises, Inc. | 0,00 | −100,00 | 0,00 | −100,00 | −0,1376 | ||||
| ATMU / Atmus Filtration Technologies Inc. | 0,00 | −100,00 | 0,00 | −100,00 | −0,2709 |