Grunnleggende statistikk
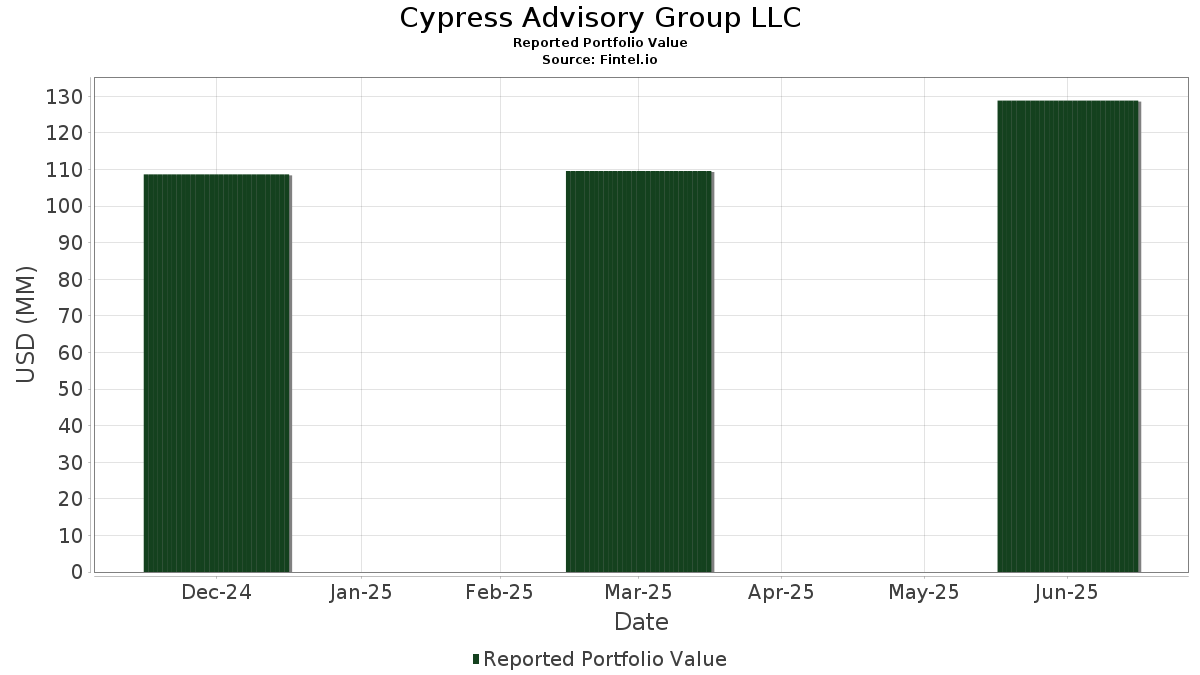
| Porteføljeverdi | $ 128 853 367 |
| Nåværende posisjoner | 67 |
Siste beholdninger, prestasjoner, forvaltet kapital (fra 13F, 13D)
Cypress Advisory Group LLC har oppgitt 67 totale beholdninger i sine siste SEC-arkiveringer. Siste porteføljeverdi er beregnet til 128 853 367 USD. Faktisk forvaltet kapital (AUM) er denne verdien pluss kontanter (som ikke er oppgitt). Cypress Advisory Group LLCs største beholdninger er iShares Trust - iShares Short Treasury Bond ETF (US:SHV) , Microsoft Corporation (US:MSFT) , SPDR Series Trust - SPDR Bloomberg 1-3 Month T-Bill ETF (US:BIL) , Berkshire Hathaway Inc. (US:BRK.A) , and The TJX Companies, Inc. (US:TJX) . Cypress Advisory Group LLCs nye posisjoner inkluderer SPDR Series Trust - SPDR Bloomberg 1-3 Month T-Bill ETF (US:BIL) , Mettler-Toledo International Inc. (US:MTD) , Carlisle Companies Incorporated (US:CSL) , TE Connectivity plc (US:TEL) , and IDEX Corporation (US:IEX) .
De største økningene dette kvartalet
Vi bruker endringen i porteføljeallokeringen fordi dette er det mest meningsfulle målet. Endringer kan skyldes handler eller endringer i aksjekursene.
| Verdipapirer | Aksjer (MM) |
Verdi (MM$) |
Portefølje % | ΔPortefølje % |
|---|---|---|---|---|
| 0,08 | 7,56 | 5,8699 | 5,8699 | |
| 0,00 | 0,95 | 0,7375 | 0,7375 | |
| 0,02 | 1,71 | 1,3243 | 0,6864 | |
| 0,02 | 7,87 | 6,1062 | 0,6314 | |
| 0,00 | 1,20 | 0,9322 | 0,6234 | |
| 0,00 | 0,76 | 0,5932 | 0,5932 | |
| 0,00 | 0,75 | 0,5819 | 0,5819 | |
| 0,00 | 0,72 | 0,5570 | 0,5570 | |
| 0,01 | 2,14 | 1,6591 | 0,4955 | |
| 0,00 | 0,76 | 0,5860 | 0,3977 |
De største reduksjonene dette kvartalet
Vi bruker endringen i porteføljeallokeringen fordi dette er det mest meningsfulle målet. Endringer kan skyldes handler eller endringer i aksjekurser.
| Verdipapirer | Aksjer (MM) |
Verdi (MM$) |
Portefølje % | ΔPortefølje % |
|---|---|---|---|---|
| 0,21 | 23,25 | 18,0414 | −4,7709 | |
| 0,01 | 5,64 | 4,3739 | −1,2758 | |
| 0,00 | 0,93 | 0,7200 | −0,8970 | |
| 0,03 | 4,27 | 3,3171 | −0,6209 | |
| 0,01 | 2,85 | 2,2146 | −0,6096 | |
| 0,00 | 1,63 | 1,2665 | −0,4918 | |
| 0,03 | 3,46 | 2,6835 | −0,4806 | |
| 0,01 | 3,10 | 2,4028 | −0,4462 | |
| 0,00 | 0,00 | −0,3831 | ||
| 0,01 | 3,03 | 2,3532 | −0,3824 |
13F- og Fondsarkiveringer
Dette skjemaet ble sendt inn den 2025-08-11 for rapporteringsperioden 2025-06-30. Klikk på lenkeikonet for å se hele transaksjonshistorikken.
Oppgradere for å låse opp premiedata og eksportere til Excel![]() .
.
| Verdipapirer | Type | Gjennomsnittlig aksjekurs | Aksjer (MM) |
ΔAksjer (%) |
ΔAksjer (%) |
Verdi ($MM) |
Portefølje (%) |
ΔPortefølje (%) |
|
|---|---|---|---|---|---|---|---|---|---|
| SHV / iShares Trust - iShares Short Treasury Bond ETF | 0,21 | −6,99 | 23,25 | −7,03 | 18,0414 | −4,7709 | |||
| MSFT / Microsoft Corporation | 0,02 | −1,04 | 7,87 | 31,13 | 6,1062 | 0,6314 | |||
| BIL / SPDR Series Trust - SPDR Bloomberg 1-3 Month T-Bill ETF | 0,08 | 7,56 | 5,8699 | 5,8699 | |||||
| BRK.A / Berkshire Hathaway Inc. | 0,01 | −0,22 | 5,64 | −9,00 | 4,3739 | −1,2758 | |||
| TJX / The TJX Companies, Inc. | 0,03 | −2,33 | 4,27 | −0,97 | 3,3171 | −0,6209 | |||
| ROST / Ross Stores, Inc. | 0,03 | −0,13 | 3,46 | −0,29 | 2,6835 | −0,4806 | |||
| ALLE / Allegion plc | 0,02 | 22,83 | 3,17 | 35,69 | 2,4581 | 0,3284 | |||
| V / Visa Inc. | 0,01 | −2,13 | 3,10 | −0,83 | 2,4028 | −0,4462 | |||
| LMT / Lockheed Martin Corporation | 0,01 | −2,46 | 3,03 | 1,13 | 2,3532 | −0,3824 | |||
| ACN / Accenture plc | 0,01 | 38,30 | 3,01 | 32,48 | 2,3335 | 0,2627 | |||
| AAPL / Apple Inc. | 0,01 | −0,20 | 2,85 | −7,82 | 2,2146 | −0,6096 | |||
| CMI / Cummins Inc. | 0,01 | −0,80 | 2,85 | 3,68 | 2,2112 | −0,2968 | |||
| HSY / The Hershey Company | 0,02 | 2,26 | 2,51 | −0,75 | 1,9441 | −0,3593 | |||
| XPRO / Expro Group Holdings N.V. | 0,01 | 25,64 | 2,34 | −1,89 | 1,8130 | −0,3599 | |||
| ROK / Rockwell Automation, Inc. | 0,01 | 30,39 | 2,14 | 67,61 | 1,6591 | 0,4955 | |||
| AME / AMETEK, Inc. | 0,01 | 39,82 | 2,06 | 47,00 | 1,5954 | 0,3193 | |||
| SHY / iShares Trust - iShares 1-3 Year Treasury Bond ETF | 0,02 | 0,00 | 1,94 | 0,16 | 1,5035 | −0,2613 | |||
| CSCO / Cisco Systems, Inc. | 0,03 | −1,26 | 1,84 | 11,02 | 1,4312 | −0,0845 | |||
| WRB / W. R. Berkley Corporation | 0,02 | 0,00 | 1,83 | 3,27 | 1,4203 | −0,1969 | |||
| GOOG / Alphabet Inc. | 0,01 | −0,29 | 1,82 | 13,64 | 1,4101 | −0,0488 | |||
| SAP / SAP SE - Depositary Receipt (Common Stock) | 0,01 | 0,00 | 1,74 | 13,30 | 1,3495 | −0,0510 | |||
| APH / Amphenol Corporation | 0,02 | 62,10 | 1,71 | 144,06 | 1,3243 | 0,6864 | |||
| CI / The Cigna Group | 0,01 | −0,19 | 1,70 | 0,29 | 1,3205 | −0,2275 | |||
| CHKP / Check Point Software Technologies Ltd. | 0,01 | −0,20 | 1,70 | −3,09 | 1,3165 | −0,2810 | |||
| NOC / Northrop Grumman Corporation | 0,00 | −13,28 | 1,63 | −15,36 | 1,2665 | −0,4918 | |||
| MA / Mastercard Incorporated | 0,00 | 27,41 | 1,56 | 30,68 | 1,2102 | 0,1210 | |||
| AMZN / Amazon.com, Inc. | 0,01 | −2,31 | 1,48 | 12,61 | 1,1505 | −0,0502 | |||
| MSI / Motorola Solutions, Inc. | 0,00 | 0,00 | 1,42 | −3,93 | 1,1013 | −0,2468 | |||
| ELV / Elevance Health, Inc. | 0,00 | −0,80 | 1,36 | −11,25 | 1,0532 | −0,3425 | |||
| ADBE / Adobe Inc. | 0,00 | 85,79 | 1,32 | 87,59 | 1,0208 | 0,3805 | |||
| A / Agilent Technologies, Inc. | 0,01 | 63,21 | 1,27 | 64,77 | 0,9873 | 0,2823 | |||
| ULTA / Ulta Beauty, Inc. | 0,00 | −7,75 | 1,23 | 17,79 | 0,9509 | 0,0014 | |||
| NDSN / Nordson Corporation | 0,01 | 89,29 | 1,22 | 101,32 | 0,9470 | 0,3935 | |||
| WST / West Pharmaceutical Services, Inc. | 0,01 | 58,57 | 1,21 | 55,00 | 0,9383 | 0,2265 | |||
| FIX / Comfort Systems USA, Inc. | 0,00 | 113,33 | 1,20 | 255,33 | 0,9322 | 0,6234 | |||
| NKE / NIKE, Inc. | 0,02 | 22,47 | 1,16 | 37,07 | 0,9016 | 0,1282 | |||
| PH / Parker-Hannifin Corporation | 0,00 | 0,00 | 1,12 | 14,93 | 0,8727 | −0,0202 | |||
| DHR / Danaher Corporation | 0,01 | 83,81 | 1,09 | 77,32 | 0,8440 | 0,2838 | |||
| AOS / A. O. Smith Corporation | 0,02 | 53,27 | 1,08 | 53,79 | 0,8346 | 0,1965 | |||
| MTD / Mettler-Toledo International Inc. | 0,00 | 0,95 | 0,7375 | 0,7375 | |||||
| GD / General Dynamics Corporation | 0,00 | −1,41 | 0,94 | 5,53 | 0,7259 | −0,0831 | |||
| UNH / UnitedHealth Group Incorporated | 0,00 | −12,12 | 0,93 | −47,69 | 0,7200 | −0,8970 | |||
| WAT / Waters Corporation | 0,00 | −0,38 | 0,92 | −5,63 | 0,7157 | −0,1761 | |||
| COST / Costco Wholesale Corporation | 0,00 | 0,00 | 0,88 | 4,66 | 0,6799 | −0,0837 | |||
| WMT / Walmart Inc. | 0,01 | −0,56 | 0,88 | 10,76 | 0,6792 | −0,0417 | |||
| TMO / Thermo Fisher Scientific Inc. | 0,00 | 209,26 | 0,80 | 152,53 | 0,6199 | 0,3307 | |||
| JNJ / Johnson & Johnson | 0,01 | −3,54 | 0,78 | −11,09 | 0,6038 | −0,1950 | |||
| CSL / Carlisle Companies Incorporated | 0,00 | 0,76 | 0,5932 | 0,5932 | |||||
| CRM / Salesforce, Inc. | 0,00 | 260,08 | 0,76 | 266,50 | 0,5860 | 0,3977 | |||
| TEL / TE Connectivity plc | 0,00 | 0,75 | 0,5819 | 0,5819 | |||||
| IEX / IDEX Corporation | 0,00 | 0,72 | 0,5570 | 0,5570 | |||||
| ICLR / ICON Public Limited Company | 0,00 | 15,36 | 0,64 | −4,02 | 0,5001 | −0,1130 | |||
| FTV / Fortive Corporation | 0,01 | −0,21 | 0,61 | −28,94 | 0,4772 | −0,3120 | |||
| CPRT / Copart, Inc. | 0,01 | 207,38 | 0,60 | 166,81 | 0,4682 | 0,2617 | |||
| KEYS / Keysight Technologies, Inc. | 0,00 | −0,59 | 0,55 | 8,73 | 0,4260 | −0,0345 | |||
| GOOG / Alphabet Inc. | 0,00 | −5,46 | 0,49 | 7,44 | 0,3813 | −0,0363 | |||
| LFUS / Littelfuse, Inc. | 0,00 | −32,97 | 0,41 | −22,85 | 0,3202 | −0,1671 | |||
| SGOL / abrdn Gold ETF Trust - abrdn Physical Gold Shares ETF | 0,01 | −2,28 | 0,41 | 3,57 | 0,3151 | −0,0433 | |||
| PRU / Prudential Financial, Inc. | 0,00 | 0,00 | 0,32 | −3,88 | 0,2501 | −0,0555 | |||
| VRSN / VeriSign, Inc. | 0,00 | −1,71 | 0,30 | 11,61 | 0,2320 | −0,0119 | |||
| CHRW / C.H. Robinson Worldwide, Inc. | 0,00 | 0,00 | 0,29 | −6,45 | 0,2256 | −0,0575 | |||
| OTIS / Otis Worldwide Corporation | 0,00 | −1,72 | 0,28 | −5,69 | 0,2190 | −0,0540 | |||
| NXPI / NXP Semiconductors N.V. | 0,00 | −61,07 | 0,28 | −55,31 | 0,2162 | −0,3517 | |||
| ADSK / Autodesk, Inc. | 0,00 | 0,00 | 0,24 | 18,32 | 0,1862 | 0,0011 | |||
| GGG / Graco Inc. | 0,00 | 0,23 | 0,1805 | 0,1805 | |||||
| NVO / Novo Nordisk A/S - Depositary Receipt (Common Stock) | 0,00 | 0,00 | 0,23 | −0,87 | 0,1768 | −0,0323 | |||
| RAL / Ralliant Corporation | 0,00 | 0,21 | 0,1615 | 0,1615 | |||||
| FND / Floor & Decor Holdings, Inc. | 0,00 | −100,00 | 0,00 | −100,00 | −0,3831 |