Grunnleggende statistikk
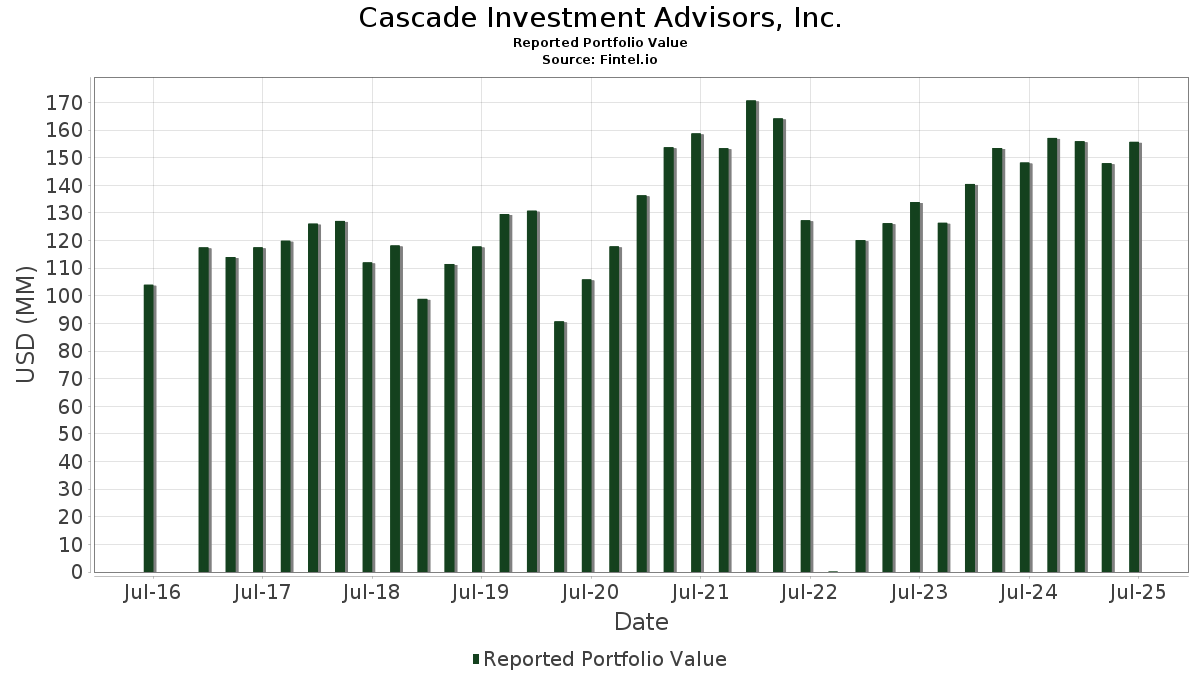
| Porteføljeverdi | $ 155 718 089 |
| Nåværende posisjoner | 110 |
Siste beholdninger, prestasjoner, forvaltet kapital (fra 13F, 13D)
Cascade Investment Advisors, Inc. har oppgitt 110 totale beholdninger i sine siste SEC-arkiveringer. Siste porteføljeverdi er beregnet til 155 718 089 USD. Faktisk forvaltet kapital (AUM) er denne verdien pluss kontanter (som ikke er oppgitt). Cascade Investment Advisors, Inc.s største beholdninger er Microsoft Corporation (US:MSFT) , Amazon.com, Inc. (US:AMZN) , Apple Inc. (US:AAPL) , Jabil Inc. (US:JBL) , and The Charles Schwab Corporation (US:SCHW) . Cascade Investment Advisors, Inc.s nye posisjoner inkluderer Mueller Industries, Inc. (US:MLI) , Grocery Outlet Holding Corp. (US:GO) , Air Products and Chemicals, Inc. (US:APD) , .
De største økningene dette kvartalet
Vi bruker endringen i porteføljeallokeringen fordi dette er det mest meningsfulle målet. Endringer kan skyldes handler eller endringer i aksjekursene.
| Verdipapirer | Aksjer (MM) |
Verdi (MM$) |
Portefølje % | ΔPortefølje % |
|---|---|---|---|---|
| 0,01 | 1,29 | 0,8308 | 0,8308 | |
| 0,02 | 3,78 | 2,4295 | 0,7701 | |
| 0,00 | 1,10 | 0,7050 | 0,7050 | |
| 0,01 | 1,05 | 0,6754 | 0,6754 | |
| 0,01 | 5,15 | 3,3083 | 0,6662 | |
| 0,01 | 3,01 | 1,9359 | 0,5296 | |
| 0,06 | 0,78 | 0,5033 | 0,5033 | |
| 0,03 | 1,67 | 1,0726 | 0,3958 | |
| 0,03 | 1,92 | 1,2310 | 0,3598 | |
| 0,00 | 0,54 | 0,3443 | 0,3443 |
De største reduksjonene dette kvartalet
Vi bruker endringen i porteføljeallokeringen fordi dette er det mest meningsfulle målet. Endringer kan skyldes handler eller endringer i aksjekurser.
| Verdipapirer | Aksjer (MM) |
Verdi (MM$) |
Portefølje % | ΔPortefølje % |
|---|---|---|---|---|
| 0,00 | 0,00 | −0,9948 | ||
| 0,02 | 3,79 | 2,4326 | −0,4308 | |
| 0,02 | 0,98 | 0,6290 | −0,2608 | |
| 0,01 | 1,98 | 1,2726 | −0,2460 | |
| 0,01 | 1,14 | 0,7300 | −0,2413 | |
| 0,03 | 1,67 | 1,0717 | −0,2165 | |
| 0,02 | 1,40 | 0,8982 | −0,2115 | |
| 0,01 | 2,61 | 1,6736 | −0,2026 | |
| 0,01 | 1,17 | 0,7519 | −0,1889 | |
| 0,01 | 1,48 | 0,9503 | −0,1887 |
13F- og Fondsarkiveringer
Dette skjemaet ble sendt inn den 2025-07-25 for rapporteringsperioden 2025-06-30. Klikk på lenkeikonet for å se hele transaksjonshistorikken.
Oppgradere for å låse opp premiedata og eksportere til Excel![]() .
.
| Verdipapirer | Type | Gjennomsnittlig aksjekurs | Aksjer (MM) |
ΔAksjer (%) |
ΔAksjer (%) |
Verdi ($MM) |
Portefølje (%) |
ΔPortefølje (%) |
|
|---|---|---|---|---|---|---|---|---|---|
| MSFT / Microsoft Corporation | 0,01 | −0,56 | 5,15 | 31,77 | 3,3083 | 0,6662 | |||
| AMZN / Amazon.com, Inc. | 0,02 | −1,06 | 3,80 | 14,08 | 2,4406 | 0,1895 | |||
| AAPL / Apple Inc. | 0,02 | −3,21 | 3,79 | −10,60 | 2,4326 | −0,4308 | |||
| JBL / Jabil Inc. | 0,02 | −3,88 | 3,78 | 54,09 | 2,4295 | 0,7701 | |||
| SCHW / The Charles Schwab Corporation | 0,04 | −3,84 | 3,28 | 12,10 | 2,1064 | 0,1287 | |||
| VTI / Vanguard Index Funds - Vanguard Total Stock Market ETF | 0,01 | 10,92 | 3,26 | 22,62 | 2,0960 | 0,2977 | |||
| USB / U.S. Bancorp | 0,07 | 1,04 | 3,08 | 8,30 | 1,9789 | 0,0558 | |||
| ORCL / Oracle Corporation | 0,01 | −7,36 | 3,01 | 44,90 | 1,9359 | 0,5296 | |||
| NVS / Novartis AG - Depositary Receipt (Common Stock) | 0,02 | −2,16 | 2,63 | 6,21 | 1,6906 | 0,0155 | |||
| CSCO / Cisco Systems, Inc. | 0,04 | −4,67 | 2,62 | 7,20 | 1,6841 | 0,0306 | |||
| GOOGL / Alphabet Inc. | 0,01 | −17,63 | 2,61 | −6,12 | 1,6736 | −0,2026 | |||
| AMAT / Applied Materials, Inc. | 0,01 | 2,93 | 2,61 | 29,86 | 1,6732 | 0,3171 | |||
| ICE / Intercontinental Exchange, Inc. | 0,01 | −0,36 | 2,51 | 5,94 | 1,6143 | 0,0112 | |||
| META / Meta Platforms, Inc. | 0,00 | −3,67 | 2,36 | 23,38 | 1,5187 | 0,2232 | |||
| HLT / Hilton Worldwide Holdings Inc. | 0,01 | −5,45 | 2,36 | 10,68 | 1,5173 | 0,0745 | |||
| CMI / Cummins Inc. | 0,01 | −0,29 | 2,25 | 4,21 | 1,4478 | −0,0146 | |||
| CAT / Caterpillar Inc. | 0,01 | −8,82 | 2,17 | 7,33 | 1,3911 | 0,0271 | |||
| OSIS / OSI Systems, Inc. | 0,01 | −9,23 | 2,16 | 5,02 | 1,3845 | −0,0028 | |||
| WSM / Williams-Sonoma, Inc. | 0,01 | −14,66 | 1,98 | −11,84 | 1,2726 | −0,2460 | |||
| JLL / Jones Lang LaSalle Incorporated | 0,01 | −0,84 | 1,96 | 2,35 | 1,2594 | −0,0360 | |||
| PCAR / PACCAR Inc | 0,02 | −3,83 | 1,95 | −6,08 | 1,2505 | −0,1511 | |||
| MDT / Medtronic plc | 0,02 | 0,43 | 1,93 | −2,57 | 1,2402 | −0,0994 | |||
| CTSH / Cognizant Technology Solutions Corporation | 0,02 | −0,28 | 1,92 | 1,69 | 1,2336 | −0,0427 | |||
| MCHP / Microchip Technology Incorporated | 0,03 | 2,29 | 1,92 | 48,64 | 1,2310 | 0,3598 | |||
| SBUX / Starbucks Corporation | 0,02 | 5,06 | 1,89 | −1,82 | 1,2138 | −0,0878 | |||
| TXRH / Texas Roadhouse, Inc. | 0,01 | −15,74 | 1,86 | −5,24 | 1,1967 | −0,1321 | |||
| PYPL / PayPal Holdings, Inc. | 0,03 | −1,48 | 1,86 | 12,24 | 1,1953 | 0,0744 | |||
| VOYA / Voya Financial, Inc. | 0,03 | 1,85 | 1,85 | 6,74 | 1,1900 | 0,0166 | |||
| NTR / Nutrien Ltd. | 0,03 | −3,16 | 1,79 | 13,54 | 1,1471 | 0,0840 | |||
| KMI / Kinder Morgan, Inc. | 0,06 | −1,84 | 1,77 | 1,14 | 1,1359 | −0,0458 | |||
| PAYC / Paycom Software, Inc. | 0,01 | −3,70 | 1,75 | 1,99 | 1,1218 | −0,0356 | |||
| EMR / Emerson Electric Co. | 0,01 | −5,19 | 1,73 | 15,32 | 1,1116 | 0,0971 | |||
| SPG / Simon Property Group, Inc. | 0,01 | −2,52 | 1,71 | −5,68 | 1,0988 | −0,1266 | |||
| ECG / Everus Construction Group, Inc. | 0,03 | −2,64 | 1,67 | 66,83 | 1,0726 | 0,3958 | |||
| SNY / Sanofi - Depositary Receipt (Common Stock) | 0,03 | 0,51 | 1,67 | −12,49 | 1,0717 | −0,2165 | |||
| QCOM / QUALCOMM Incorporated | 0,01 | 0,05 | 1,66 | 3,75 | 1,0671 | −0,0155 | |||
| MDU / MDU Resources Group, Inc. | 0,10 | 19,05 | 1,66 | 17,36 | 1,0639 | 0,1099 | |||
| ABNB / Airbnb, Inc. | 0,01 | 2,43 | 1,62 | 13,48 | 1,0381 | 0,0754 | |||
| MET / MetLife, Inc. | 0,02 | −2,47 | 1,59 | −2,34 | 1,0184 | −0,0787 | |||
| CHRW / C.H. Robinson Worldwide, Inc. | 0,02 | −0,37 | 1,55 | −6,64 | 0,9937 | −0,1265 | |||
| PFE / Pfizer Inc. | 0,06 | −1,61 | 1,54 | −5,88 | 0,9864 | −0,1166 | |||
| AIZ / Assurant, Inc. | 0,01 | 2,45 | 1,51 | −3,51 | 0,9717 | −0,0884 | |||
| BYD / Boyd Gaming Corporation | 0,02 | −7,20 | 1,51 | 10,28 | 0,9714 | 0,0445 | |||
| JNJ / Johnson & Johnson | 0,01 | −4,67 | 1,48 | −12,23 | 0,9503 | −0,1887 | |||
| ZBRA / Zebra Technologies Corporation | 0,00 | 2,75 | 1,44 | 12,15 | 0,9250 | 0,0569 | |||
| GTLS / Chart Industries, Inc. | 0,01 | 6,28 | 1,43 | 21,22 | 0,9215 | 0,1215 | |||
| BANR / Banner Corporation | 0,02 | −3,88 | 1,41 | −3,35 | 0,9080 | −0,0802 | |||
| COP / ConocoPhillips | 0,02 | −0,32 | 1,40 | −14,81 | 0,8982 | −0,2115 | |||
| UPS / United Parcel Service, Inc. | 0,01 | 27,83 | 1,37 | 17,29 | 0,8800 | 0,0906 | |||
| CTRA / Coterra Energy Inc. | 0,05 | 1,38 | 1,33 | −11,01 | 0,8565 | −0,1559 | |||
| PSA / Public Storage | 0,00 | −4,35 | 1,32 | −6,17 | 0,8496 | −0,1038 | |||
| SUI / Sun Communities, Inc. | 0,01 | −1,15 | 1,31 | −2,82 | 0,8410 | −0,0695 | |||
| CARR / Carrier Global Corporation | 0,02 | −0,42 | 1,30 | 14,89 | 0,8328 | 0,0704 | |||
| AKAM / Akamai Technologies, Inc. | 0,02 | 7,59 | 1,30 | 6,67 | 0,8317 | 0,0106 | |||
| BWXT / BWX Technologies, Inc. | 0,01 | 1,29 | 0,8308 | 0,8308 | |||||
| CMC / Commercial Metals Company | 0,03 | −9,16 | 1,28 | −3,41 | 0,8192 | −0,0735 | |||
| HII / Huntington Ingalls Industries, Inc. | 0,01 | −10,98 | 1,26 | 5,34 | 0,8110 | 0,0009 | |||
| KNF / Knife River Corporation | 0,02 | −0,26 | 1,25 | −9,73 | 0,8051 | −0,1335 | |||
| NSIT / Insight Enterprises, Inc. | 0,01 | −3,23 | 1,24 | −10,93 | 0,7959 | −0,1443 | |||
| MDLZ / Mondelez International, Inc. | 0,02 | 0,00 | 1,24 | −0,64 | 0,7936 | −0,0466 | |||
| HD / The Home Depot, Inc. | 0,00 | 1,57 | 1,23 | 1,65 | 0,7909 | −0,0282 | |||
| NUE / Nucor Corporation | 0,01 | −9,84 | 1,23 | −2,92 | 0,7901 | −0,0666 | |||
| SWK / Stanley Black & Decker, Inc. | 0,02 | 8,83 | 1,17 | −4,09 | 0,7533 | −0,0733 | |||
| CVX / Chevron Corporation | 0,01 | −1,74 | 1,17 | −15,95 | 0,7519 | −0,1889 | |||
| KIM / Kimco Realty Corporation | 0,05 | −3,17 | 1,16 | −4,15 | 0,7420 | −0,0729 | |||
| TEX / Terex Corporation | 0,02 | 1,96 | 1,15 | 25,98 | 0,7415 | 0,1222 | |||
| WFC / Wells Fargo & Company | 0,01 | −0,09 | 1,15 | 11,50 | 0,7413 | 0,0417 | |||
| BAX / Baxter International Inc. | 0,04 | 1,75 | 1,15 | −10,02 | 0,7390 | −0,1250 | |||
| FDX / FedEx Corporation | 0,01 | −15,18 | 1,14 | −20,95 | 0,7300 | −0,2413 | |||
| CVCO / Cavco Industries, Inc. | 0,00 | 1,10 | 0,7050 | 0,7050 | |||||
| TTMI / TTM Technologies, Inc. | 0,03 | −8,70 | 1,09 | 81,70 | 0,7019 | 0,2954 | |||
| ROCK / Gibraltar Industries, Inc. | 0,02 | −11,71 | 1,09 | −11,19 | 0,6983 | −0,1292 | |||
| BRK.B / Berkshire Hathaway Inc. | 0,00 | −9,54 | 1,06 | −17,54 | 0,6801 | −0,1873 | |||
| MLI / Mueller Industries, Inc. | 0,01 | 1,05 | 0,6754 | 0,6754 | |||||
| UFPI / UFP Industries, Inc. | 0,01 | 1,34 | 1,02 | −5,93 | 0,6521 | −0,0774 | |||
| FPX / First Trust Exchange-Traded Fund - First Trust US Equity Opportunities ETF | 0,01 | 0,30 | 0,98 | 30,16 | 0,6320 | 0,1207 | |||
| SON / Sonoco Products Company | 0,02 | −19,32 | 0,98 | −25,61 | 0,6290 | −0,2608 | |||
| ARE / Alexandria Real Estate Equities, Inc. | 0,01 | 11,12 | 0,96 | −12,79 | 0,6139 | −0,1266 | |||
| JPM / JPMorgan Chase & Co. | 0,00 | 0,00 | 0,95 | 18,14 | 0,6113 | 0,0670 | |||
| LOW / Lowe's Companies, Inc. | 0,00 | 0,00 | 0,88 | −4,85 | 0,5667 | −0,0602 | |||
| GO / Grocery Outlet Holding Corp. | 0,06 | 0,78 | 0,5033 | 0,5033 | |||||
| WY / Weyerhaeuser Company | 0,03 | 17,36 | 0,76 | 2,97 | 0,4902 | −0,0108 | |||
| USFR / WisdomTree Trust - WisdomTree Floating Rate Treasury Fund | 0,01 | 10,85 | 0,75 | 10,78 | 0,4821 | 0,0242 | |||
| WGO / Winnebago Industries, Inc. | 0,03 | 4,63 | 0,74 | −11,96 | 0,4733 | −0,0923 | |||
| PK / Park Hotels & Resorts Inc. | 0,07 | −5,36 | 0,73 | −9,42 | 0,4698 | −0,0756 | |||
| BRK.A / Berkshire Hathaway Inc. | 0,00 | 0,00 | 0,73 | −8,77 | 0,4680 | −0,0716 | |||
| FLS / Flowserve Corporation | 0,01 | −7,01 | 0,72 | −0,28 | 0,4594 | −0,0256 | |||
| EPD / Enterprise Products Partners L.P. - Limited Partnership | 0,02 | 0,00 | 0,70 | −9,22 | 0,4494 | −0,0713 | |||
| ETN / Eaton Corporation plc | 0,00 | −4,87 | 0,70 | 24,91 | 0,4482 | 0,0707 | |||
| ESGV / Vanguard World Fund - Vanguard ESG U.S. Stock ETF | 0,01 | 0,00 | 0,67 | 11,98 | 0,4325 | 0,0259 | |||
| APLE / Apple Hospitality REIT, Inc. | 0,06 | 10,96 | 0,67 | 0,30 | 0,4323 | −0,0212 | |||
| APD / Air Products and Chemicals, Inc. | 0,00 | 0,54 | 0,3443 | 0,3443 | |||||
| VYM / Vanguard Whitehall Funds - Vanguard High Dividend Yield ETF | 0,00 | 0,00 | 0,43 | 3,38 | 0,2752 | −0,0050 | |||
| NOC / Northrop Grumman Corporation | 0,00 | 0,00 | 0,42 | −2,55 | 0,2703 | −0,0210 | |||
| SCHV / Schwab Strategic Trust - Schwab U.S. Large-Cap Value ETF | 0,01 | 0,26 | 0,41 | 4,30 | 0,2652 | −0,0022 | |||
| SPY / SPDR S&P 500 ETF | 0,00 | 0,00 | 0,40 | 10,22 | 0,2569 | 0,0121 | |||
| SPYV / SPDR Series Trust - SPDR Portfolio S&P 500 Value ETF | 0,01 | −1,69 | 0,38 | 0,80 | 0,2445 | −0,0109 | |||
| VUG / Vanguard Index Funds - Vanguard Growth ETF | 0,00 | 0,00 | 0,33 | 18,02 | 0,2151 | 0,0236 | |||
| XOM / Exxon Mobil Corporation | 0,00 | 0,00 | 0,32 | −9,48 | 0,2029 | −0,0327 | |||
| SCHA / Schwab Strategic Trust - Schwab U.S. Small-Cap ETF | 0,01 | 0,00 | 0,32 | 7,88 | 0,2025 | 0,0052 | |||
| ABT / Abbott Laboratories | 0,00 | −3,52 | 0,31 | −0,95 | 0,2011 | −0,0128 | |||
| GILD / Gilead Sciences, Inc. | 0,00 | 0,00 | 0,31 | −0,97 | 0,1965 | −0,0125 | |||
| TCHP / T. Rowe Price Exchange-Traded Funds, Inc. - T. Rowe Price Blue Chip Growth ETF | 0,01 | 7,33 | 0,28 | 27,85 | 0,1804 | 0,0318 | |||
| BSV / Vanguard Bond Index Funds - Vanguard Short-Term Bond ETF | 0,00 | 0,00 | 0,28 | 0,72 | 0,1786 | −0,0083 | |||
| KO / The Coca-Cola Company | 0,00 | −4,78 | 0,25 | −6,02 | 0,1609 | −0,0191 | |||
| RSP / Invesco Exchange-Traded Fund Trust - Invesco S&P 500 Equal Weight ETF | 0,00 | 0,00 | 0,24 | 4,85 | 0,1534 | −0,0005 | |||
| COST / Costco Wholesale Corporation | 0,00 | −31,62 | 0,24 | −28,40 | 0,1526 | −0,0718 | |||
| HON / Honeywell International Inc. | 0,00 | 0,00 | 0,23 | 10,00 | 0,1488 | 0,0064 | |||
| SHEL / Shell plc - Depositary Receipt (Common Stock) | 0,00 | 0,00 | 0,21 | −3,65 | 0,1356 | −0,0129 | |||
| ALL / The Allstate Corporation | 0,00 | 0,00 | 0,21 | −2,80 | 0,1342 | −0,0111 | |||
| PLUS / ePlus inc. | 0,00 | −100,00 | 0,00 | 0,0000 | |||||
| QUAL / iShares Trust - iShares MSCI USA Quality Factor ETF | 0,00 | −100,00 | 0,00 | 0,0000 | |||||
| GJR / Strats Trust For Procter & Gambel Security - Preferred Security | 0,00 | −100,00 | 0,00 | 0,0000 | |||||
| MCK / McKesson Corporation | 0,00 | −100,00 | 0,00 | 0,0000 | |||||
| PEP / PepsiCo, Inc. | 0,00 | −100,00 | 0,00 | 0,0000 | |||||
| SKX / Skechers U.S.A., Inc. | 0,00 | −100,00 | 0,00 | −100,00 | −0,9948 | ||||
| IBM / International Business Machines Corporation | 0,00 | −100,00 | 0,00 | 0,0000 | |||||
| VSH / Vishay Intertechnology, Inc. | 0,00 | −100,00 | 0,00 | 0,0000 |