Grunnleggende statistikk
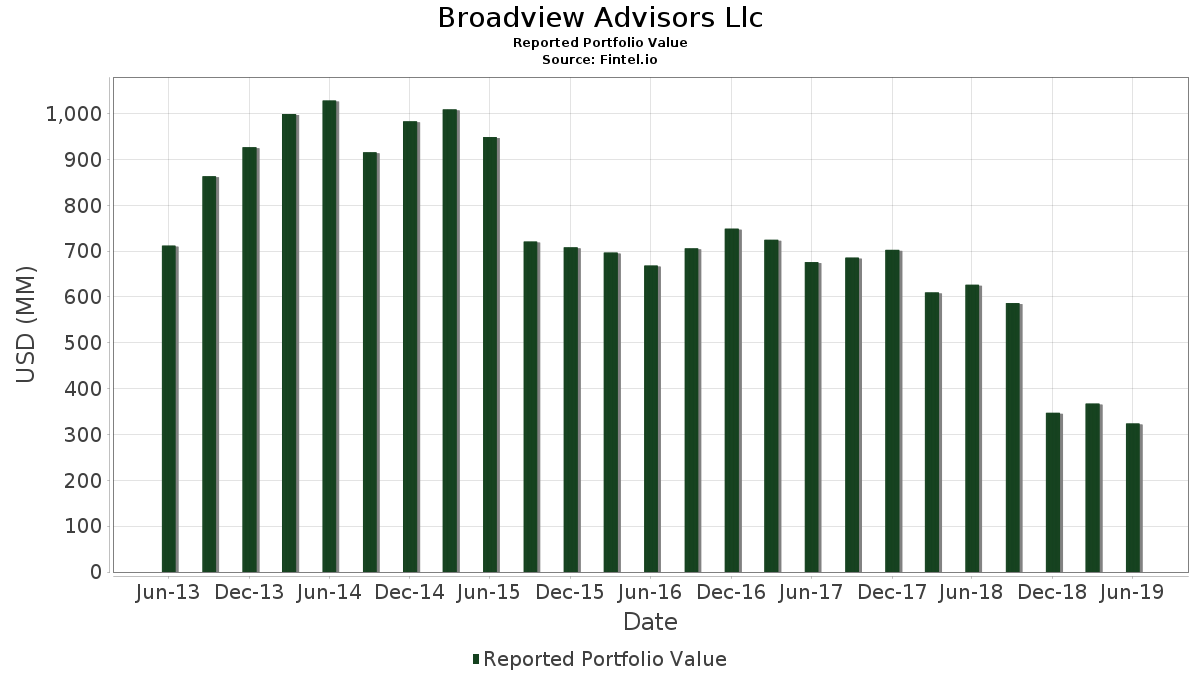
| Porteføljeverdi | $ 323 915 000 |
| Nåværende posisjoner | 70 |
Siste beholdninger, prestasjoner, forvaltet kapital (fra 13F, 13D)
Broadview Advisors Llc har oppgitt 70 totale beholdninger i sine siste SEC-arkiveringer. Siste porteføljeverdi er beregnet til 323 915 000 USD. Faktisk forvaltet kapital (AUM) er denne verdien pluss kontanter (som ikke er oppgitt). Broadview Advisors Llcs største beholdninger er MGIC Investment Corporation (US:MTG) , Commvault Systems, Inc. (US:CVLT) , Double Eagle Acquisition Corp. (US:EAGLW) , Rexnord Corp (US:RXN) , and TCF Financial Corporation Depositary Shares representing 5.70% Series C Non-Cumulative Preferred Stock (US:) . Broadview Advisors Llcs nye posisjoner inkluderer PRA Health Sciences Inc (US:US69354M1080) , .
De største økningene dette kvartalet
Vi bruker endringen i porteføljeallokeringen fordi dette er det mest meningsfulle målet. Endringer kan skyldes handler eller endringer i aksjekursene.
| Verdipapirer | Aksjer (MM) |
Verdi (MM$) |
Portefølje % | ΔPortefølje % |
|---|---|---|---|---|
| 0,22 | 10,99 | 3,3941 | 3,3941 | |
| 0,32 | 9,82 | 3,0320 | 3,0320 | |
| 0,24 | 9,79 | 3,0212 | 3,0212 | |
| 0,64 | 9,52 | 2,9390 | 2,9390 | |
| 0,19 | 8,56 | 2,6433 | 2,6433 | |
| 0,15 | 7,40 | 2,2846 | 2,2846 | |
| 0,02 | 6,77 | 2,0888 | 2,0888 | |
| 0,23 | 6,46 | 1,9931 | 1,9931 | |
| 0,15 | 6,23 | 1,9233 | 1,9233 | |
| 0,35 | 5,89 | 1,8190 | 1,8190 |
De største reduksjonene dette kvartalet
Vi bruker endringen i porteføljeallokeringen fordi dette er det mest meningsfulle målet. Endringer kan skyldes handler eller endringer i aksjekurser.
| Verdipapirer | Aksjer (MM) |
Verdi (MM$) |
Portefølje % | ΔPortefølje % |
|---|---|---|---|---|
| 0,05 | 1,61 | 0,4961 | −1,0981 | |
| 0,00 | 0,00 | −0,9869 | ||
| 0,35 | 5,58 | 1,7230 | −0,8304 | |
| 0,21 | 5,34 | 1,6486 | −0,8264 | |
| 0,05 | 4,10 | 1,2661 | −0,6611 | |
| 0,07 | 3,11 | 0,9607 | −0,5870 | |
| 0,02 | 3,33 | 1,0296 | −0,5478 | |
| 0,02 | 0,79 | 0,2451 | −0,3541 | |
| 0,00 | 0,00 | −0,2069 | ||
| 0,00 | 0,00 | −0,2069 |
13F- og Fondsarkiveringer
Dette skjemaet ble sendt inn den 2019-08-14 for rapporteringsperioden 2019-06-30. Klikk på lenkeikonet for å se hele transaksjonshistorikken.
Oppgradere for å låse opp premiedata og eksportere til Excel![]() .
.
| Verdipapirer | Type | Gjennomsnittlig aksjekurs | Aksjer (MM) |
ΔAksjer (%) |
ΔAksjer (%) |
Verdi ($MM) |
Portefølje (%) |
ΔPortefølje (%) |
|
|---|---|---|---|---|---|---|---|---|---|
| MTG / MGIC Investment Corporation | 1,17 | −13,43 | 15,41 | −13,76 | 4,7587 | −0,1072 | |||
| CVLT / Commvault Systems, Inc. | 0,22 | −1,32 | 10,99 | −24,37 | 3,3941 | 3,3941 | |||
| EAGLW / Double Eagle Acquisition Corp. | 0,71 | −0,87 | 10,70 | 34,44 | 3,3043 | 1,1369 | |||
| RXN / Rexnord Corp | 0,32 | −2,69 | 9,82 | 16,97 | 3,0320 | 3,0320 | |||
| / TCF Financial Corporation Depositary Shares representing 5.70% Series C Non-Cumulative Preferred Stock | 0,24 | 36,13 | 9,79 | 35,97 | 3,0212 | 3,0212 | |||
| EHC / Encompass Health Corporation | 0,15 | 18,39 | 9,64 | 28,45 | 2,9749 | 0,9325 | |||
| FEYE / FireEye Inc | 0,64 | 19,03 | 9,52 | 5,00 | 2,9390 | 2,9390 | |||
| WAL / Western Alliance Bancorporation | 0,19 | −4,94 | 8,56 | 3,59 | 2,6433 | 2,6433 | |||
| BC / Brunswick Corporation | 0,18 | 84,44 | 8,42 | 68,16 | 2,5988 | 1,2360 | |||
| MAS / Masco Corporation | 0,21 | 47,11 | 8,17 | 46,84 | 2,5210 | 1,0071 | |||
| RAMP / LiveRamp Holdings, Inc. | 0,15 | −0,81 | 7,40 | −11,88 | 2,2846 | 2,2846 | |||
| SAM / The Boston Beer Company, Inc. | 0,02 | −17,69 | 6,77 | 5,49 | 2,0888 | 2,0888 | |||
| TRIP / Tripadvisor, Inc. | 0,14 | −10,05 | 6,60 | −19,07 | 2,0373 | −0,1826 | |||
| PRAA / PRA Group, Inc. | 0,23 | −0,99 | 6,46 | 3,91 | 1,9931 | 1,9931 | |||
| KMT / Kennametal Inc. | 0,17 | 475,79 | 6,43 | 479,53 | 1,9842 | 1,6822 | |||
| GMED / Globus Medical, Inc. | 0,15 | −1,47 | 6,23 | −15,65 | 1,9233 | 1,9233 | |||
| US3024451011 / FLIR Systems, Inc. | 0,11 | 40,71 | 6,06 | 59,97 | 1,8718 | 0,8400 | |||
| WBT / Welbilt Inc | 0,35 | −2,53 | 5,89 | −0,62 | 1,8190 | 1,8190 | |||
| US2243991054 / Crane Co. | 0,07 | −2,18 | 5,70 | −3,55 | 1,7600 | 0,1508 | |||
| CHUY / Chuy's Holdings, Inc. | 0,25 | −1,75 | 5,66 | −1,10 | 1,7474 | 1,7474 | |||
| FOE / Ferro Corp. | 0,35 | −28,70 | 5,58 | −40,49 | 1,7230 | −0,8304 | |||
| OLN / Olin Corporation | 0,25 | 57,05 | 5,55 | 48,70 | 1,7137 | 1,7137 | |||
| CTLT / Catalent, Inc. | 0,10 | −23,98 | 5,52 | 1,53 | 1,7045 | 0,2240 | |||
| VCRA / Vocera Communication Inc | 0,17 | 196,62 | 5,46 | 199,29 | 1,6844 | 1,1881 | |||
| AVNS / Avanos Medical, Inc. | 0,12 | 159,89 | 5,40 | 165,54 | 1,6674 | 1,6674 | |||
| KRNT / Kornit Digital Ltd. | 0,17 | −41,80 | 5,39 | −22,59 | 1,6640 | 1,6640 | |||
| HAIN / The Hain Celestial Group, Inc. | 0,25 | 46,34 | 5,37 | 38,63 | 1,6585 | 1,6585 | |||
| ATI / ATI Inc. | 0,21 | −40,39 | 5,34 | −41,26 | 1,6486 | −0,8264 | |||
| US69354M1080 / PRA Health Sciences Inc | 0,05 | 5,30 | 1,6378 | 1,6378 | |||||
| CSII / Cardiovascular Systems Inc. | 0,12 | 208,45 | 5,29 | 242,62 | 1,6331 | 1,6331 | |||
| MRVL / Marvell Technology, Inc. | 0,22 | −44,58 | 5,25 | −33,49 | 1,6214 | 1,6214 | |||
| VBTX / Veritex Holdings, Inc. | 0,20 | −1,42 | 5,08 | 5,64 | 1,5683 | 1,5683 | |||
| CSL / Carlisle Companies Incorporated | 0,04 | −38,52 | 4,99 | −29,60 | 1,5411 | 1,5411 | |||
| ENTG / Entegris, Inc. | 0,13 | −20,52 | 4,96 | −16,89 | 1,5316 | 1,5316 | |||
| BECN / Beacon Roofing Supply, Inc. | 0,13 | −13,07 | 4,76 | −0,75 | 1,4686 | 0,1637 | |||
| CIEN / Ciena Corporation | 0,11 | −2,28 | 4,67 | 7,64 | 1,4405 | 0,2603 | |||
| NTRA / Natera, Inc. | 0,17 | −2,26 | 4,61 | 30,75 | 1,4241 | 1,4241 | |||
| JWN / Nordstrom, Inc. | 0,14 | −1,42 | 4,57 | −29,24 | 1,4121 | 1,4121 | |||
| LTXB / LegacyTexas Financial Group Inc. | 0,11 | −34,69 | 4,31 | −28,89 | 1,3300 | 1,3300 | |||
| PTC / PTC Inc. | 0,05 | −40,50 | 4,10 | −42,07 | 1,2661 | −0,6611 | |||
| NCMI / National CineMedia, Inc. | 0,59 | −0,56 | 3,89 | −7,49 | 1,2009 | 0,0561 | |||
| HIBB / Hibbett, Inc. | 0,21 | −2,59 | 3,87 | −22,28 | 1,1935 | −0,1606 | |||
| FRPT / Freshpet, Inc. | 0,08 | −29,49 | 3,66 | −24,11 | 1,1312 | −0,1832 | |||
| ZBRA / Zebra Technologies Corporation | 0,02 | 3,54 | 1,0929 | 1,0929 | |||||
| KEYS / Keysight Technologies, Inc. | 0,04 | 3,43 | 1,0583 | 1,0583 | |||||
| EPC / Edgewell Personal Care Company | 0,13 | 42,74 | 3,40 | −12,36 | 1,0509 | 1,0509 | |||
| VMC / Vulcan Materials Company | 0,02 | −50,37 | 3,33 | −42,44 | 1,0296 | −0,5478 | |||
| TWIN / Twin Disc, Incorporated | 0,22 | −11,44 | 3,25 | −19,70 | 1,0030 | −0,0985 | |||
| ZION / Zions Bancorporation, National Association | 0,07 | −45,95 | 3,11 | −45,26 | 0,9607 | −0,5870 | |||
| ROAD / Construction Partners, Inc. | 0,19 | −2,81 | 2,79 | 14,32 | 0,8601 | 0,8601 | |||
| SMG / The Scotts Miracle-Gro Company | 0,02 | −81,98 | 2,21 | −77,42 | 0,6826 | 0,6826 | |||
| NVRO / Nevro Corp. | 0,03 | −1,77 | 2,06 | 1,87 | 0,6375 | 0,6375 | |||
| AMLP / ALPS ETF Trust - Alerian MLP ETF | 0,20 | 0,00 | 2,02 | −1,80 | 0,6224 | 0,6224 | |||
| RNST / Renasant Corporation | 0,06 | −13,43 | 2,00 | −8,10 | 0,6168 | 0,6168 | |||
| NATI / National Instruments Corp. | 0,05 | −2,16 | 2,00 | −7,37 | 0,6165 | 0,6165 | |||
| PACW / Pacwest Bancorp | 0,05 | −1,83 | 1,77 | 1,37 | 0,5480 | 0,5480 | |||
| BOX / Box, Inc. | 0,09 | −52,73 | 1,65 | −56,90 | 0,5094 | 0,5094 | |||
| GDI / Gardner Denver Holdings, Inc. | 0,05 | −77,94 | 1,61 | −72,56 | 0,4961 | −1,0981 | |||
| WLL / Whiting Petroleum Corp (New) | 0,09 | 4,56 | 1,60 | −25,28 | 0,4927 | −0,0888 | |||
| TVTY / Tivity Health Inc | 0,05 | −77,84 | 0,84 | −79,26 | 0,2584 | 0,2584 | |||
| SRCL / Stericycle, Inc. | 0,02 | −58,90 | 0,79 | −63,93 | 0,2451 | −0,3541 | |||
| IWM / iShares Trust - iShares Russell 2000 ETF | 0,01 | −58,20 | 0,79 | −57,55 | 0,2448 | 0,2448 | |||
| GNRC / Generac Holdings Inc. | 0,01 | −9,09 | 0,76 | 23,23 | 0,2359 | 0,0671 | |||
| GOOG / Alphabet Inc. | 0,00 | −61,33 | 0,72 | −64,38 | 0,2226 | 0,2226 | |||
| MLM / Martin Marietta Materials, Inc. | 0,00 | 0,00 | 0,68 | 14,50 | 0,2096 | 0,0482 | |||
| SPY / SPDR S&P 500 ETF | 0,00 | −41,18 | 0,66 | −38,98 | 0,2034 | 0,2034 | |||
| CSFL / Centerstate Banks, Inc. | 0,02 | 0,00 | 0,54 | −3,24 | 0,1658 | 0,1658 | |||
| APA / APA Corporation | 0,02 | 94,68 | 0,53 | 62,58 | 0,1636 | 0,0749 | |||
| CVS / CVS Health Corporation | 0,01 | 0,00 | 0,37 | 0,82 | 0,1139 | 0,0143 | |||
| HAL / Halliburton Company | 0,01 | 22,00 | 0,32 | −5,36 | 0,0982 | 0,0982 | |||
| PSTG / Pure Storage, Inc. | 0,00 | −100,00 | 0,00 | −100,00 | 0,0000 | ||||
| PTEN / Patterson-UTI Energy, Inc. | 0,00 | −100,00 | 0,00 | −100,00 | −0,0719 | ||||
| KMI / Kinder Morgan, Inc. | 0,00 | −100,00 | 0,00 | −100,00 | −0,0626 | ||||
| JPM / JPMorgan Chase & Co. | 0,00 | −100,00 | 0,00 | −100,00 | −0,1130 | ||||
| RRC / Range Resources Corporation | 0,00 | −100,00 | 0,00 | −100,00 | −0,9869 | ||||
| EMR / Emerson Electric Co. | 0,00 | −100,00 | 0,00 | −100,00 | −0,1985 | ||||
| WMT / Walmart Inc. | 0,00 | −100,00 | 0,00 | −100,00 | 0,0000 | ||||
| ANET / Arista Networks Inc | 0,00 | −100,00 | 0,00 | −100,00 | −0,0577 | ||||
| US98212B1035 / WPX Energy, Inc. | 0,00 | −100,00 | 0,00 | −100,00 | 0,0000 | ||||
| NTR / Nutrien Ltd. | 0,00 | −100,00 | 0,00 | −100,00 | 0,0000 | ||||
| US0325111070 / Anadarko Petroleum Corp. | 0,00 | −100,00 | 0,00 | −100,00 | −0,0656 | ||||
| CLDR / Cloudera Inc | 0,00 | −100,00 | 0,00 | −100,00 | 0,0000 | ||||
| PRU / Prudential Financial, Inc. | 0,00 | −100,00 | 0,00 | −100,00 | −0,1225 | ||||
| IWO / iShares Trust - iShares Russell 2000 Growth ETF | 0,00 | −100,00 | 0,00 | −100,00 | 0,0000 | ||||
| BAC / Bank of America Corporation | 0,00 | −100,00 | 0,00 | −100,00 | 0,0000 | ||||
| USB / U.S. Bancorp | 0,00 | −100,00 | 0,00 | −100,00 | −0,0983 | ||||
| PANW / Palo Alto Networks, Inc. | 0,00 | −100,00 | 0,00 | −100,00 | 0,0000 | ||||
| APAM / Artisan Partners Asset Management Inc. | 0,00 | −100,00 | 0,00 | −100,00 | 0,0000 | ||||
| DOW / Dow Inc. | 0,00 | −100,00 | 0,00 | −100,00 | −0,2069 | ||||
| EW / Edwards Lifesciences Corporation | 0,00 | −100,00 | 0,00 | −100,00 | −0,0716 | ||||
| AR / Antero Resources Corporation | 0,00 | −100,00 | 0,00 | −100,00 | 0,0000 | ||||
| THR / Thermon Group Holdings, Inc. | 0,00 | −100,00 | 0,00 | −100,00 | 0,0000 | ||||
| IBKC / IBERIABANK Corp. | 0,00 | −100,00 | 0,00 | −100,00 | 0,0000 | ||||
| FDC / First Data Corporation | 0,00 | −100,00 | 0,00 | −100,00 | 0,0000 | ||||
| BOKF / BOK Financial Corporation | 0,00 | −100,00 | 0,00 | −100,00 | 0,0000 | ||||
| AAPL / Apple Inc. | 0,00 | −100,00 | 0,00 | −100,00 | −0,2069 | ||||
| ARES / Ares Management Corporation | 0,00 | −100,00 | 0,00 | −100,00 | 0,0000 |