Grunnleggende statistikk
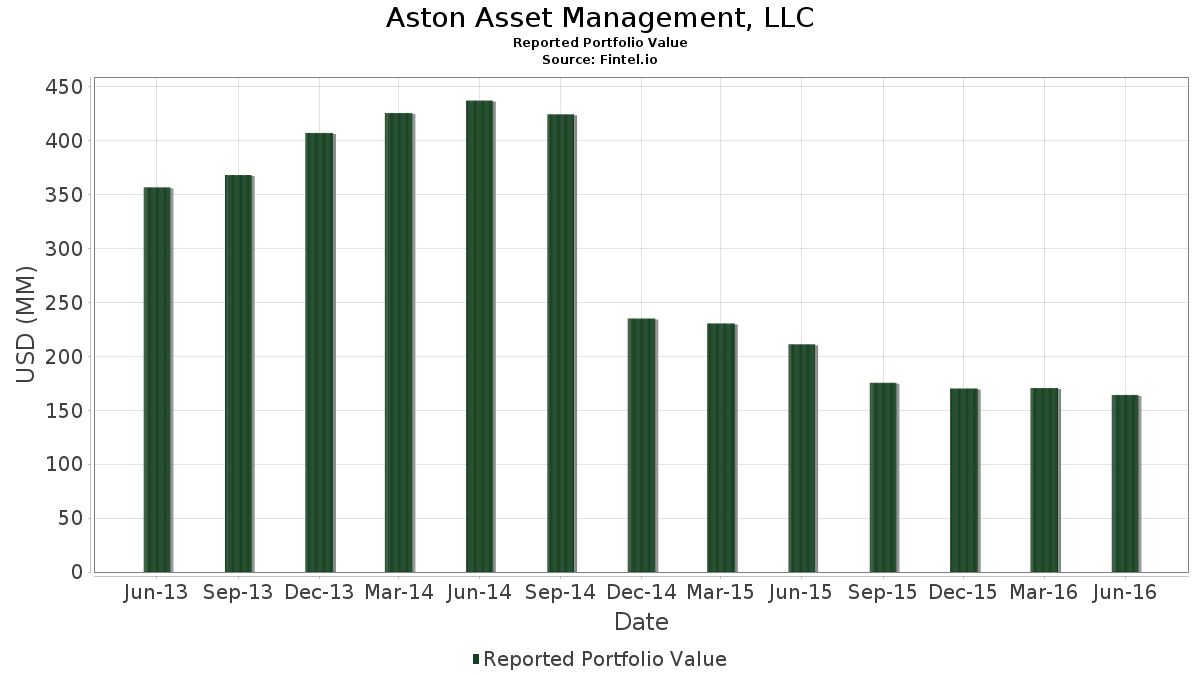
| Porteføljeverdi | $ 164 189 000 |
| Nåværende posisjoner | 106 |
Siste beholdninger, prestasjoner, forvaltet kapital (fra 13F, 13D)
Aston Asset Management, LLC har oppgitt 106 totale beholdninger i sine siste SEC-arkiveringer. Siste porteføljeverdi er beregnet til 164 189 000 USD. Faktisk forvaltet kapital (AUM) er denne verdien pluss kontanter (som ikke er oppgitt). Aston Asset Management, LLCs største beholdninger er ProShares Trust - ProShares Large Cap Core Plus (US:CSM) , Quest Diagnostics Incorporated (US:DGX) , Iron Mountain Incorporated (US:IRM) , Microsoft Corporation (US:MSFT) , and Verizon Communications Inc. (US:VZ) . Aston Asset Management, LLCs nye posisjoner inkluderer Johnson Controls International plc (US:JCI) , Amgen Inc. (US:AMGN) , TE Connectivity plc (US:TEL) , Cardinal Health, Inc. (US:CAH) , and Stericycle, Inc. (US:SRCL) .
De største økningene dette kvartalet
Vi bruker endringen i porteføljeallokeringen fordi dette er det mest meningsfulle målet. Endringer kan skyldes handler eller endringer i aksjekursene.
| Verdipapirer | Aksjer (MM) |
Verdi (MM$) |
Portefølje % | ΔPortefølje % |
|---|---|---|---|---|
| 0,03 | 1,55 | 0,9428 | 0,9428 | |
| 0,01 | 1,48 | 0,9014 | 0,9014 | |
| 0,03 | 1,44 | 0,8789 | 0,8789 | |
| 0,01 | 0,99 | 0,6017 | 0,6017 | |
| 0,01 | 0,91 | 0,5567 | 0,5567 | |
| 0,02 | 1,66 | 1,0104 | 0,4126 | |
| 0,02 | 0,64 | 0,3867 | 0,3867 | |
| 0,09 | 3,41 | 2,0769 | 0,3626 | |
| 0,03 | 0,97 | 0,5896 | 0,3094 | |
| 0,03 | 0,79 | 0,4805 | 0,3059 |
De største reduksjonene dette kvartalet
Vi bruker endringen i porteføljeallokeringen fordi dette er det mest meningsfulle målet. Endringer kan skyldes handler eller endringer i aksjekurser.
| Verdipapirer | Aksjer (MM) |
Verdi (MM$) |
Portefølje % | ΔPortefølje % |
|---|---|---|---|---|
| 0,00 | 0,00 | −1,0760 | ||
| 0,00 | 0,00 | −0,6623 | ||
| 0,00 | 0,00 | −0,6177 | ||
| 0,00 | 0,00 | −0,6031 | ||
| 0,03 | 0,80 | 0,4866 | −0,5489 | |
| 0,12 | 6,09 | 3,7110 | −0,5163 | |
| 0,00 | 0,00 | −0,4864 | ||
| 0,01 | 0,32 | 0,1943 | −0,3619 | |
| 0,01 | 0,43 | 0,2637 | −0,3423 | |
| 0,04 | 2,10 | 1,2784 | −0,3421 |
13F- og Fondsarkiveringer
Dette skjemaet ble sendt inn den 2016-08-11 for rapporteringsperioden 2016-06-30. Klikk på lenkeikonet for å se hele transaksjonshistorikken.
Oppgradere for å låse opp premiedata og eksportere til Excel![]() .
.
| Verdipapirer | Type | Gjennomsnittlig aksjekurs | Aksjer (MM) |
ΔAksjer (%) |
ΔAksjer (%) |
Verdi ($MM) |
Portefølje (%) |
ΔPortefølje (%) |
|
|---|---|---|---|---|---|---|---|---|---|
| CSM / ProShares Trust - ProShares Large Cap Core Plus | 0,12 | −16,48 | 6,09 | −15,53 | 3,7110 | −0,5163 | |||
| DGX / Quest Diagnostics Incorporated | 0,05 | −9,36 | 3,68 | 3,26 | 2,2389 | 0,1525 | |||
| IRM / Iron Mountain Incorporated | 0,09 | −0,74 | 3,41 | 16,58 | 2,0769 | 0,3626 | |||
| MSFT / Microsoft Corporation | 0,07 | −0,37 | 3,41 | −7,70 | 2,0744 | −0,0881 | |||
| VZ / Verizon Communications Inc. | 0,05 | −0,26 | 2,93 | 2,95 | 1,7827 | 0,1165 | |||
| PNC / The PNC Financial Services Group, Inc. | 0,03 | 0,14 | 2,75 | −3,61 | 1,6755 | 0,0029 | |||
| OMC / Omnicom Group Inc. | 0,03 | −0,31 | 2,75 | −2,31 | 1,6749 | 0,0251 | |||
| INTC / Intel Corporation | 0,08 | 0,18 | 2,57 | 1,58 | 1,5665 | 0,0826 | |||
| FAST / Fastenal Company | 0,06 | −0,28 | 2,56 | −9,68 | 1,5622 | −0,1022 | |||
| MSI / Motorola Solutions, Inc. | 0,04 | 30,24 | 2,55 | 13,62 | 1,5549 | 0,2380 | |||
| WFC / Wells Fargo & Company | 0,05 | 0,04 | 2,54 | −2,08 | 1,5500 | 0,0269 | |||
| JNPR / Juniper Networks, Inc. | 0,11 | −2,28 | 2,46 | −13,83 | 1,4989 | −0,1749 | |||
| USB / U.S. Bancorp | 0,06 | 0,23 | 2,33 | −0,43 | 1,4197 | 0,0477 | |||
| WMT / Walmart Inc. | 0,03 | −0,48 | 2,26 | 5,32 | 1,3752 | 0,1187 | |||
| 887228104 / Time Inc. | 0,13 | −1,42 | 2,18 | 5,12 | 1,3265 | 0,1122 | |||
| GLW / Corning Incorporated | 0,10 | −0,53 | 2,10 | −2,50 | 1,2815 | 0,0167 | |||
| ARNC / Arconic Corporation | 0,23 | −7,62 | 2,10 | −10,60 | 1,2790 | −0,0976 | |||
| CPA / Copa Holdings, S.A. | 0,04 | −1,58 | 2,10 | −24,09 | 1,2784 | −0,3421 | |||
| NYT / The New York Times Company | 0,17 | −3,89 | 2,08 | −6,68 | 1,2674 | −0,0395 | |||
| UPS / United Parcel Service, Inc. | 0,02 | 0,36 | 2,07 | 2,47 | 1,2614 | 0,0769 | |||
| TDC / Teradata Corporation | 0,08 | −3,05 | 2,04 | −7,36 | 1,2413 | −0,0481 | |||
| FTI / TechnipFMC plc | 0,08 | −11,34 | 2,02 | −13,58 | 1,2291 | −0,1394 | |||
| US92220P1057 / Varian Medical Systems, Inc. | 0,02 | −7,10 | 2,01 | −4,51 | 1,2260 | −0,0094 | |||
| OXY / Occidental Petroleum Corporation | 0,03 | −0,49 | 1,99 | 9,79 | 1,2090 | 0,1494 | |||
| FMC / FMC Corporation | 0,04 | −9,71 | 1,98 | 3,50 | 1,2053 | 0,0848 | |||
| CREE / Cree, Inc. | 0,08 | 8,61 | 1,95 | −8,75 | 1,1870 | −0,0648 | |||
| US0549371070 / BB&T Corp. | 0,05 | −0,42 | 1,94 | 6,55 | 1,1785 | 0,1142 | |||
| 74005P104 / Praxair, Inc. | 0,02 | 0,30 | 1,89 | −1,51 | 1,1523 | 0,0265 | |||
| APU / AmeriGas Partners, L.P. | 0,04 | −0,19 | 1,85 | 7,26 | 1,1249 | 0,1157 | |||
| TRI / Thomson Reuters Corporation | 0,04 | 0,36 | 1,81 | 0,17 | 1,1012 | 0,0433 | |||
| VTR / Ventas, Inc. | 0,02 | −21,92 | 1,80 | −9,68 | 1,0969 | −0,0717 | |||
| NFG / National Fuel Gas Company | 0,03 | −0,50 | 1,79 | 13,01 | 1,0896 | 0,1619 | |||
| MAT / Mattel, Inc. | 0,06 | −17,12 | 1,78 | −22,86 | 1,0853 | −0,2685 | |||
| XOM / Exxon Mobil Corporation | 0,02 | −0,46 | 1,77 | 11,62 | 1,0768 | 0,1485 | |||
| AKAM / Akamai Technologies, Inc. | 0,03 | −12,36 | 1,75 | −11,84 | 1,0658 | −0,0975 | |||
| VVC / Vectren Corp. | 0,03 | −0,49 | 1,72 | 3,67 | 1,0494 | 0,0754 | |||
| GEO / The GEO Group, Inc. | 0,05 | −0,92 | 1,72 | −2,33 | 1,0451 | 0,0154 | |||
| CNK / Cinemark Holdings, Inc. | 0,05 | −0,50 | 1,71 | 1,24 | 1,0427 | 0,0517 | |||
| JBL / Jabil Inc. | 0,09 | 6,31 | 1,69 | 1,93 | 1,0281 | 0,0576 | |||
| TGNA / TEGNA Inc. | 0,07 | 14,26 | 1,69 | 12,84 | 1,0275 | 0,1513 | |||
| GNTX / Gentex Corporation | 0,11 | −2,03 | 1,69 | −3,55 | 1,0269 | 0,0024 | |||
| UNP / Union Pacific Corporation | 0,02 | 48,31 | 1,66 | 62,65 | 1,0104 | 0,4126 | |||
| LGF.A / Lions Gate Entertainment Corp. | 0,08 | 31,96 | 1,65 | 22,21 | 1,0055 | 0,2138 | |||
| CMP / Compass Minerals International, Inc. | 0,02 | −0,40 | 1,63 | 4,28 | 0,9952 | 0,0768 | |||
| ATGE / Adtalem Global Education Inc. | 0,09 | 24,84 | 1,63 | 29,02 | 0,9909 | 0,2519 | |||
| UL / Unilever PLC - Depositary Receipt (Common Stock) | 0,03 | 0,16 | 1,61 | 6,20 | 0,9812 | 0,0921 | |||
| NTRS / Northern Trust Corporation | 0,02 | −19,43 | 1,59 | −18,05 | 0,9708 | −0,1691 | |||
| WU / The Western Union Company | 0,08 | 0,70 | 1,59 | 0,13 | 0,9702 | 0,0378 | |||
| EMR / Emerson Electric Co. | 0,03 | −0,51 | 1,56 | −4,58 | 0,9520 | −0,0080 | |||
| JCI / Johnson Controls International plc | 0,03 | 1,55 | 0,9428 | 0,9428 | |||||
| MMP / Magellan Midstream Partners L.P. | 0,02 | −0,04 | 1,55 | 10,42 | 0,9422 | 0,1211 | |||
| OMI / Owens & Minor, Inc. | 0,04 | 0,15 | 1,54 | −7,41 | 0,9355 | −0,0368 | |||
| / McDermott International, Inc. | 0,31 | −7,25 | 1,53 | 12,05 | 0,9343 | 0,1320 | |||
| TWX / Warner Media LLC | 0,02 | −0,03 | 1,51 | 1,34 | 0,9215 | 0,0465 | |||
| AMGN / Amgen Inc. | 0,01 | 1,48 | 0,9014 | 0,9014 | |||||
| TEL / TE Connectivity plc | 0,03 | 1,44 | 0,8789 | 0,8789 | |||||
| UFS / Domtar Corporation | 0,04 | −7,19 | 1,42 | −19,65 | 0,8667 | −0,1712 | |||
| TGT / Target Corporation | 0,02 | 0,18 | 1,41 | −15,04 | 0,8569 | −0,1136 | |||
| TAP / Molson Coors Beverage Company | 0,01 | −0,52 | 1,40 | 4,55 | 0,8545 | 0,0680 | |||
| AGCO / AGCO Corporation | 0,03 | −16,18 | 1,37 | −20,50 | 0,8338 | −0,1754 | |||
| AYR / Aircastle Ltd. | 0,07 | −0,07 | 1,35 | −12,10 | 0,8228 | −0,0779 | |||
| ITRI / Itron, Inc. | 0,03 | −19,68 | 1,34 | −16,98 | 0,8192 | −0,1302 | |||
| WY / Weyerhaeuser Company | 0,05 | −0,10 | 1,34 | −4,00 | 0,8186 | −0,0019 | |||
| ODP / The ODP Corporation | 0,40 | 55,90 | 1,34 | −27,35 | 0,8155 | −0,2646 | |||
| RIG / Transocean Ltd. | 0,11 | 1,32 | 1,33 | 31,82 | 0,8125 | 0,2194 | |||
| X / United States Steel Corporation | 0,08 | −32,20 | 1,30 | −28,82 | 0,7912 | −0,2784 | |||
| SEP / Spectra Energy Partners LP | 0,03 | −0,01 | 1,27 | −1,93 | 0,7747 | 0,0146 | |||
| LEA / Lear Corporation | 0,01 | −9,81 | 1,27 | −17,43 | 0,7735 | −0,1279 | |||
| PH / Parker-Hannifin Corporation | 0,01 | −0,65 | 1,26 | −3,37 | 0,7686 | 0,0032 | |||
| NUAN / Nuance Communications Inc | 0,08 | −7,32 | 1,25 | −22,53 | 0,7583 | −0,1835 | |||
| CBI / Chicago Bridge & Iron Co., N.V. | 0,04 | −0,34 | 1,21 | −5,67 | 0,7394 | −0,0149 | |||
| CVX / Chevron Corporation | 0,01 | −0,59 | 1,19 | 9,25 | 0,7266 | 0,0866 | |||
| CME / CME Group Inc. | 0,01 | −30,45 | 1,14 | −29,47 | 0,6937 | −0,2528 | |||
| WERN / Werner Enterprises, Inc. | 0,05 | 2,10 | 1,14 | −13,67 | 0,6925 | −0,0794 | |||
| MSM / MSC Industrial Direct Co., Inc. | 0,02 | −0,05 | 1,12 | −7,59 | 0,6821 | −0,0282 | |||
| SCHL / Scholastic Corporation | 0,03 | −7,09 | 1,08 | −1,46 | 0,6584 | 0,0155 | |||
| BWA / BorgWarner Inc. | 0,04 | 9,12 | 1,06 | −16,11 | 0,6438 | −0,0947 | |||
| QCOM / QUALCOMM Incorporated | 0,02 | −0,43 | 1,04 | 4,31 | 0,6340 | 0,0491 | |||
| WHR / Whirlpool Corporation | 0,01 | −11,37 | 1,02 | −18,08 | 0,6237 | −0,1089 | |||
| CAH / Cardinal Health, Inc. | 0,01 | 0,99 | 0,6017 | 0,6017 | |||||
| RJF / Raymond James Financial, Inc. | 0,02 | −21,04 | 0,99 | −18,23 | 0,6011 | −0,1062 | |||
| H01531104 / Allied World Assurance Company Holding AG | 0,03 | 101,40 | 0,97 | 102,51 | 0,5896 | 0,3094 | |||
| PEP / PepsiCo, Inc. | 0,01 | 0,03 | 0,96 | 3,33 | 0,5853 | 0,0403 | |||
| SRCL / Stericycle, Inc. | 0,01 | 0,91 | 0,5567 | 0,5567 | |||||
| GGB / Gerdau S.A. - Depositary Receipt (Common Stock) | 0,50 | −7,53 | 0,91 | −5,49 | 0,5561 | −0,0101 | |||
| DCI / Donaldson Company, Inc. | 0,02 | −7,12 | 0,86 | 0,00 | 0,5220 | 0,0197 | |||
| 89376V100 / TransMontaigne Partners LP | 0,02 | −0,96 | 0,84 | 11,07 | 0,5134 | 0,0686 | |||
| IPG / The Interpublic Group of Companies, Inc. | 0,03 | −55,11 | 0,80 | −54,78 | 0,4866 | −0,5489 | |||
| US2168311072 / Cooper Tire & Rubber Co | 0,03 | 228,41 | 0,79 | 164,77 | 0,4805 | 0,3059 | |||
| KMB / Kimberly-Clark Corporation | 0,01 | −40,78 | 0,75 | −39,64 | 0,4544 | −0,2700 | |||
| NCMI / National CineMedia, Inc. | 0,05 | 0,55 | 0,73 | 2,38 | 0,4452 | 0,0268 | |||
| BMS / Bemis Co., Inc. | 0,01 | −0,31 | 0,73 | −0,82 | 0,4434 | 0,0132 | |||
| CSGS / CSG Systems International, Inc. | 0,02 | −0,10 | 0,71 | −10,84 | 0,4306 | −0,0341 | |||
| SBRA / Sabra Health Care REIT, Inc. | 0,03 | 0,57 | 0,69 | 3,29 | 0,4202 | 0,0288 | |||
| WSBC / WesBanco, Inc. | 0,02 | 0,64 | 0,3867 | 0,3867 | |||||
| BG / Bunge Global SA | 0,01 | 107,93 | 0,62 | 117,42 | 0,3800 | 0,2118 | |||
| UIS / Unisys Corporation | 0,08 | −7,17 | 0,61 | −12,18 | 0,3734 | −0,0357 | |||
| SYBT / Stock Yards Bancorp, Inc. | 0,02 | 49,30 | 0,59 | 9,41 | 0,3612 | 0,0435 | |||
| F / Ford Motor Company | 0,05 | 0,45 | 0,58 | −6,47 | 0,3520 | −0,0102 | |||
| CODI / Compass Diversified | 0,03 | 0,18 | 0,51 | 6,24 | 0,3112 | 0,0293 | |||
| NVDA / NVIDIA Corporation | 0,01 | −68,26 | 0,43 | −58,12 | 0,2637 | −0,3423 | |||
| CNA / CNA Financial Corporation | 0,01 | −0,43 | 0,42 | −2,76 | 0,2576 | 0,0027 | |||
| CINF / Cincinnati Financial Corporation | 0,01 | −46,17 | 0,42 | −38,30 | 0,2570 | −0,1438 | |||
| ATNI / ATN International, Inc. | 0,00 | 0,15 | 0,36 | 2,82 | 0,2223 | 0,0143 | |||
| UNIT / Uniti Group Inc. | 0,01 | −0,96 | 0,35 | 27,90 | 0,2150 | 0,0532 | |||
| US2782651036 / Eaton Vance Corp. | 0,01 | −68,17 | 0,32 | −66,39 | 0,1943 | −0,3619 | |||
| OC / Owens Corning | 0,00 | −100,00 | 0,00 | −100,00 | −0,1682 | ||||
| KSS / Kohl's Corporation | 0,00 | −100,00 | 0,00 | −100,00 | −0,6177 | ||||
| ADT / ADT Inc. | 0,00 | −100,00 | 0,00 | −100,00 | −1,0760 | ||||
| RCI / Rogers Communications Inc. | 0,00 | −100,00 | 0,00 | −100,00 | −0,4864 | ||||
| NUE / Nucor Corporation | 0,00 | −100,00 | 0,00 | −100,00 | −0,6623 | ||||
| RSG / Republic Services, Inc. | 0,00 | −100,00 | 0,00 | −100,00 | −0,6031 |