Grunnleggende statistikk
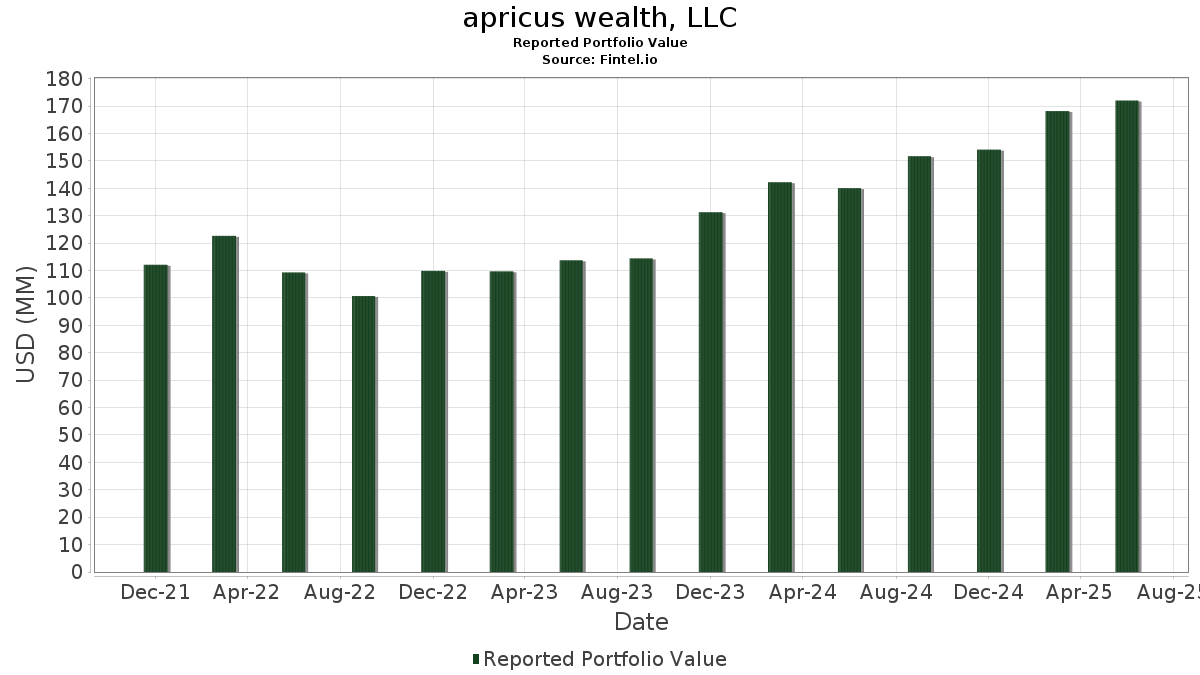
| Porteføljeverdi | $ 171 999 865 |
| Nåværende posisjoner | 116 |
Siste beholdninger, prestasjoner, forvaltet kapital (fra 13F, 13D)
apricus wealth, LLC har oppgitt 116 totale beholdninger i sine siste SEC-arkiveringer. Siste porteføljeverdi er beregnet til 171 999 865 USD. Faktisk forvaltet kapital (AUM) er denne verdien pluss kontanter (som ikke er oppgitt). apricus wealth, LLCs største beholdninger er Chevron Corporation (US:CVX) , State Street Corporation (US:STT) , Merck & Co., Inc. (US:MRK) , Bunge Global SA (US:BG) , and Citigroup Inc. (US:C) . apricus wealth, LLCs nye posisjoner inkluderer Barrick Mining Corporation (US:B) , Grayscale Bitcoin Trust (BTC) (US:GBTC) , Vanguard Whitehall Funds - Vanguard International High Dividend Yield ETF (US:VYMI) , Veru Inc. (US:VERU) , and .
De største økningene dette kvartalet
Vi bruker endringen i porteføljeallokeringen fordi dette er det mest meningsfulle målet. Endringer kan skyldes handler eller endringer i aksjekursene.
| Verdipapirer | Aksjer (MM) |
Verdi (MM$) |
Portefølje % | ΔPortefølje % |
|---|---|---|---|---|
| 0,11 | 2,25 | 1,3070 | 1,3070 | |
| 0,06 | 4,66 | 2,7122 | 1,1089 | |
| 0,02 | 2,98 | 1,7337 | 0,4797 | |
| 0,04 | 4,67 | 2,7157 | 0,4541 | |
| 0,07 | 3,45 | 2,0071 | 0,4311 | |
| 0,05 | 4,12 | 2,3947 | 0,3552 | |
| 0,00 | 2,34 | 1,3632 | 0,3110 | |
| 0,01 | 1,36 | 0,7926 | 0,2907 | |
| 0,00 | 1,38 | 0,8026 | 0,2898 | |
| 0,05 | 4,37 | 2,5434 | 0,2639 |
De største reduksjonene dette kvartalet
Vi bruker endringen i porteføljeallokeringen fordi dette er det mest meningsfulle målet. Endringer kan skyldes handler eller endringer i aksjekurser.
| Verdipapirer | Aksjer (MM) |
Verdi (MM$) |
Portefølje % | ΔPortefølje % |
|---|---|---|---|---|
| 0,00 | 0,23 | 0,1354 | −0,7896 | |
| 0,09 | 2,93 | 1,7058 | −0,5627 | |
| 0,03 | 4,70 | 2,7340 | −0,4991 | |
| 0,45 | 2,76 | 1,6055 | −0,4370 | |
| 0,03 | 2,81 | 1,6329 | −0,3585 | |
| 0,03 | 1,91 | 1,1093 | −0,3395 | |
| 0,11 | 2,83 | 1,6478 | −0,3032 | |
| 0,01 | 2,98 | 1,7352 | −0,2978 | |
| 0,02 | 3,82 | 2,2198 | −0,2695 | |
| 0,02 | 2,12 | 1,2353 | −0,2629 |
13F- og Fondsarkiveringer
Dette skjemaet ble sendt inn den 2025-07-30 for rapporteringsperioden 2025-06-30. Klikk på lenkeikonet for å se hele transaksjonshistorikken.
Oppgradere for å låse opp premiedata og eksportere til Excel![]() .
.
| Verdipapirer | Type | Gjennomsnittlig aksjekurs | Aksjer (MM) |
ΔAksjer (%) |
ΔAksjer (%) |
Verdi ($MM) |
Portefølje (%) |
ΔPortefølje (%) |
|
|---|---|---|---|---|---|---|---|---|---|
| CVX / Chevron Corporation | 0,03 | 1,05 | 4,70 | −13,52 | 2,7340 | −0,4991 | |||
| STT / State Street Corporation | 0,04 | 3,40 | 4,67 | 22,80 | 2,7157 | 0,4541 | |||
| MRK / Merck & Co., Inc. | 0,06 | 96,19 | 4,66 | 73,00 | 2,7122 | 1,1089 | |||
| BG / Bunge Global SA | 0,05 | 8,63 | 4,37 | 14,11 | 2,5434 | 0,2639 | |||
| C / Citigroup Inc. | 0,05 | 0,16 | 4,12 | 20,09 | 2,3947 | 0,3552 | |||
| JPM / JPMorgan Chase & Co. | 0,01 | −3,76 | 4,09 | 13,72 | 2,3761 | 0,2396 | |||
| EXE / Expand Energy Corporation | 0,03 | −1,88 | 4,06 | 3,09 | 2,3629 | 0,0183 | |||
| KT / KT Corporation - Depositary Receipt (Common Stock) | 0,19 | −2,42 | 3,92 | 14,50 | 2,2815 | 0,2434 | |||
| BAC / Bank of America Corporation | 0,08 | −6,18 | 3,87 | 6,38 | 2,2502 | 0,0869 | |||
| ABBV / AbbVie Inc. | 0,02 | 2,95 | 3,82 | −8,79 | 2,2198 | −0,2695 | |||
| AMGN / Amgen Inc. | 0,01 | 2,77 | 3,81 | −7,89 | 2,2123 | −0,2445 | |||
| CSCO / Cisco Systems, Inc. | 0,05 | −1,29 | 3,73 | 10,98 | 2,1691 | 0,1701 | |||
| KR / The Kroger Co. | 0,05 | −0,42 | 3,69 | 5,54 | 2,1479 | 0,0661 | |||
| UL / Unilever PLC - Depositary Receipt (Common Stock) | 0,06 | −2,15 | 3,52 | 0,51 | 2,0440 | −0,0359 | |||
| ADM / Archer-Daniels-Midland Company | 0,07 | 18,49 | 3,45 | 30,26 | 2,0071 | 0,4311 | |||
| ABNB / Airbnb, Inc. | 0,03 | 0,00 | 3,42 | 10,78 | 1,9900 | 0,1528 | |||
| TSN / Tyson Foods, Inc. | 0,06 | 3,01 | 3,28 | −9,69 | 1,9067 | −0,2527 | |||
| CB / Chubb Limited | 0,01 | 2,39 | 3,10 | −1,74 | 1,8013 | −0,0742 | |||
| NEM / Newmont Corporation | 0,05 | −2,79 | 3,03 | 17,31 | 1,7612 | 0,2255 | |||
| JNJ / Johnson & Johnson | 0,02 | −1,05 | 3,02 | −8,84 | 1,7571 | −0,2147 | |||
| AAPL / Apple Inc. | 0,01 | −5,49 | 2,98 | −12,70 | 1,7352 | −0,2978 | |||
| NUE / Nucor Corporation | 0,02 | 31,36 | 2,98 | 41,46 | 1,7337 | 0,4797 | |||
| SO / The Southern Company | 0,03 | −0,22 | 2,94 | −0,34 | 1,7077 | −0,0450 | |||
| SLB / Schlumberger Limited | 0,09 | −4,89 | 2,93 | −23,07 | 1,7058 | −0,5627 | |||
| KMI / Kinder Morgan, Inc. | 0,10 | −4,33 | 2,89 | −1,40 | 1,6808 | −0,0630 | |||
| UNM / Unum Group | 0,04 | 1,40 | 2,89 | 0,52 | 1,6807 | −0,0292 | |||
| NVS / Novartis AG - Depositary Receipt (Common Stock) | 0,02 | 1,97 | 2,88 | 10,70 | 1,6722 | 0,1271 | |||
| CTRA / Coterra Energy Inc. | 0,11 | −1,64 | 2,83 | −13,62 | 1,6478 | −0,3032 | |||
| TM / Toyota Motor Corporation - Depositary Receipt (Common Stock) | 0,02 | 12,81 | 2,82 | 10,07 | 1,6404 | 0,1163 | |||
| SJM / The J. M. Smucker Company | 0,03 | 1,12 | 2,81 | −16,13 | 1,6329 | −0,3585 | |||
| WEC / WEC Energy Group, Inc. | 0,03 | 6,76 | 2,80 | 2,08 | 1,6266 | −0,0032 | |||
| MDXG / MiMedx Group, Inc. | 0,45 | 0,00 | 2,76 | −19,60 | 1,6055 | −0,4370 | |||
| TRP / TC Energy Corporation | 0,06 | 1,70 | 2,73 | 5,13 | 1,5855 | 0,0426 | |||
| PFE / Pfizer Inc. | 0,11 | −3,21 | 2,60 | −7,41 | 1,5113 | −0,1581 | |||
| DUK / Duke Energy Corporation | 0,02 | 5,13 | 2,56 | 1,71 | 1,4895 | −0,0083 | |||
| CVS / CVS Health Corporation | 0,04 | 0,37 | 2,52 | 2,19 | 1,4638 | −0,0012 | |||
| PNC / The PNC Financial Services Group, Inc. | 0,01 | 1,31 | 2,49 | 7,46 | 1,4491 | 0,0697 | |||
| MSFT / Microsoft Corporation | 0,00 | 0,00 | 2,34 | 32,50 | 1,3632 | 0,3110 | |||
| SHEL / Shell plc - Depositary Receipt (Common Stock) | 0,03 | 8,15 | 2,30 | 3,93 | 1,3388 | 0,0211 | |||
| B / Barrick Mining Corporation | 0,11 | 2,25 | 1,3070 | 1,3070 | |||||
| CMCSA / Comcast Corporation | 0,06 | 21,38 | 2,14 | 17,38 | 1,2453 | 0,1604 | |||
| COP / ConocoPhillips | 0,02 | −1,31 | 2,12 | −15,68 | 1,2353 | −0,2629 | |||
| VZ / Verizon Communications Inc. | 0,05 | 0,42 | 2,10 | −4,20 | 1,2187 | −0,0824 | |||
| SOBO / South Bow Corporation | 0,07 | 2,26 | 1,94 | 3,80 | 1,1282 | 0,0168 | |||
| LYB / LyondellBasell Industries N.V. | 0,03 | −4,72 | 1,91 | −21,72 | 1,1093 | −0,3395 | |||
| CEG / Constellation Energy Corporation | 0,00 | 0,00 | 1,38 | 60,09 | 0,8026 | 0,2898 | |||
| PLTR / Palantir Technologies Inc. | 0,01 | 0,00 | 1,36 | 61,49 | 0,7926 | 0,2907 | |||
| GOOG / Alphabet Inc. | 0,01 | 0,00 | 1,24 | 13,50 | 0,7238 | 0,0718 | |||
| T / AT&T Inc. | 0,04 | −1,58 | 1,04 | 0,68 | 0,6022 | −0,0093 | |||
| EBGEF / Enbridge Inc. - Preferred Stock | 0,02 | 11,69 | 1,02 | 14,24 | 0,5927 | 0,0621 | |||
| BRK.B / Berkshire Hathaway Inc. | 0,00 | −4,69 | 0,99 | −13,05 | 0,5736 | −0,1013 | |||
| WTRG / Essential Utilities, Inc. | 0,03 | 0,00 | 0,98 | −6,07 | 0,5671 | −0,0502 | |||
| KMB / Kimberly-Clark Corporation | 0,01 | −1,32 | 0,97 | −10,56 | 0,5617 | −0,0805 | |||
| XOM / Exxon Mobil Corporation | 0,01 | 0,04 | 0,92 | −9,28 | 0,5344 | −0,0684 | |||
| HON / Honeywell International Inc. | 0,00 | 0,27 | 0,85 | 10,22 | 0,4958 | 0,0360 | |||
| SYK / Stryker Corporation | 0,00 | 0,00 | 0,85 | 6,37 | 0,4955 | 0,0187 | |||
| HESM / Hess Midstream LP | 0,02 | 0,00 | 0,76 | −8,98 | 0,4422 | −0,0545 | |||
| AMZN / Amazon.com, Inc. | 0,00 | 0,00 | 0,75 | 15,31 | 0,4379 | 0,0495 | |||
| ABT / Abbott Laboratories | 0,01 | 0,02 | 0,74 | 2,48 | 0,4329 | 0,0011 | |||
| VTV / Vanguard Index Funds - Vanguard Value ETF | 0,00 | 11,72 | 0,72 | 14,22 | 0,4162 | 0,0438 | |||
| PRU / Prudential Financial, Inc. | 0,01 | −1,93 | 0,55 | −5,71 | 0,3171 | −0,0267 | |||
| PEP / PepsiCo, Inc. | 0,00 | 12,35 | 0,54 | −1,10 | 0,3143 | −0,0106 | |||
| CAT / Caterpillar Inc. | 0,00 | 0,00 | 0,54 | 17,69 | 0,3135 | 0,0411 | |||
| KO / The Coca-Cola Company | 0,01 | −0,44 | 0,50 | −1,59 | 0,2884 | −0,0115 | |||
| MA / Mastercard Incorporated | 0,00 | −1,69 | 0,49 | 0,82 | 0,2855 | −0,0042 | |||
| PHYS / Sprott Physical Gold Trust | 0,02 | −17,39 | 0,48 | −13,02 | 0,2800 | −0,0490 | |||
| VGT / Vanguard World Fund - Vanguard Information Technology ETF | 0,00 | 0,00 | 0,46 | 22,43 | 0,2699 | 0,0442 | |||
| GOOGL / Alphabet Inc. | 0,00 | 0,00 | 0,45 | 13,82 | 0,2638 | 0,0270 | |||
| UPS / United Parcel Service, Inc. | 0,00 | −3,29 | 0,44 | −11,20 | 0,2585 | −0,0394 | |||
| NSC / Norfolk Southern Corporation | 0,00 | 0,00 | 0,43 | 8,06 | 0,2497 | 0,0134 | |||
| CI / The Cigna Group | 0,00 | 0,00 | 0,41 | 0,49 | 0,2393 | −0,0043 | |||
| BMI / Badger Meter, Inc. | 0,00 | 0,00 | 0,41 | 28,98 | 0,2356 | 0,0484 | |||
| CBOE / Cboe Global Markets, Inc. | 0,00 | 0,00 | 0,40 | 3,10 | 0,2323 | 0,0018 | |||
| AME / AMETEK, Inc. | 0,00 | 0,00 | 0,37 | 5,10 | 0,2162 | 0,0059 | |||
| STE / STERIS plc | 0,00 | −7,63 | 0,36 | −2,16 | 0,2112 | −0,0095 | |||
| CACI / CACI International Inc | 0,00 | 0,00 | 0,36 | 29,82 | 0,2079 | 0,0442 | |||
| FDX / FedEx Corporation | 0,00 | −8,82 | 0,35 | −14,98 | 0,2048 | −0,0416 | |||
| GJR / Strats Trust For Procter & Gambel Security - Preferred Security | 0,00 | −0,76 | 0,35 | −7,39 | 0,2046 | −0,0210 | |||
| AEP / American Electric Power Company, Inc. | 0,00 | −1,51 | 0,34 | −6,37 | 0,1968 | −0,0184 | |||
| TMO / Thermo Fisher Scientific Inc. | 0,00 | 0,00 | 0,33 | −18,54 | 0,1942 | −0,0496 | |||
| HUBB / Hubbell Incorporated | 0,00 | 0,00 | 0,33 | 23,48 | 0,1900 | 0,0325 | |||
| SXI / Standex International Corporation | 0,00 | −8,88 | 0,32 | −11,85 | 0,1866 | −0,0294 | |||
| GLW / Corning Incorporated | 0,01 | 0,00 | 0,32 | 14,55 | 0,1837 | 0,0201 | |||
| GDXJ / VanEck ETF Trust - VanEck Junior Gold Miners ETF | 0,00 | −36,23 | 0,30 | −24,62 | 0,1729 | −0,0618 | |||
| IJJ / iShares Trust - iShares S&P Mid-Cap 400 Value ETF | 0,00 | 0,00 | 0,29 | 3,23 | 0,1677 | 0,0015 | |||
| JCI / Johnson Controls International plc | 0,00 | −0,73 | 0,29 | 30,73 | 0,1662 | 0,0363 | |||
| AXP / American Express Company | 0,00 | 0,00 | 0,27 | 18,94 | 0,1571 | 0,0216 | |||
| PAYX / Paychex, Inc. | 0,00 | −6,52 | 0,26 | −11,86 | 0,1516 | −0,0243 | |||
| IEMG / iShares, Inc. - iShares Core MSCI Emerging Markets ETF | 0,00 | 0,00 | 0,26 | 11,16 | 0,1509 | 0,0121 | |||
| AFL / Aflac Incorporated | 0,00 | −3,94 | 0,26 | −8,87 | 0,1495 | −0,0183 | |||
| SCHD / Schwab Strategic Trust - Schwab U.S. Dividend Equity ETF | 0,01 | 0,93 | 0,26 | −4,49 | 0,1488 | −0,0103 | |||
| CTVA / Corteva, Inc. | 0,00 | 0,00 | 0,25 | 18,84 | 0,1431 | 0,0195 | |||
| MASI / Masimo Corporation | 0,00 | 0,00 | 0,25 | 0,82 | 0,1430 | −0,0018 | |||
| ADI / Analog Devices, Inc. | 0,00 | −25,31 | 0,25 | −11,87 | 0,1429 | −0,0229 | |||
| DELL / Dell Technologies Inc. | 0,00 | 0,25 | 0,1426 | 0,1426 | |||||
| GSCE / GS Connect S&P GSCI Enhanced Commodity Total Return ETN | 0,00 | −24,44 | 0,24 | −2,04 | 0,1399 | −0,0063 | |||
| TJX / The TJX Companies, Inc. | 0,00 | −3,94 | 0,24 | −2,83 | 0,1399 | −0,0070 | |||
| DGRW / WisdomTree Trust - WisdomTree U.S. Quality Dividend Growth Fund | 0,00 | 0,00 | 0,24 | 4,85 | 0,1388 | 0,0034 | |||
| DRI / Darden Restaurants, Inc. | 0,00 | −8,44 | 0,24 | −4,07 | 0,1375 | −0,0089 | |||
| IBM / International Business Machines Corporation | 0,00 | −87,37 | 0,23 | −85,08 | 0,1354 | −0,7896 | |||
| EOG / EOG Resources, Inc. | 0,00 | −5,22 | 0,23 | −11,63 | 0,1326 | −0,0208 | |||
| PSX / Phillips 66 | 0,00 | 0,23 | 0,1318 | 0,1318 | |||||
| OKE / ONEOK, Inc. | 0,00 | 0,00 | 0,22 | −17,60 | 0,1281 | −0,0312 | |||
| NEE / NextEra Energy, Inc. | 0,00 | 0,00 | 0,22 | −2,24 | 0,1272 | −0,0057 | |||
| NDSN / Nordson Corporation | 0,00 | −2,39 | 0,22 | 3,81 | 0,1271 | 0,0018 | |||
| MMSI / Merit Medical Systems, Inc. | 0,00 | −7,75 | 0,22 | −18,56 | 0,1255 | −0,0319 | |||
| SYY / Sysco Corporation | 0,00 | −2,58 | 0,21 | −1,38 | 0,1245 | −0,0050 | |||
| GBTC / Grayscale Bitcoin Trust (BTC) | 0,00 | 0,21 | 0,1233 | 0,1233 | |||||
| ABM / ABM Industries Incorporated | 0,00 | −5,45 | 0,20 | −5,99 | 0,1191 | −0,0101 | |||
| BRC / Brady Corporation | 0,00 | −3,24 | 0,20 | −6,91 | 0,1180 | −0,0116 | |||
| VYMI / Vanguard Whitehall Funds - Vanguard International High Dividend Yield ETF | 0,00 | 0,20 | 0,1164 | 0,1164 | |||||
| MUFG / Mitsubishi UFJ Financial Group, Inc. - Depositary Receipt (Common Stock) | 0,01 | 0,00 | 0,14 | 0,74 | 0,0798 | −0,0013 | |||
| MQ / Marqeta, Inc. | 0,02 | 0,00 | 0,10 | 40,54 | 0,0610 | 0,0169 | |||
| RLMD / Relmada Therapeutics, Inc. | 0,05 | −3,06 | 0,03 | 115,38 | 0,0166 | 0,0087 | |||
| VERU / Veru Inc. | 0,04 | 0,02 | 0,0135 | 0,0135 | |||||
| CHPT / ChargePoint Holdings, Inc. | 0,03 | 0,00 | 0,02 | 18,75 | 0,0112 | 0,0014 | |||
| UFPI / UFP Industries, Inc. | 0,00 | −100,00 | 0,00 | 0,0000 | |||||
| GOLD / Barrick Mining Corporation | 0,00 | −100,00 | 0,00 | 0,0000 | |||||
| BDX / Becton, Dickinson and Company | 0,00 | −100,00 | 0,00 | 0,0000 | |||||
| EPD / Enterprise Products Partners L.P. - Limited Partnership | 0,00 | −100,00 | 0,00 | 0,0000 | |||||
| CL / Colgate-Palmolive Company | 0,00 | −100,00 | 0,00 | 0,0000 | |||||
| LOW / Lowe's Companies, Inc. | 0,00 | −100,00 | 0,00 | 0,0000 | |||||
| EXC / Exelon Corporation | 0,00 | −100,00 | 0,00 | 0,0000 |