Grunnleggende statistikk
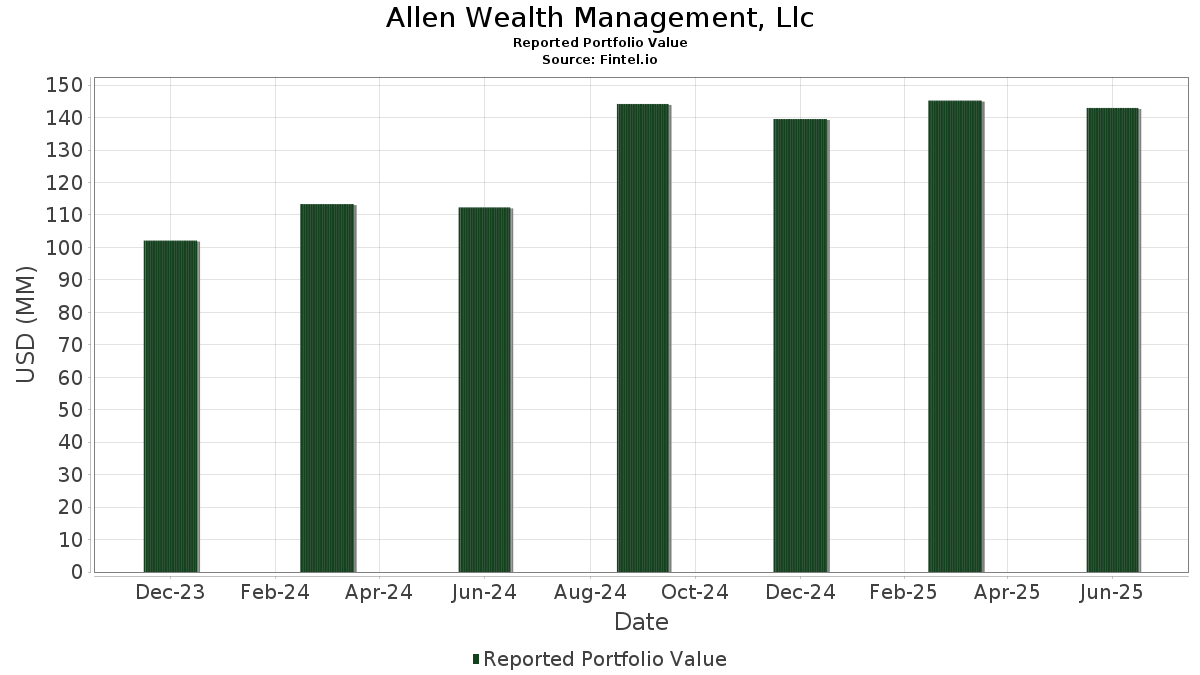
| Porteføljeverdi | $ 142 969 790 |
| Nåværende posisjoner | 59 |
Siste beholdninger, prestasjoner, forvaltet kapital (fra 13F, 13D)
Allen Wealth Management, Llc har oppgitt 59 totale beholdninger i sine siste SEC-arkiveringer. Siste porteføljeverdi er beregnet til 142 969 790 USD. Faktisk forvaltet kapital (AUM) er denne verdien pluss kontanter (som ikke er oppgitt). Allen Wealth Management, Llcs største beholdninger er Vanguard Index Funds - Vanguard Value ETF (US:VTV) , Schwab Strategic Trust - Schwab Fundamental U.S. Large Company ETF (US:FNDX) , ALPS ETF Trust - Alerian MLP ETF (US:AMLP) , Vanguard World Fund - Vanguard Energy ETF (US:VDE) , and Exxon Mobil Corporation (US:XOM) . Allen Wealth Management, Llcs nye posisjoner inkluderer Netflix, Inc. (US:NFLX) , .
De største økningene dette kvartalet
Vi bruker endringen i porteføljeallokeringen fordi dette er det mest meningsfulle målet. Endringer kan skyldes handler eller endringer i aksjekursene.
| Verdipapirer | Aksjer (MM) |
Verdi (MM$) |
Portefølje % | ΔPortefølje % |
|---|---|---|---|---|
| 0,16 | 27,53 | 19,2542 | 0,7960 | |
| 0,96 | 23,45 | 16,4013 | 0,7404 | |
| 0,01 | 2,43 | 1,6971 | 0,4545 | |
| 0,03 | 2,62 | 1,8348 | 0,2673 | |
| 0,03 | 1,81 | 1,2649 | 0,2021 | |
| 0,00 | 0,27 | 0,1892 | 0,1892 | |
| 0,04 | 1,32 | 0,9203 | 0,1567 | |
| 0,00 | 0,93 | 0,6520 | 0,1485 | |
| 0,01 | 3,08 | 2,1562 | 0,1302 | |
| 0,05 | 3,48 | 2,4370 | 0,1238 |
De største reduksjonene dette kvartalet
Vi bruker endringen i porteføljeallokeringen fordi dette er det mest meningsfulle målet. Endringer kan skyldes handler eller endringer i aksjekurser.
| Verdipapirer | Aksjer (MM) |
Verdi (MM$) |
Portefølje % | ΔPortefølje % |
|---|---|---|---|---|
| 0,09 | 11,14 | 7,7944 | −0,5100 | |
| 0,03 | 3,96 | 2,7664 | −0,4387 | |
| 0,02 | 0,55 | 0,3826 | −0,4290 | |
| 0,05 | 5,81 | 4,0634 | −0,4285 | |
| 0,32 | 15,70 | 10,9809 | −0,3432 | |
| 0,08 | 1,75 | 1,2234 | −0,1577 | |
| 0,02 | 1,87 | 1,3084 | −0,1523 | |
| 0,01 | 2,23 | 1,5580 | −0,1373 | |
| 0,01 | 0,90 | 0,6269 | −0,1284 | |
| 0,02 | 1,26 | 0,8842 | −0,0950 |
13F- og Fondsarkiveringer
Dette skjemaet ble sendt inn den 2025-07-24 for rapporteringsperioden 2025-06-30. Klikk på lenkeikonet for å se hele transaksjonshistorikken.
Oppgradere for å låse opp premiedata og eksportere til Excel![]() .
.
| Verdipapirer | Type | Gjennomsnittlig aksjekurs | Aksjer (MM) |
ΔAksjer (%) |
ΔAksjer (%) |
Verdi ($MM) |
Portefølje (%) |
ΔPortefølje (%) |
|
|---|---|---|---|---|---|---|---|---|---|
| VTV / Vanguard Index Funds - Vanguard Value ETF | 0,16 | 0,36 | 27,53 | 2,68 | 19,2542 | 0,7960 | |||
| FNDX / Schwab Strategic Trust - Schwab Fundamental U.S. Large Company ETF | 0,96 | −0,81 | 23,45 | 3,09 | 16,4013 | 0,7404 | |||
| AMLP / ALPS ETF Trust - Alerian MLP ETF | 0,32 | 1,47 | 15,70 | −4,54 | 10,9809 | −0,3432 | |||
| VDE / Vanguard World Fund - Vanguard Energy ETF | 0,09 | 0,61 | 11,14 | −7,61 | 7,7944 | −0,5100 | |||
| XOM / Exxon Mobil Corporation | 0,05 | −1,76 | 5,81 | −10,95 | 4,0634 | −0,4285 | |||
| CVX / Chevron Corporation | 0,03 | −0,73 | 3,96 | −15,02 | 2,7664 | −0,4387 | |||
| CSCO / Cisco Systems, Inc. | 0,05 | −7,76 | 3,48 | 3,72 | 2,4370 | 0,1238 | |||
| LMT / Lockheed Martin Corporation | 0,01 | 1,05 | 3,08 | 4,76 | 2,1562 | 0,1302 | |||
| C / Citigroup Inc. | 0,03 | −3,90 | 2,62 | 15,25 | 1,8348 | 0,2673 | |||
| TSM / Taiwan Semiconductor Manufacturing Company Limited - Depositary Receipt (Common Stock) | 0,01 | −1,46 | 2,43 | 34,48 | 1,6971 | 0,4545 | |||
| AAPL / Apple Inc. | 0,01 | −2,06 | 2,23 | −9,55 | 1,5580 | −0,1373 | |||
| PFE / Pfizer Inc. | 0,09 | −1,22 | 2,22 | −5,50 | 1,5494 | −0,0648 | |||
| BK / The Bank of New York Mellon Corporation | 0,02 | −1,59 | 2,13 | 6,92 | 1,4909 | 0,1181 | |||
| LNC / Lincoln National Corporation | 0,06 | 0,85 | 2,06 | −2,83 | 1,4422 | −0,0188 | |||
| MDT / Medtronic plc | 0,02 | 1,69 | 1,89 | −1,36 | 1,3208 | 0,0027 | |||
| PSA / Public Storage | 0,01 | 0,79 | 1,88 | −1,21 | 1,3174 | 0,0049 | |||
| MRK / Merck & Co., Inc. | 0,02 | −0,02 | 1,87 | −11,83 | 1,3084 | −0,1523 | |||
| NTR / Nutrien Ltd. | 0,03 | −0,09 | 1,81 | 17,17 | 1,2649 | 0,2021 | |||
| KVUE / Kenvue Inc. | 0,08 | −0,09 | 1,75 | −12,77 | 1,2234 | −0,1577 | |||
| HMC / Honda Motor Co., Ltd. - Depositary Receipt (Common Stock) | 0,06 | −0,66 | 1,66 | 5,59 | 1,1634 | 0,0785 | |||
| RIO / Rio Tinto Group - Depositary Receipt (Common Stock) | 0,03 | 3,20 | 1,58 | 0,19 | 1,1031 | 0,0193 | |||
| CAT / Caterpillar Inc. | 0,00 | −8,20 | 1,43 | 8,09 | 0,9995 | 0,0889 | |||
| DUK / Duke Energy Corporation | 0,01 | −1,37 | 1,32 | −4,64 | 0,9204 | −0,0291 | |||
| IRDM / Iridium Communications Inc. | 0,04 | 7,44 | 1,32 | 18,68 | 0,9203 | 0,1567 | |||
| SWK / Stanley Black & Decker, Inc. | 0,02 | 0,86 | 1,26 | −11,11 | 0,8842 | −0,0950 | |||
| KO / The Coca-Cola Company | 0,02 | 0,42 | 1,20 | −0,75 | 0,8367 | 0,0064 | |||
| UL / Unilever PLC - Depositary Receipt (Common Stock) | 0,02 | 0,01 | 1,18 | 2,69 | 0,8279 | 0,0346 | |||
| V / Visa Inc. | 0,00 | −8,26 | 1,02 | −7,04 | 0,7117 | −0,0421 | |||
| MSFT / Microsoft Corporation | 0,00 | −3,80 | 0,93 | 27,50 | 0,6520 | 0,1485 | |||
| EPD / Enterprise Products Partners L.P. - Limited Partnership | 0,03 | −2,32 | 0,92 | −11,34 | 0,6462 | −0,0707 | |||
| SBUX / Starbucks Corporation | 0,01 | −12,54 | 0,90 | −18,25 | 0,6269 | −0,1284 | |||
| JPM / JPMorgan Chase & Co. | 0,00 | −3,21 | 0,87 | 14,40 | 0,6116 | 0,0853 | |||
| AMGN / Amgen Inc. | 0,00 | −0,72 | 0,76 | −11,06 | 0,5349 | −0,0569 | |||
| GJR / Strats Trust For Procter & Gambel Security - Preferred Security | 0,00 | 0,00 | 0,74 | −6,46 | 0,5170 | −0,0274 | |||
| WMT / Walmart Inc. | 0,01 | −3,81 | 0,64 | 7,24 | 0,4458 | 0,0362 | |||
| FDX / FedEx Corporation | 0,00 | −3,95 | 0,55 | −10,39 | 0,3863 | −0,0383 | |||
| NVS / Novartis AG - Depositary Receipt (Common Stock) | 0,00 | −15,43 | 0,55 | −8,35 | 0,3847 | −0,0278 | |||
| DOW / Dow Inc. | 0,02 | −38,80 | 0,55 | −53,65 | 0,3826 | −0,4290 | |||
| NOC / Northrop Grumman Corporation | 0,00 | −5,06 | 0,47 | −7,33 | 0,3280 | −0,0203 | |||
| JNJ / Johnson & Johnson | 0,00 | −3,16 | 0,47 | −10,88 | 0,3269 | −0,0339 | |||
| AMZN / Amazon.com, Inc. | 0,00 | −5,07 | 0,45 | 9,47 | 0,3158 | 0,0318 | |||
| BAC / Bank of America Corporation | 0,01 | −2,70 | 0,41 | 10,24 | 0,2867 | 0,0309 | |||
| WM / Waste Management, Inc. | 0,00 | 0,00 | 0,37 | −1,06 | 0,2602 | 0,0011 | |||
| ADP / Automatic Data Processing, Inc. | 0,00 | 12,98 | 0,35 | 13,96 | 0,2458 | 0,0336 | |||
| MET / MetLife, Inc. | 0,00 | −10,29 | 0,35 | −10,08 | 0,2436 | −0,0234 | |||
| GD / General Dynamics Corporation | 0,00 | 0,00 | 0,33 | 6,91 | 0,2279 | 0,0182 | |||
| MCD / McDonald's Corporation | 0,00 | 0,00 | 0,31 | −6,73 | 0,2140 | −0,0112 | |||
| ALL / The Allstate Corporation | 0,00 | 0,00 | 0,29 | −2,67 | 0,2043 | −0,0026 | |||
| GLD / SPDR Gold Trust | 0,00 | 9,33 | 0,29 | 15,85 | 0,1998 | 0,0298 | |||
| VZ / Verizon Communications Inc. | 0,01 | 10,46 | 0,27 | 5,38 | 0,1918 | 0,0126 | |||
| NFLX / Netflix, Inc. | 0,00 | 0,27 | 0,1892 | 0,1892 | |||||
| PM / Philip Morris International Inc. | 0,00 | 0,00 | 0,27 | 14,89 | 0,1890 | 0,0269 | |||
| ABBV / AbbVie Inc. | 0,00 | −3,47 | 0,26 | −14,62 | 0,1803 | −0,0273 | |||
| NEM / Newmont Corporation | 0,00 | −4,01 | 0,25 | 15,74 | 0,1754 | 0,0263 | |||
| LOW / Lowe's Companies, Inc. | 0,00 | −8,33 | 0,24 | −12,86 | 0,1709 | −0,0220 | |||
| GOOG / Alphabet Inc. | 0,00 | 0,00 | 0,24 | 13,27 | 0,1677 | 0,0223 | |||
| TROW / T. Rowe Price Group, Inc. | 0,00 | 2,06 | 0,24 | 7,66 | 0,1672 | 0,0137 | |||
| BRK.B / Berkshire Hathaway Inc. | 0,00 | 0,00 | 0,23 | −8,87 | 0,1583 | −0,0125 | |||
| NVO / Novo Nordisk A/S - Depositary Receipt (Common Stock) | 0,00 | −11,40 | 0,20 | −11,84 | 0,1407 | −0,0166 | |||
| ENR / Energizer Holdings, Inc. | 0,00 | −100,00 | 0,00 | 0,0000 | |||||
| PEP / PepsiCo, Inc. | 0,00 | −100,00 | 0,00 | 0,0000 | |||||
| CVS / CVS Health Corporation | 0,00 | −100,00 | 0,00 | 0,0000 |