Grunnleggende statistikk
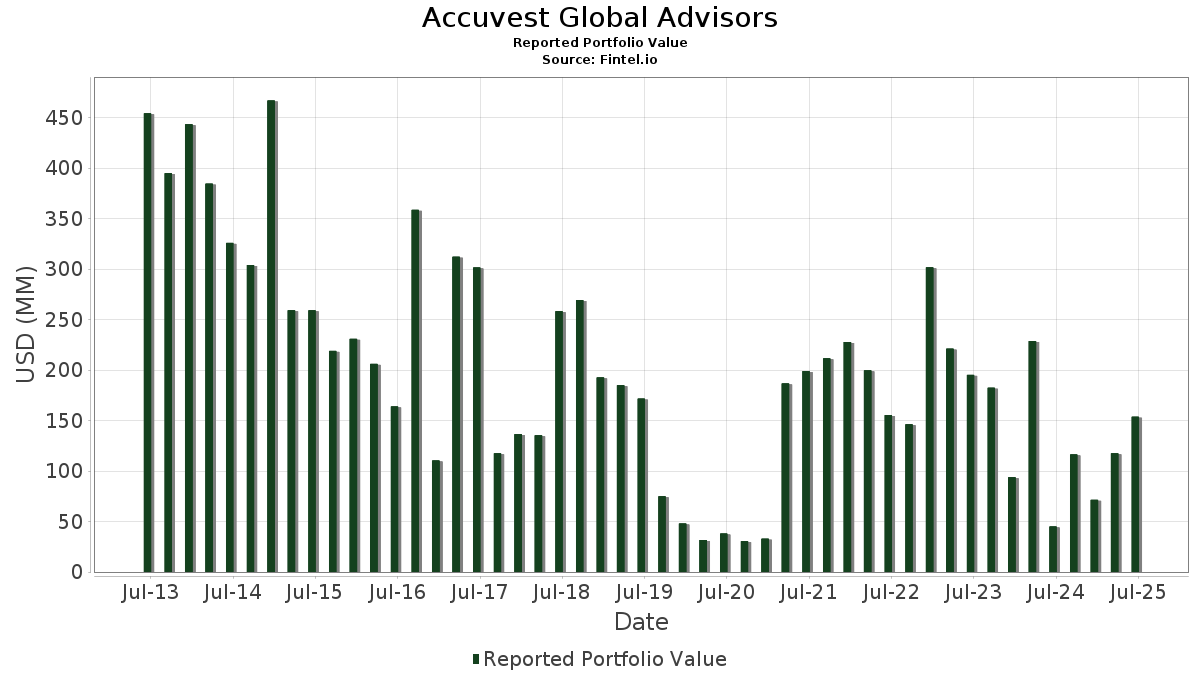
| Porteføljeverdi | $ 153 715 000 |
| Nåværende posisjoner | 78 |
Siste beholdninger, prestasjoner, forvaltet kapital (fra 13F, 13D)
Accuvest Global Advisors har oppgitt 78 totale beholdninger i sine siste SEC-arkiveringer. Siste porteføljeverdi er beregnet til 153 715 000 USD. Faktisk forvaltet kapital (AUM) er denne verdien pluss kontanter (som ikke er oppgitt). Accuvest Global Advisorss største beholdninger er Strategy Inc (US:MSTR) , Amazon.com, Inc. (US:AMZN) , Microsoft Corporation (US:MSFT) , Costco Wholesale Corporation (US:COST) , and Meta Platforms, Inc. (US:META) . Accuvest Global Advisorss nye posisjoner inkluderer Brookfield Corporation (US:BN) , Semler Scientific, Inc. (US:SMLR) , SAP SE - Depositary Receipt (Common Stock) (US:SAP) , Colgate-Palmolive Company (US:CL) , and Novo Nordisk A/S - Depositary Receipt (Common Stock) (US:NVO) .
De største økningene dette kvartalet
Vi bruker endringen i porteføljeallokeringen fordi dette er det mest meningsfulle målet. Endringer kan skyldes handler eller endringer i aksjekursene.
| Verdipapirer | Aksjer (MM) |
Verdi (MM$) |
Portefølje % | ΔPortefølje % |
|---|---|---|---|---|
| 0,01 | 2,98 | 1,9419 | 1,9419 | |
| 0,00 | 2,96 | 1,9269 | 1,9269 | |
| 0,01 | 4,50 | 2,9255 | 1,7799 | |
| 0,01 | 2,64 | 1,7201 | 1,7201 | |
| 0,01 | 3,96 | 2,5775 | 1,3382 | |
| 0,03 | 1,96 | 1,2731 | 1,2731 | |
| 0,04 | 3,34 | 2,1722 | 1,1772 | |
| 0,06 | 4,05 | 2,6328 | 1,1577 | |
| 0,01 | 6,25 | 4,0679 | 1,0573 | |
| 0,00 | 1,62 | 1,0539 | 1,0539 |
De største reduksjonene dette kvartalet
Vi bruker endringen i porteføljeallokeringen fordi dette er det mest meningsfulle målet. Endringer kan skyldes handler eller endringer i aksjekurser.
| Verdipapirer | Aksjer (MM) |
Verdi (MM$) |
Portefølje % | ΔPortefølje % |
|---|---|---|---|---|
| 0,03 | 7,08 | 4,6079 | −4,5755 | |
| 0,01 | 1,19 | 0,7716 | −2,3242 | |
| 0,07 | 29,02 | 18,8804 | −1,9327 | |
| 0,00 | 0,21 | 0,1379 | −0,8520 | |
| 0,00 | 0,23 | 0,1490 | −0,7269 | |
| 0,02 | 4,41 | 2,8676 | −0,6869 | |
| 0,00 | 1,42 | 0,9264 | −0,6806 | |
| 0,00 | 0,76 | 0,4951 | −0,5374 | |
| 0,01 | 5,34 | 3,4759 | −0,4880 | |
| 0,03 | 4,30 | 2,7974 | −0,4431 |
13F- og Fondsarkiveringer
Dette skjemaet ble sendt inn den 2025-08-05 for rapporteringsperioden 2025-06-30. Klikk på lenkeikonet for å se hele transaksjonshistorikken.
Oppgradere for å låse opp premiedata og eksportere til Excel![]() .
.
| Verdipapirer | Type | Gjennomsnittlig aksjekurs | Aksjer (MM) |
ΔAksjer (%) |
ΔAksjer (%) |
Verdi ($MM) |
Portefølje (%) |
ΔPortefølje (%) |
|
|---|---|---|---|---|---|---|---|---|---|
| MSTR / Strategy Inc | 0,07 | −15,36 | 29,02 | 18,69 | 18,8804 | −1,9327 | |||
| AMZN / Amazon.com, Inc. | 0,03 | −43,07 | 7,08 | −34,35 | 4,6079 | −4,5755 | |||
| MSFT / Microsoft Corporation | 0,01 | 33,43 | 6,25 | 76,79 | 4,0679 | 1,0573 | |||
| COST / Costco Wholesale Corporation | 0,01 | 9,61 | 5,34 | 14,73 | 3,4759 | −0,4880 | |||
| META / Meta Platforms, Inc. | 0,01 | 8,72 | 5,33 | 39,20 | 3,4675 | 0,2083 | |||
| WMT / Walmart Inc. | 0,05 | 15,26 | 5,21 | 28,39 | 3,3926 | −0,0648 | |||
| SPOT / Spotify Technology S.A. | 0,01 | −6,38 | 5,12 | 30,61 | 3,3282 | −0,0058 | |||
| NFLX / Netflix, Inc. | 0,00 | 0,35 | 5,03 | 44,11 | 3,2729 | 0,3015 | |||
| APO / Apollo Global Management, Inc. | 0,03 | 33,82 | 4,66 | 38,64 | 3,0342 | 0,1708 | |||
| V / Visa Inc. | 0,01 | 229,70 | 4,50 | 234,10 | 2,9255 | 1,7799 | |||
| AAPL / Apple Inc. | 0,02 | 14,29 | 4,41 | 5,56 | 2,8676 | −0,6869 | |||
| TJX / The TJX Companies, Inc. | 0,03 | 11,42 | 4,30 | 12,95 | 2,7974 | −0,4431 | |||
| KKR / KKR & Co. Inc. | 0,03 | 39,96 | 4,26 | 61,05 | 2,7733 | 0,5202 | |||
| LYV / Live Nation Entertainment, Inc. | 0,03 | 40,43 | 4,17 | 62,70 | 2,7128 | 0,5312 | |||
| KO / The Coca-Cola Company | 0,06 | 136,40 | 4,05 | 133,53 | 2,6328 | 1,1577 | |||
| MELI / MercadoLibre, Inc. | 0,00 | 31,31 | 3,97 | 75,92 | 2,5808 | 0,6613 | |||
| PGR / The Progressive Corporation | 0,01 | 188,66 | 3,96 | 172,12 | 2,5775 | 1,3382 | |||
| BX / Blackstone Inc. | 0,03 | 18,62 | 3,81 | 26,93 | 2,4806 | −0,0764 | |||
| UBER / Uber Technologies, Inc. | 0,04 | 123,02 | 3,34 | 185,63 | 2,1722 | 1,1772 | |||
| TMUS / T-Mobile US, Inc. | 0,01 | 2,98 | 1,9419 | 1,9419 | |||||
| LLY / Eli Lilly and Company | 0,00 | 2,96 | 1,9269 | 1,9269 | |||||
| AMT / American Tower Corporation | 0,01 | 2,64 | 1,7201 | 1,7201 | |||||
| ORLY / O'Reilly Automotive, Inc. | 0,02 | 3 436,27 | 2,24 | 122,54 | 1,4579 | 0,6008 | |||
| JPM / JPMorgan Chase & Co. | 0,01 | 14,04 | 2,04 | 34,74 | 1,3297 | 0,0385 | |||
| BN / Brookfield Corporation | 0,03 | 1,96 | 1,2731 | 1,2731 | |||||
| NOW / ServiceNow, Inc. | 0,00 | 1,62 | 1,0539 | 1,0539 | |||||
| SMLR / Semler Scientific, Inc. | 0,04 | 1,61 | 1,0493 | 1,0493 | |||||
| BRK.B / Berkshire Hathaway Inc. | 0,00 | −17,29 | 1,42 | −24,58 | 0,9264 | −0,6806 | |||
| PLTR / Palantir Technologies Inc. | 0,01 | 0,70 | 1,23 | 62,75 | 0,8015 | 0,1571 | |||
| GOOGL / Alphabet Inc. | 0,01 | −71,39 | 1,19 | −67,39 | 0,7716 | −2,3242 | |||
| NVDA / NVIDIA Corporation | 0,01 | 28,57 | 1,13 | 87,27 | 0,7371 | 0,2221 | |||
| BKNG / Booking Holdings Inc. | 0,00 | 123,94 | 0,92 | 181,35 | 0,5985 | 0,3202 | |||
| RCL / Royal Caribbean Cruises Ltd. | 0,00 | 79,29 | 0,85 | 173,63 | 0,5536 | 0,2889 | |||
| ABBV / AbbVie Inc. | 0,00 | −29,19 | 0,76 | −37,26 | 0,4951 | −0,5374 | |||
| SAP / SAP SE - Depositary Receipt (Common Stock) | 0,00 | 0,71 | 0,4638 | 0,4638 | |||||
| HOOD / Robinhood Markets, Inc. | 0,01 | −19,60 | 0,70 | 80,78 | 0,4528 | 0,1251 | |||
| GSCE / GS Connect S&P GSCI Enhanced Commodity Total Return ETN | 0,00 | 0,66 | 0,4261 | 0,4261 | |||||
| SONY / Sony Group Corporation - Depositary Receipt (Common Stock) | 0,02 | 0,65 | 0,4229 | 0,4229 | |||||
| CL / Colgate-Palmolive Company | 0,01 | 0,51 | 0,3331 | 0,3331 | |||||
| SHOP / Shopify Inc. | 0,00 | −25,62 | 0,51 | −10,25 | 0,3305 | −0,1513 | |||
| TSM / Taiwan Semiconductor Manufacturing Company Limited - Depositary Receipt (Common Stock) | 0,00 | 54,70 | 0,48 | 110,53 | 0,3123 | 0,1182 | |||
| NVO / Novo Nordisk A/S - Depositary Receipt (Common Stock) | 0,01 | 0,47 | 0,3045 | 0,3045 | |||||
| APP / AppLovin Corporation | 0,00 | 0,42 | 0,2726 | 0,2726 | |||||
| HUBS / HubSpot, Inc. | 0,00 | 0,42 | 0,2713 | 0,2713 | |||||
| IRM / Iron Mountain Incorporated | 0,00 | −16,25 | 0,41 | −0,24 | 0,2667 | −0,0831 | |||
| SOFI / SoFi Technologies, Inc. | 0,02 | −14,37 | 0,38 | 33,81 | 0,2446 | 0,0054 | |||
| FLUT / Flutter Entertainment plc | 0,00 | 0,36 | 0,2362 | 0,2362 | |||||
| MO / Altria Group, Inc. | 0,01 | 0,00 | 0,36 | −2,18 | 0,2335 | −0,0788 | |||
| CBRE / CBRE Group, Inc. | 0,00 | −2,36 | 0,35 | 4,44 | 0,2296 | −0,0581 | |||
| NU / Nu Holdings Ltd. | 0,02 | −28,66 | 0,34 | −4,48 | 0,2218 | −0,0820 | |||
| VZ / Verizon Communications Inc. | 0,01 | −41,49 | 0,32 | −44,23 | 0,2108 | −0,2838 | |||
| DASH / DoorDash, Inc. | 0,00 | 0,30 | 0,1965 | 0,1965 | |||||
| NIO / NIO Inc. - Depositary Receipt (Common Stock) | 0,09 | −0,23 | 0,30 | −9,97 | 0,1939 | −0,0879 | |||
| RACE / Ferrari N.V. | 0,00 | 0,29 | 0,1874 | 0,1874 | |||||
| AXP / American Express Company | 0,00 | 0,28 | 0,1841 | 0,1841 | |||||
| BABA / Alibaba Group Holding Limited - Depositary Receipt (Common Stock) | 0,00 | 0,28 | 0,1802 | 0,1802 | |||||
| LNG / Cheniere Energy, Inc. | 0,00 | −37,22 | 0,27 | −33,90 | 0,1776 | −0,1739 | |||
| UPS / United Parcel Service, Inc. | 0,00 | −41,38 | 0,26 | −46,22 | 0,1711 | −0,2451 | |||
| SPG / Simon Property Group, Inc. | 0,00 | −48,10 | 0,25 | −49,80 | 0,1626 | −0,2612 | |||
| TGT / Target Corporation | 0,00 | 0,25 | 0,1600 | 0,1600 | |||||
| PDD / PDD Holdings Inc. - Depositary Receipt (Common Stock) | 0,00 | −36,96 | 0,23 | −44,18 | 0,1529 | −0,2055 | |||
| DRI / Darden Restaurants, Inc. | 0,00 | 0,23 | 0,1529 | 0,1529 | |||||
| XOM / Exxon Mobil Corporation | 0,00 | −54,95 | 0,23 | −59,23 | 0,1522 | −0,3363 | |||
| HSY / The Hershey Company | 0,00 | 0,23 | 0,1503 | 0,1503 | |||||
| JNJ / Johnson & Johnson | 0,00 | −75,83 | 0,23 | −77,75 | 0,1490 | −0,7269 | |||
| CVX / Chevron Corporation | 0,00 | −54,75 | 0,23 | −61,36 | 0,1483 | −0,3539 | |||
| CB / Chubb Limited | 0,00 | 0,23 | 0,1470 | 0,1470 | |||||
| IBN / ICICI Bank Limited - Depositary Receipt (Common Stock) | 0,01 | 0,22 | 0,1457 | 0,1457 | |||||
| DKNG / DraftKings Inc. | 0,01 | 0,22 | 0,1451 | 0,1451 | |||||
| ASML / ASML Holding N.V. - Depositary Receipt (Common Stock) | 0,00 | 0,22 | 0,1425 | 0,1425 | |||||
| MRK / Merck & Co., Inc. | 0,00 | 0,22 | 0,1418 | 0,1418 | |||||
| UL / Unilever PLC - Depositary Receipt (Common Stock) | 0,00 | 0,21 | 0,1379 | 0,1379 | |||||
| AZO / AutoZone, Inc. | 0,00 | −81,31 | 0,21 | −81,77 | 0,1379 | −0,8520 | |||
| COIN / Coinbase Global, Inc. | 0,00 | −66,08 | 0,21 | −31,05 | 0,1373 | −0,1232 | |||
| AZN / AstraZeneca PLC - Depositary Receipt (Common Stock) | 0,00 | 0,21 | 0,1340 | 0,1340 | |||||
| MUFG / Mitsubishi UFJ Financial Group, Inc. - Depositary Receipt (Common Stock) | 0,01 | 30,09 | 0,19 | 31,03 | 0,1236 | 0,0002 | |||
| USA / Liberty All-Star Equity Fund | 0,02 | 0,15 | 0,0995 | 0,0995 | |||||
| ARI / Apollo Commercial Real Estate Finance, Inc. | 0,01 | 0,01 | 0,11 | 1,87 | 0,0709 | −0,0202 | |||
| MCD / McDonald's Corporation | 0,00 | −100,00 | 0,00 | 0,0000 | |||||
| ISRG / Intuitive Surgical, Inc. | 0,00 | −100,00 | 0,00 | 0,0000 | |||||
| GE / General Electric Company | 0,00 | −100,00 | 0,00 | 0,0000 | |||||
| TSLA / Tesla, Inc. | 0,00 | −100,00 | 0,00 | −100,00 | −0,1966 | ||||
| AMD / Advanced Micro Devices, Inc. | 0,00 | −100,00 | 0,00 | −100,00 | −0,2188 | ||||
| GIS / General Mills, Inc. | 0,00 | −100,00 | 0,00 | 0,0000 | |||||
| RDDT / Reddit, Inc. | 0,00 | −100,00 | 0,00 | 0,0000 | |||||
| WRBY / Warby Parker Inc. | 0,00 | −100,00 | 0,00 | 0,0000 | |||||
| NEE / NextEra Energy, Inc. | 0,00 | −100,00 | 0,00 | 0,0000 | |||||
| T / AT&T Inc. | 0,00 | −100,00 | 0,00 | 0,0000 | |||||
| AFRM / Affirm Holdings, Inc. | 0,00 | −100,00 | 0,00 | 0,0000 | |||||
| CELH / Celsius Holdings, Inc. | 0,00 | −100,00 | 0,00 | 0,0000 | |||||
| CMG / Chipotle Mexican Grill, Inc. | 0,00 | −100,00 | 0,00 | 0,0000 | |||||
| NKE / NIKE, Inc. | 0,00 | −100,00 | 0,00 | 0,0000 | |||||
| MTN / Vail Resorts, Inc. | 0,00 | −100,00 | 0,00 | 0,0000 |