Grunnleggende statistikk
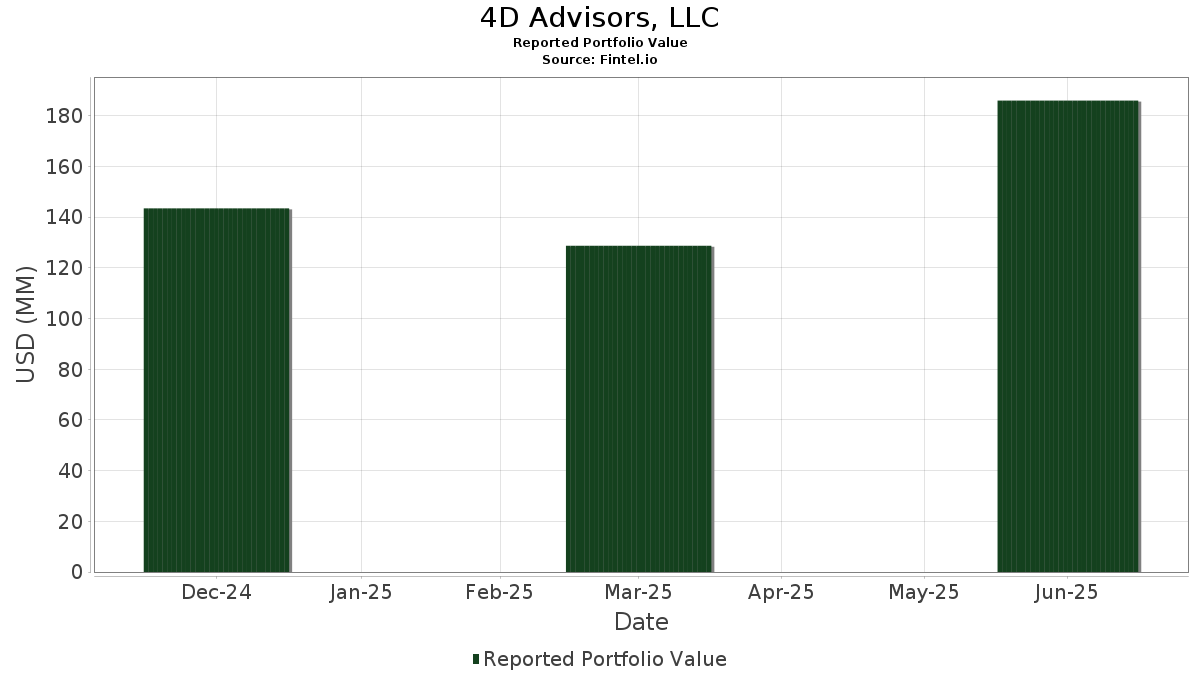
| Porteføljeverdi | $ 185 997 070 |
| Nåværende posisjoner | 34 |
Siste beholdninger, prestasjoner, forvaltet kapital (fra 13F, 13D)
4D Advisors, LLC har oppgitt 34 totale beholdninger i sine siste SEC-arkiveringer. Siste porteføljeverdi er beregnet til 185 997 070 USD. Faktisk forvaltet kapital (AUM) er denne verdien pluss kontanter (som ikke er oppgitt). 4D Advisors, LLCs største beholdninger er Turning Point Brands, Inc. (US:TPB) , Axon Enterprise, Inc. (US:AXON) , American Public Education, Inc. (US:APEI) , Federal Signal Corporation (US:FSS) , and Celsius Holdings, Inc. (US:CELH) . 4D Advisors, LLCs nye posisjoner inkluderer Sterling Infrastructure, Inc. (US:STRL) , Newmont Corporation (US:NEM) , HNI Corporation (US:HNI) , Waste Connections, Inc. (US:WCN) , and Guidewire Software, Inc. (US:GWRE) .
De største økningene dette kvartalet
Vi bruker endringen i porteføljeallokeringen fordi dette er det mest meningsfulle målet. Endringer kan skyldes handler eller endringer i aksjekursene.
| Verdipapirer | Aksjer (MM) |
Verdi (MM$) |
Portefølje % | ΔPortefølje % |
|---|---|---|---|---|
| 0,22 | 16,82 | 9,0437 | 4,6567 | |
| 0,03 | 6,92 | 3,7215 | 3,7215 | |
| 0,10 | 5,83 | 3,1323 | 3,1323 | |
| 0,12 | 5,66 | 3,0407 | 3,0407 | |
| 0,03 | 5,60 | 3,0117 | 3,0117 | |
| 0,01 | 8,05 | 4,3254 | 2,9737 | |
| 0,11 | 7,37 | 3,9607 | 2,8593 | |
| 0,02 | 4,71 | 2,5318 | 2,5318 | |
| 0,50 | 4,43 | 2,3818 | 2,3818 | |
| 0,28 | 8,68 | 4,6673 | 2,3264 |
De største reduksjonene dette kvartalet
Vi bruker endringen i porteføljeallokeringen fordi dette er det mest meningsfulle målet. Endringer kan skyldes handler eller endringer i aksjekurser.
| Verdipapirer | Aksjer (MM) |
Verdi (MM$) |
Portefølje % | ΔPortefølje % |
|---|---|---|---|---|
| 0,02 | 4,25 | 2,2863 | −2,6199 | |
| 0,03 | 7,40 | 3,9776 | −1,6663 | |
| 0,03 | 4,27 | 2,2976 | −1,5647 | |
| 0,00 | 0,00 | −1,4299 | ||
| 0,02 | 5,76 | 3,0966 | −1,4022 | |
| 0,01 | 3,28 | 1,7610 | −1,2064 | |
| 0,01 | 10,35 | 5,5642 | −0,9735 | |
| 0,10 | 4,17 | 2,2414 | −0,9555 | |
| 0,01 | 5,67 | 3,0491 | −0,9003 | |
| 0,12 | 1,62 | 0,8737 | −0,4014 |
13F- og Fondsarkiveringer
Dette skjemaet ble sendt inn den 2025-08-14 for rapporteringsperioden 2025-06-30. Klikk på lenkeikonet for å se hele transaksjonshistorikken.
Oppgradere for å låse opp premiedata og eksportere til Excel![]() .
.
| Verdipapirer | Type | Gjennomsnittlig aksjekurs | Aksjer (MM) |
ΔAksjer (%) |
ΔAksjer (%) |
Verdi ($MM) |
Portefølje (%) |
ΔPortefølje (%) |
|
|---|---|---|---|---|---|---|---|---|---|
| TPB / Turning Point Brands, Inc. | 0,22 | 133,68 | 16,82 | 197,91 | 9,0437 | 4,6567 | |||
| AXON / Axon Enterprise, Inc. | 0,01 | −21,88 | 10,35 | 22,98 | 5,5642 | −0,9735 | |||
| APEI / American Public Education, Inc. | 0,28 | 111,11 | 8,68 | 188,12 | 4,6673 | 2,3264 | |||
| FSS / Federal Signal Corporation | 0,08 | 77,78 | 8,51 | 157,27 | 4,5773 | 2,0059 | |||
| CELH / Celsius Holdings, Inc. | 0,17 | 16,67 | 8,12 | 51,94 | 4,3647 | 0,2138 | |||
| MPWR / Monolithic Power Systems, Inc. | 0,01 | 266,67 | 8,05 | 362,62 | 4,3254 | 2,9737 | |||
| MASI / Masimo Corporation | 0,04 | 50,00 | 7,57 | 51,44 | 4,0699 | 0,1870 | |||
| RSG / Republic Services, Inc. | 0,03 | 0,00 | 7,40 | 1,84 | 3,9776 | −1,6663 | |||
| MTH / Meritage Homes Corporation | 0,11 | 450,00 | 7,37 | 419,83 | 3,9607 | 2,8593 | |||
| STRL / Sterling Infrastructure, Inc. | 0,03 | 6,92 | 3,7215 | 3,7215 | |||||
| NEM / Newmont Corporation | 0,10 | 5,83 | 3,1323 | 3,1323 | |||||
| VEEV / Veeva Systems Inc. | 0,02 | −20,00 | 5,76 | −0,54 | 3,0966 | −1,4022 | |||
| PWR / Quanta Services, Inc. | 0,01 | −25,00 | 5,67 | 11,57 | 3,0491 | −0,9003 | |||
| HNI / HNI Corporation | 0,12 | 5,66 | 3,0407 | 3,0407 | |||||
| WCN / Waste Connections, Inc. | 0,03 | 5,60 | 3,0117 | 3,0117 | |||||
| GWRE / Guidewire Software, Inc. | 0,02 | 4,71 | 2,5318 | 2,5318 | |||||
| CDE / Coeur Mining, Inc. | 0,50 | 4,43 | 2,3818 | 2,3818 | |||||
| FORM / FormFactor, Inc. | 0,12 | 4,30 | 2,3125 | 2,3125 | |||||
| DVA / DaVita Inc. | 0,03 | −7,69 | 4,27 | −14,04 | 2,2976 | −1,5647 | |||
| LOPE / Grand Canyon Education, Inc. | 0,02 | −38,36 | 4,25 | −32,67 | 2,2863 | −2,6199 | |||
| LAD / Lithia Motors, Inc. | 0,01 | 4,22 | 2,2703 | 2,2703 | |||||
| BBSI / Barrett Business Services, Inc. | 0,10 | 0,00 | 4,17 | 1,31 | 2,2414 | −0,9555 | |||
| FIX / Comfort Systems USA, Inc. | 0,01 | −25,00 | 4,02 | 24,76 | 2,1622 | −0,3420 | |||
| BOOT / Boot Barn Holdings, Inc. | 0,03 | 25,00 | 3,80 | 76,91 | 2,0430 | 0,3738 | |||
| SHYF / The Shyft Group, Inc. | 0,30 | 3,76 | 2,0226 | 2,0226 | |||||
| BLBD / Blue Bird Corporation | 0,09 | 54,55 | 3,67 | 106,07 | 1,9724 | 0,5893 | |||
| VECO / Veeco Instruments Inc. | 0,17 | 3,45 | 1,8572 | 1,8572 | |||||
| GPI / Group 1 Automotive, Inc. | 0,01 | −25,00 | 3,28 | −14,24 | 1,7610 | −1,2064 | |||
| ONTO / Onto Innovation Inc. | 0,03 | 3,03 | 1,6279 | 1,6279 | |||||
| TRNS / Transcat, Inc. | 0,04 | 3,01 | 1,6176 | 1,6176 | |||||
| ILMN / Illumina, Inc. | 0,03 | 2,86 | 1,5389 | 1,5389 | |||||
| ESTA / Establishment Labs Holdings Inc. | 0,07 | 2,78 | 1,4926 | 1,4926 | |||||
| TECH / Bio-Techne Corporation | 0,04 | 2,06 | 1,1065 | 1,1065 | |||||
| RXST / RxSight, Inc. | 0,12 | 92,31 | 1,62 | −0,98 | 0,8737 | −0,4014 | |||
| TDW / Tidewater Inc. | 0,00 | −100,00 | 0,00 | 0,0000 | |||||
| SLQT / SelectQuote, Inc. | 0,00 | −100,00 | 0,00 | 0,0000 | |||||
| APG / APi Group Corporation | 0,00 | −100,00 | 0,00 | 0,0000 | |||||
| SWIM / Latham Group, Inc. | 0,00 | −100,00 | 0,00 | 0,0000 | |||||
| AAON / AAON, Inc. | 0,00 | −100,00 | 0,00 | 0,0000 | |||||
| AR / Antero Resources Corporation | 0,00 | −100,00 | 0,00 | 0,0000 | |||||
| GOCO / GoHealth, Inc. | 0,00 | −100,00 | 0,00 | −100,00 | −1,4299 | ||||
| SKY / Champion Homes, Inc. | 0,00 | −100,00 | 0,00 | 0,0000 | |||||
| CSWI / CSW Industrials, Inc. | 0,00 | −100,00 | 0,00 | 0,0000 | |||||
| GRBK / Green Brick Partners, Inc. | 0,00 | −100,00 | 0,00 | 0,0000 | |||||
| KNF / Knife River Corporation | 0,00 | −100,00 | 0,00 | 0,0000 | |||||
| USPH / U.S. Physical Therapy, Inc. | 0,00 | −100,00 | 0,00 | 0,0000 | |||||
| WM / Waste Management, Inc. | 0,00 | −100,00 | 0,00 | 0,0000 |